![FVG and Void indicator for ICT in MT4 Download - Free - [TradingFinder]](https://cdn.tradingfinder.com/image/107033/10-41-en-fvg-void-mt4.webp)
![FVG and Void indicator for ICT in MT4 Download - Free - [TradingFinder] 0](https://cdn.tradingfinder.com/image/107033/10-41-en-fvg-void-mt4.webp)
![FVG and Void indicator for ICT in MT4 Download - Free - [TradingFinder] 1](https://cdn.tradingfinder.com/image/44053/11-06-en-fvg-void-mt4-02.avif)
![FVG and Void indicator for ICT in MT4 Download - Free - [TradingFinder] 2](https://cdn.tradingfinder.com/image/44050/11-06-en-fvg-void-mt4-03.avif)
![FVG and Void indicator for ICT in MT4 Download - Free - [TradingFinder] 3](https://cdn.tradingfinder.com/image/44064/11-06-en-fvg-void-mt4-04.avif)
The Fair Value Gap and Void (FVG + Void) indicator is an efficient tool for ICT-style and SmartMoney-style traders looking to identify and analyze FVGs and price gaps on the Meta Trader 4 (MT4) platform.
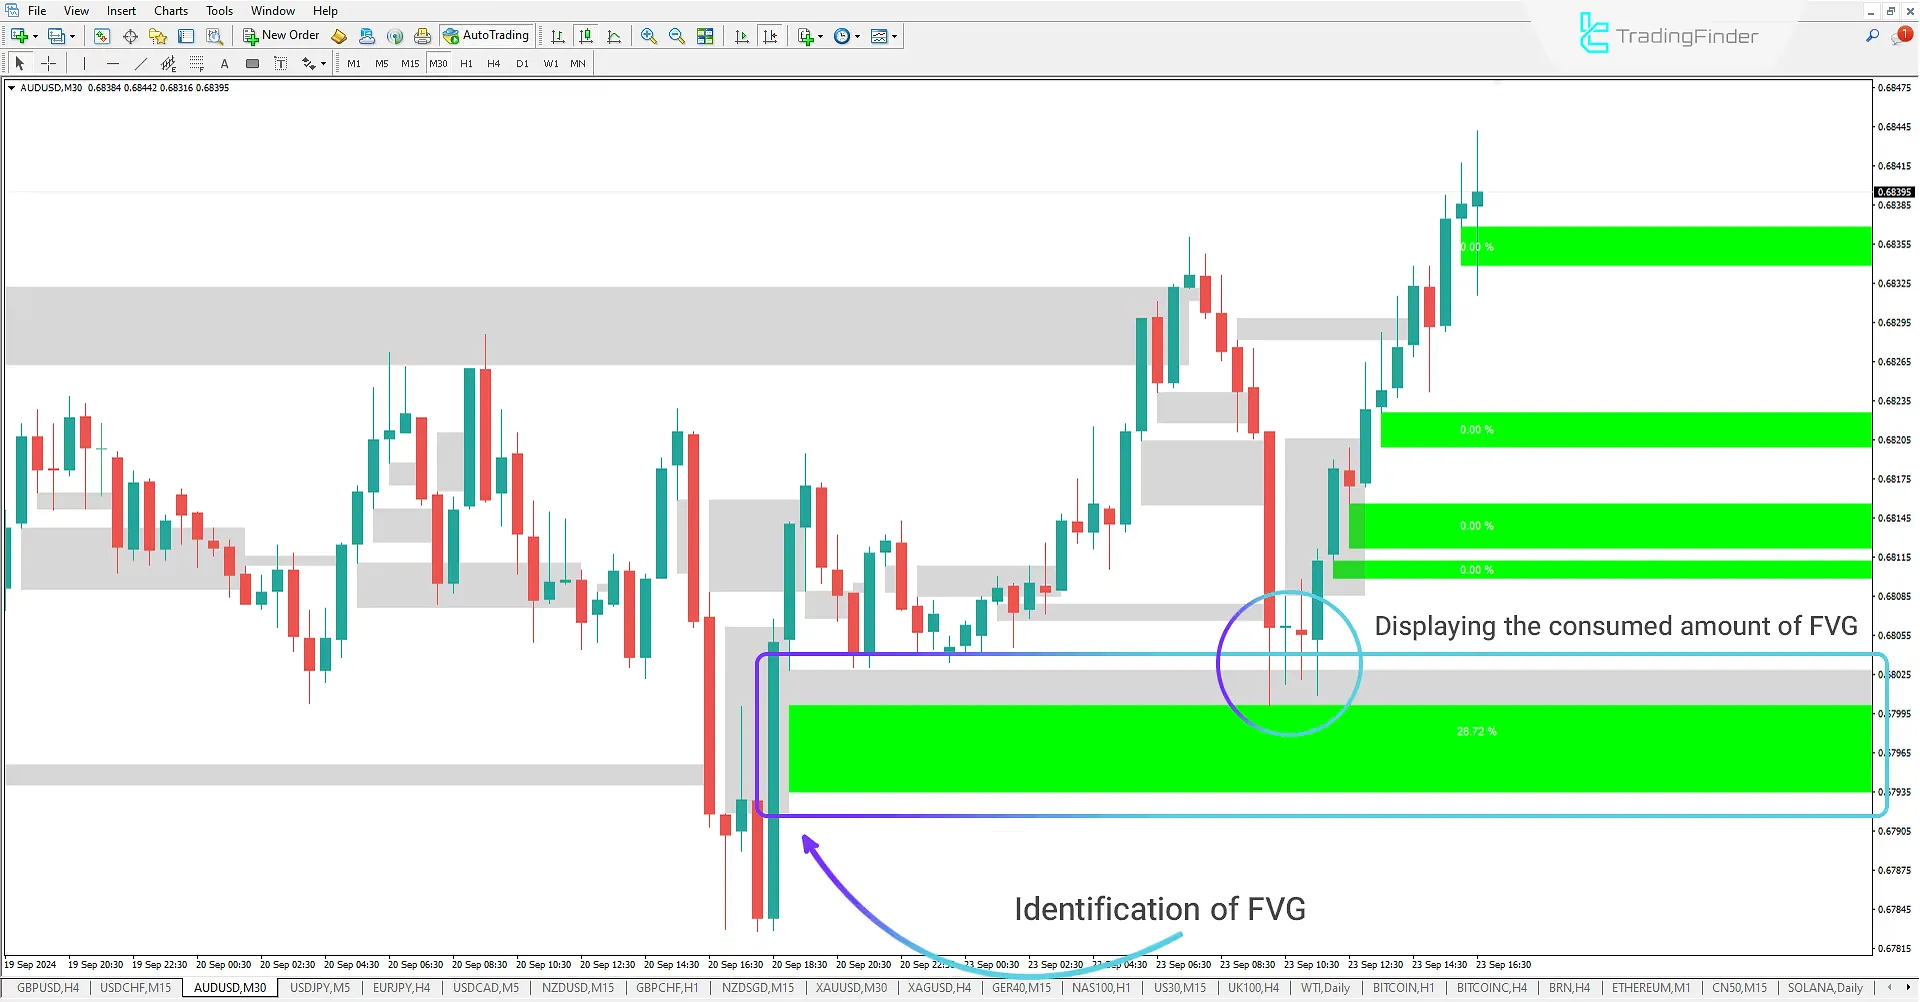
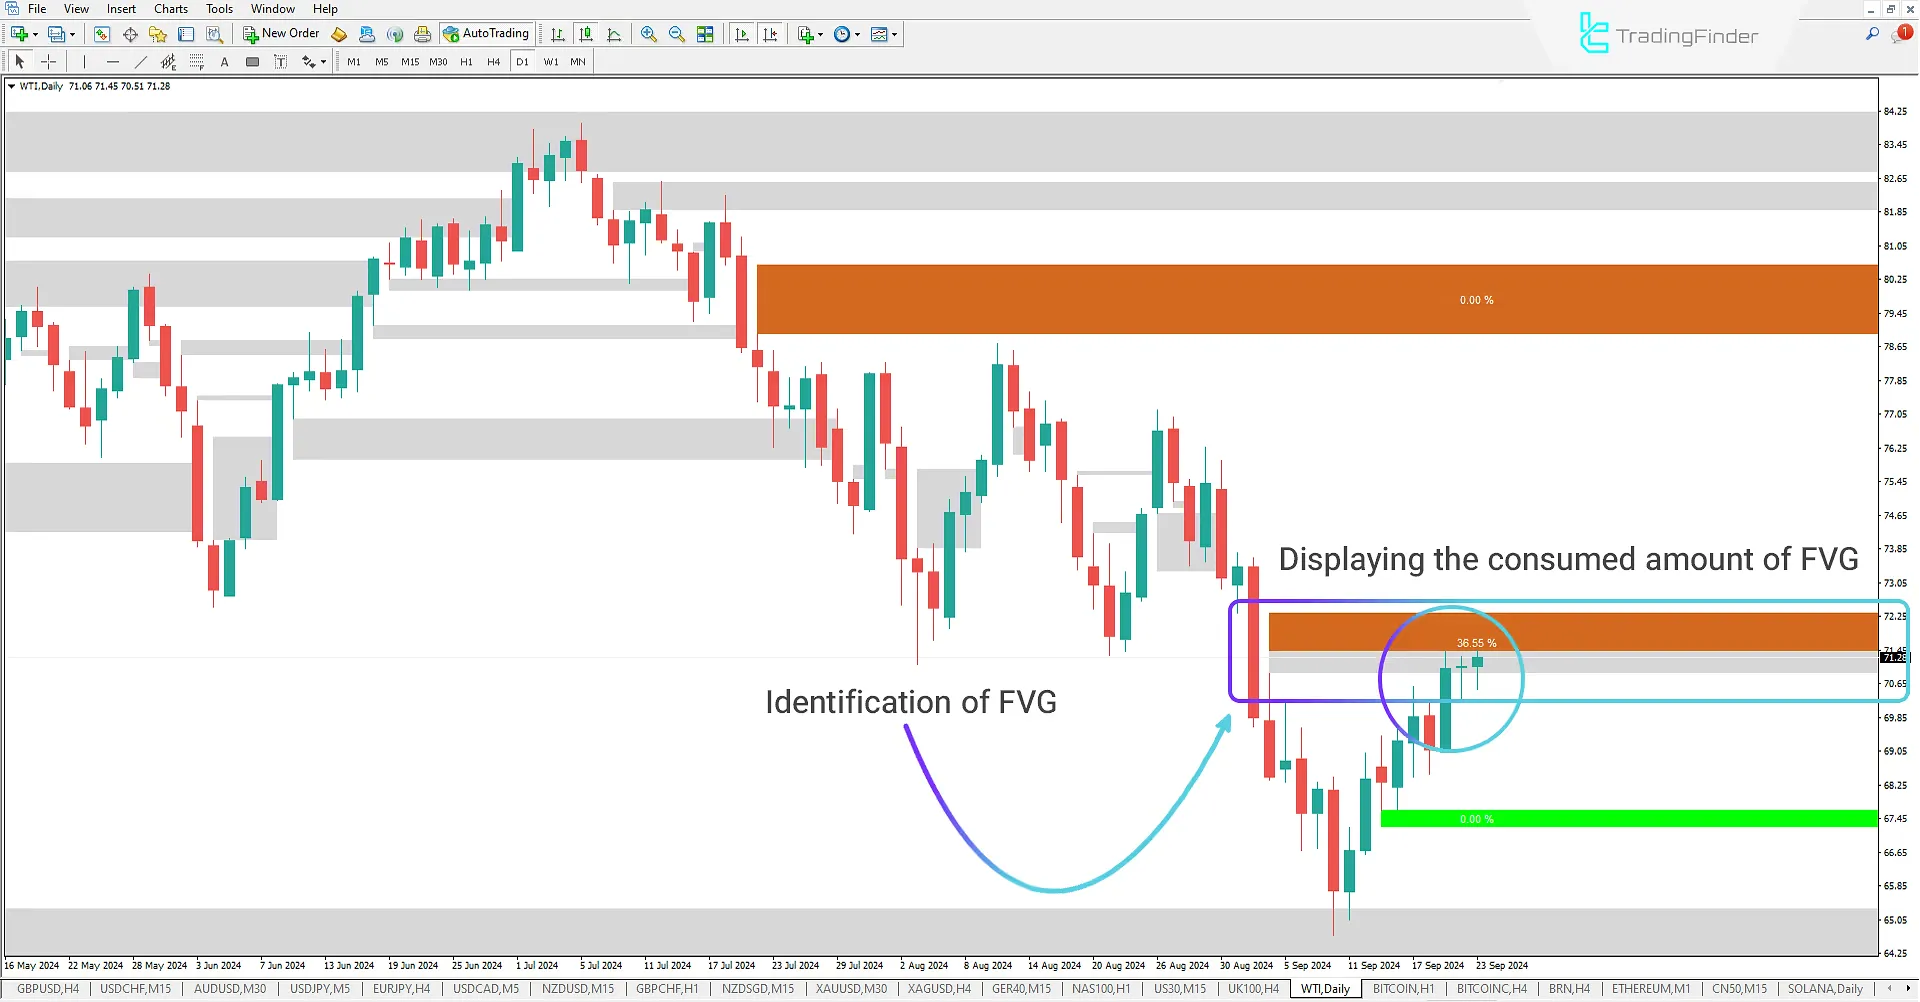
This indicator accurately identifies bullish imbalances, displaying them as green rectangles and bearish imbalances as brown rectangles on the chart.
When the price returns to these zones and begins to consume the existing orders, the indicator automatically displays the percentage of the zone that has been consumed. This helps traders better understand the market conditions and make more effective trading decisions.
FVG + Void Indicator Table
Indicator Categories: | ICT MT4 Indicators Smart Money MT4 Indicators Supply & Demand MT4 Indicators |
Platforms: | MetaTrader 4 Indicators |
Trading Skills: | Advanced |
Indicator Types: | Leading MT4 Indicators Reversal MT4 Indicators |
Timeframe: | Multi-Timeframe MT4 Indicators |
Trading Style: | Day Trading MT4 Indicators Intraday MT4 Indicators Fast Scalper MT4 Indicators Scalper MT4 Indicators |
Trading Instruments: | Forward Market MT4 Indicators Indices Market MT4 Indicators Cryptocurrency MT4 Indicators Forex MT4 Indicators |
Indicator at a Glance
The Fair Value Gap and Price Voids (FVG+Void) Indicator is an ideal tool for traders seeking to identify Fair Value Gaps (FVG) on price charts. With its unique feature, the indicator displays the consumed portion of the fair value gap area as it gets filled.
This tool helps traders better understand price voids and fair value gap zones, allowing them to utilize this information in their analysis effectively.
Bullish FVG Identification and Consumption

In the 30-minute AUD/USD chart, the FVG + Void indicator helps traders identify and display bullish FVG zones in green. In this example, the price moves downward toward the 0.68025 price level and enters the FVG zone. The indicator displays the consumed area in gray as the zone is consumed. Additionally, by showing the percentage of the zone that has been consumed, this indicator helps traders analyze the market conditions and make more informed trading decisions.
Bearish FVG Identification and Consumption

In the daily WTI Oil chart, the FVG + Void indicator identifies and displays bearish FVG zones in brown, helping traders visualize the key market imbalance zones. In this example, the price moves upward toward the 71.0 price level and enters the FVG zone. As the zone is consumed, the indicator shows the consumed area in gray. Additionally, the indicator displays the percentage of the consumed area, aiding traders in analyzing the market and making precise decisions.
Indicator Settings

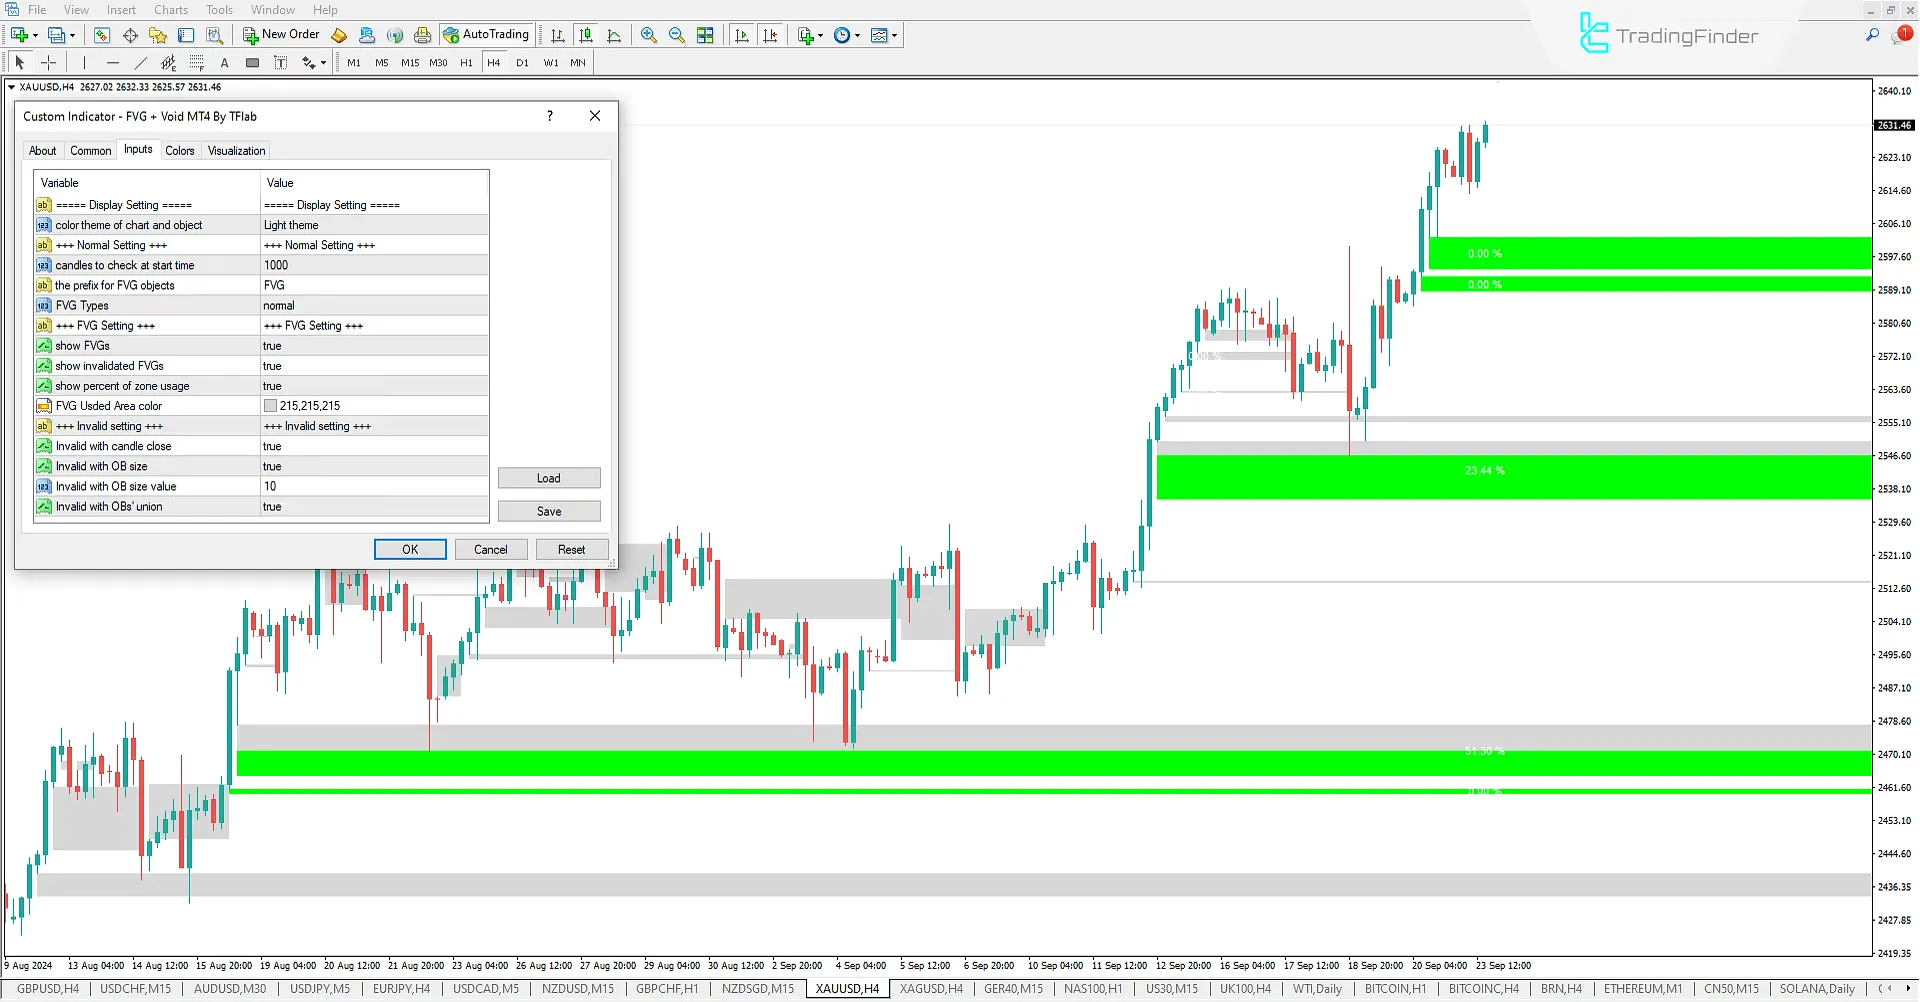
Display Setting
- The color theme of the chart and object: Choose a chart theme
Normal Setting
- Candles to check at start time: Select the number of candles to check
- FVG Types: Choose from 6 FVG drawing models: Normal, Very Aggressive, Aggressive, Defensive, Very Defensive, and The furthest or first FVG in the same trend
FVG Setting
- Show FVGs: Enable/turn off the FVG display
- Show invalidated FVGs: Display invalidated FVGs
- Show percent of zone usage: Show percentage of zone consumption
- FVG Used Area color: Set the color for the used FVG area
Invalid setting
- Invalid with candle close: Invalidate the zone upon candle close
- Invalid with OB size: Invalidate the zone based on the order block size
- Invalid with OB size value: Invalidate the zone based on the order block size value
- Invalid with OBs' union: Invalidate the zone based on the union of OBs
Conclusion
The Fair Value Gap and Void (FVG + Void) indicator uses a specialized algorithm to identify FVG zones automatically and helps traders quickly recognize these key areas. This indicator provides a clearer view of imbalance zones by drawing green rectangles for bullish FVGs and brown rectangles for bearish FVGs. A vital feature of this indicator is its ability to display the percentage of the zone that has been consumed, allowing traders to make more accurate decisions based on market analysis.
FVG Void indicator ICT MT4 PDF
FVG Void indicator ICT MT4 PDF
Click to download FVG Void indicator ICT MT4 PDFWhat is the Fair Value Gap and Void Indicator (FVG + Void)?
The FVG + Void indicator is a tool that uses a special algorithm to identify price imbalance zones (FVG) and display them as green rectangles for bullish FVGs and brown rectangles for bearish FVGs.
Does this indicator provide additional information?
Yes, one of the standout features of this indicator is its ability to display the percentage of the consumed FVG zone. This information helps traders make better decisions based on market analysis.


