![Heiken Ashi Candles Indicator for MetaTrader 4 Download - Free - [TFlab]](https://cdn.tradingfinder.com/image/204294/4-44-en-heiken-ashi-candles-mt4-1.webp)
![Heiken Ashi Candles Indicator for MetaTrader 4 Download - Free - [TFlab] 0](https://cdn.tradingfinder.com/image/204294/4-44-en-heiken-ashi-candles-mt4-1.webp)
![Heiken Ashi Candles Indicator for MetaTrader 4 Download - Free - [TFlab] 1](https://cdn.tradingfinder.com/image/204287/4-44-en-heiken-ashi-candles-mt4-2.webp)
![Heiken Ashi Candles Indicator for MetaTrader 4 Download - Free - [TFlab] 2](https://cdn.tradingfinder.com/image/204286/4-44-en-heiken-ashi-candles-mt4-3.webp)
![Heiken Ashi Candles Indicator for MetaTrader 4 Download - Free - [TFlab] 3](https://cdn.tradingfinder.com/image/204285/4-44-en-heiken-ashi-candles-mt4-4.webp)
The Heiken Ashi Candles indicator is one of the efficient tools within MetaTrader 4 indicators, designed to effortlessly identify market trends and potential reversals.
As a result, it provides a clearer and more fluid depiction of price movements on the chart, making trend analysis easier for traders.
Indicator Specifications Table
The table below summarizes the key features of this indicator:
Indicator Categories: | Price Action MT4 Indicators Trading Assist MT4 Indicators Candle Sticks MT4 Indicators |
Platforms: | MetaTrader 4 Indicators |
Trading Skills: | Elementary |
Indicator Types: | Breakout MT4 Indicators Reversal MT4 Indicators |
Timeframe: | Multi-Timeframe MT4 Indicators |
Trading Style: | Day Trading MT4 Indicators |
Trading Instruments: | Share Stocks MT4 Indicators Forward Market MT4 Indicators Stock Market MT4 Indicators Cryptocurrency MT4 Indicators Forex MT4 Indicators |
Overview of the Indicator
Prices are computed differently than traditional candlesticks to calculate Heiken Ashi Candles. This method involves averaging the values of open, closed, high, and low prices over a specific time period. This averaging process ensures data smoothing and reduces unnecessary noise and volatility.
Additionally, each new candle's open and close prices are derived from the previous candle's data to create a gradual and smoother progression on the chart.
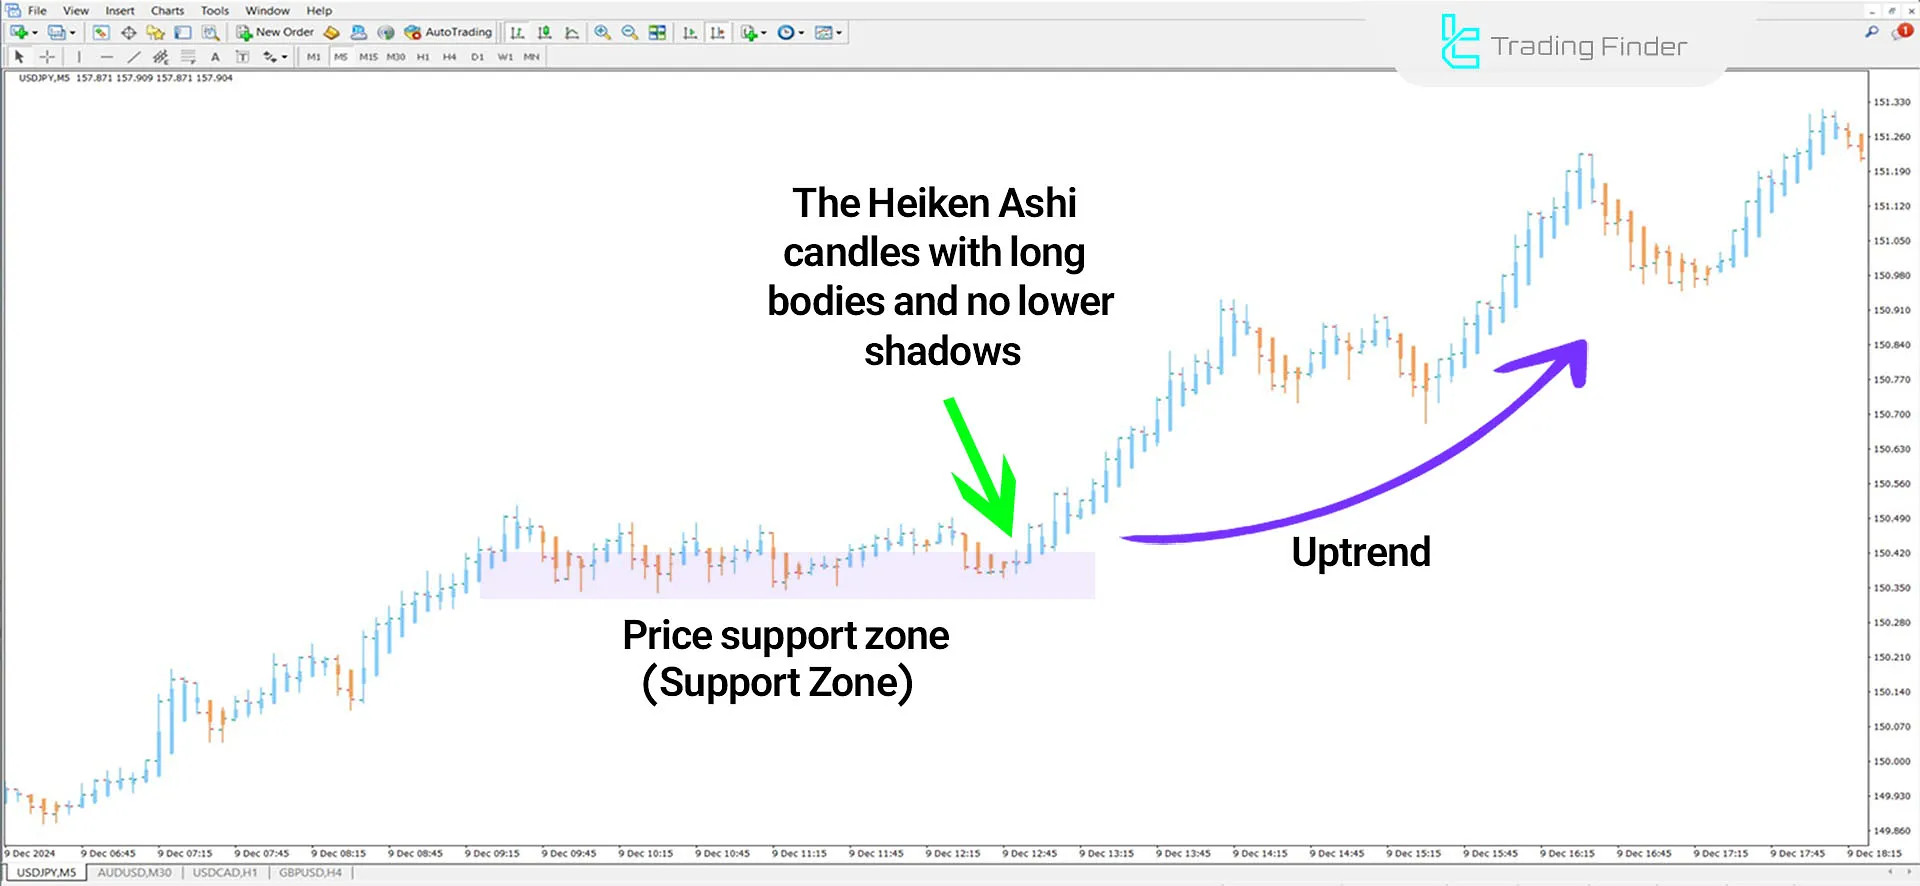
Indicator in an Uptrend
In the USD/JPY chart, green candles without lower shadows and larger bodies indicate a strong uptrend.
Traders can anticipate market movements in key areas, such as support zones or order blocks, allowing them to maintain or increase their buy positions.

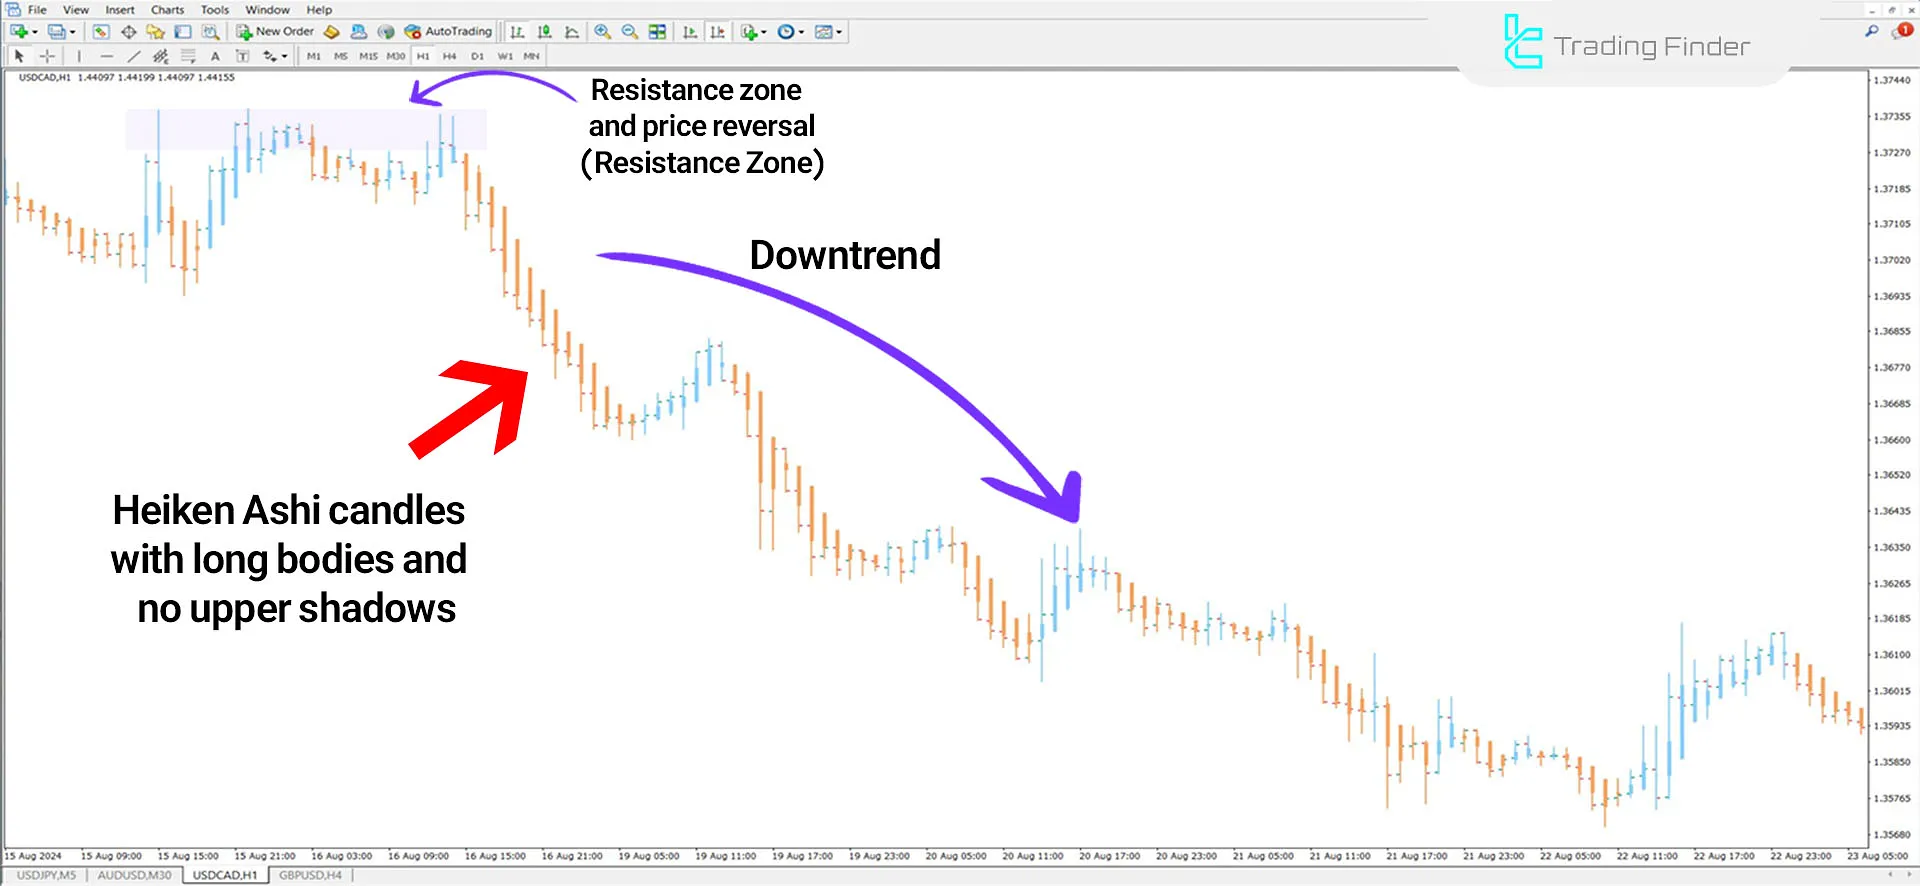
Indicator in a Downtrend
The chart below shows the USD/CAD pair. Red candles with long bodies and no upper shadows signify the dominance of sellers and the continuation of a downtrend.
After receiving the necessary confirmations, traders can enter sell positions in specific zones.

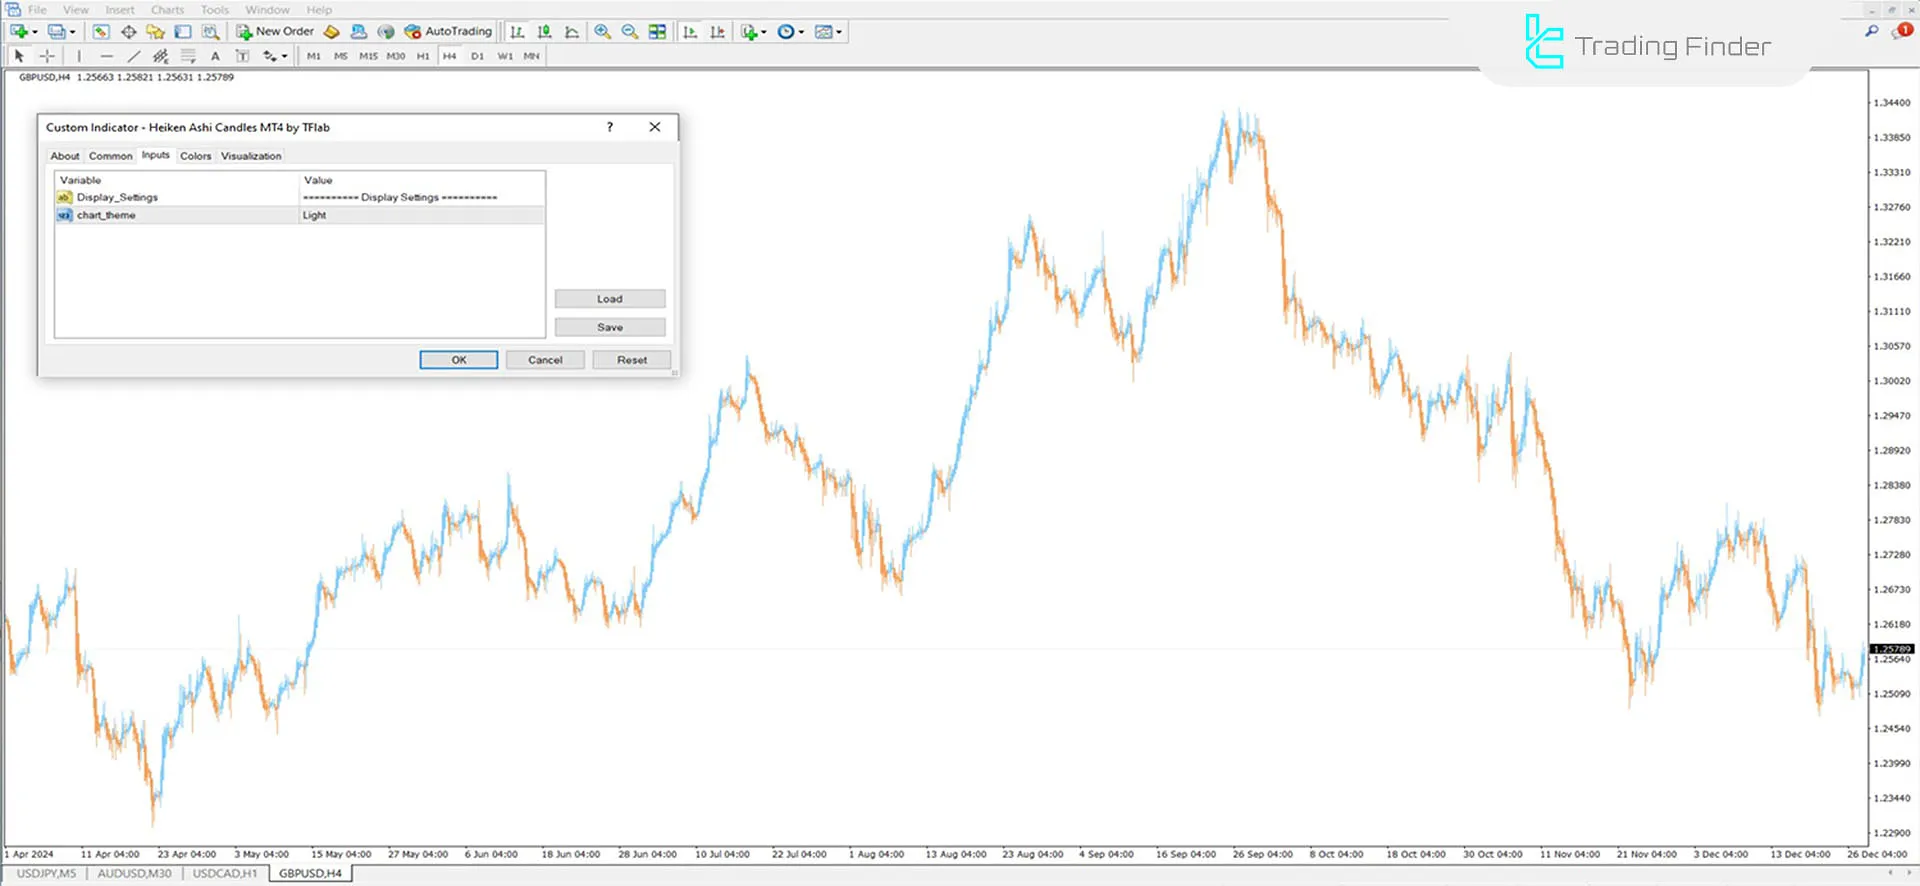
Indicator Settings
The complete configuration details are displayed in the image below:

- Chart Theme: The background theme of the indicator
Conclusion
The Heiken Ashi Candles Indicator is easily accessible on the MetaTrader 4 (MT4) platform and helps identify market trends across various timeframes.
Due to its smoother trend visualization, this tool is highly beneficial for initial trend analysis.
Heiken Ashi Candles MT4 PDF
Heiken Ashi Candles MT4 PDF
Click to download Heiken Ashi Candles MT4 PDFWhat is the Heiken Ashi Candles Indicator?
The Heiken Ashi Indicator is a technical analysis tool for identifying market trends and potential reversals.
How does Heiken Ashi work?
It smooths the chart and removes unnecessary noise by averaging the open, closed, high, and low prices.


