


TheHeiken Ashi Real Indicator is an advanced and updated version of the classic Heiken Ashi indicator, developed for the MetaTrader 4 platform. This trading tool enables traders to identify market trends with improved accuracy.
Using the crossover of the two main lines in its structure, users can receive buy or sell entry signals and make more informed trading decisions.
Heiken Ashi Real Indicator Table
Below are the general specifications of the Heiken Ashi Real Indicator:
Indicator Categories: | Signal & Forecast MT4 Indicators Currency Strength MT4 Indicators Trading Assist MT4 Indicators Candle Sticks MT4 Indicators |
Platforms: | MetaTrader 4 Indicators |
Trading Skills: | Intermediate |
Indicator Types: | Lagging MT4 Indicators |
Timeframe: | H4-H1 Time Tradingview Indicators M15-M30 Time MT4 Indicators |
Trading Style: | Day Trading MT4 Indicators Intraday MT4 Indicators Scalper MT4 Indicators |
Trading Instruments: | Share Stocks MT4 Indicators Indices Market MT4 Indicators Stock Market MT4 Indicators Forex MT4 Indicators |
Indicator at a Glance
The Heiken Ashi Real Indicator is a practical tool that displays market trends using the Heiken Ashi candle open line (red) and the close line (blue).
When the close line crosses above the open line, traders may enter buy positions. When the close line crosses below, they may open sell positions.
This method allows traders to execute trades more efficiently in alignment with market trend changes.
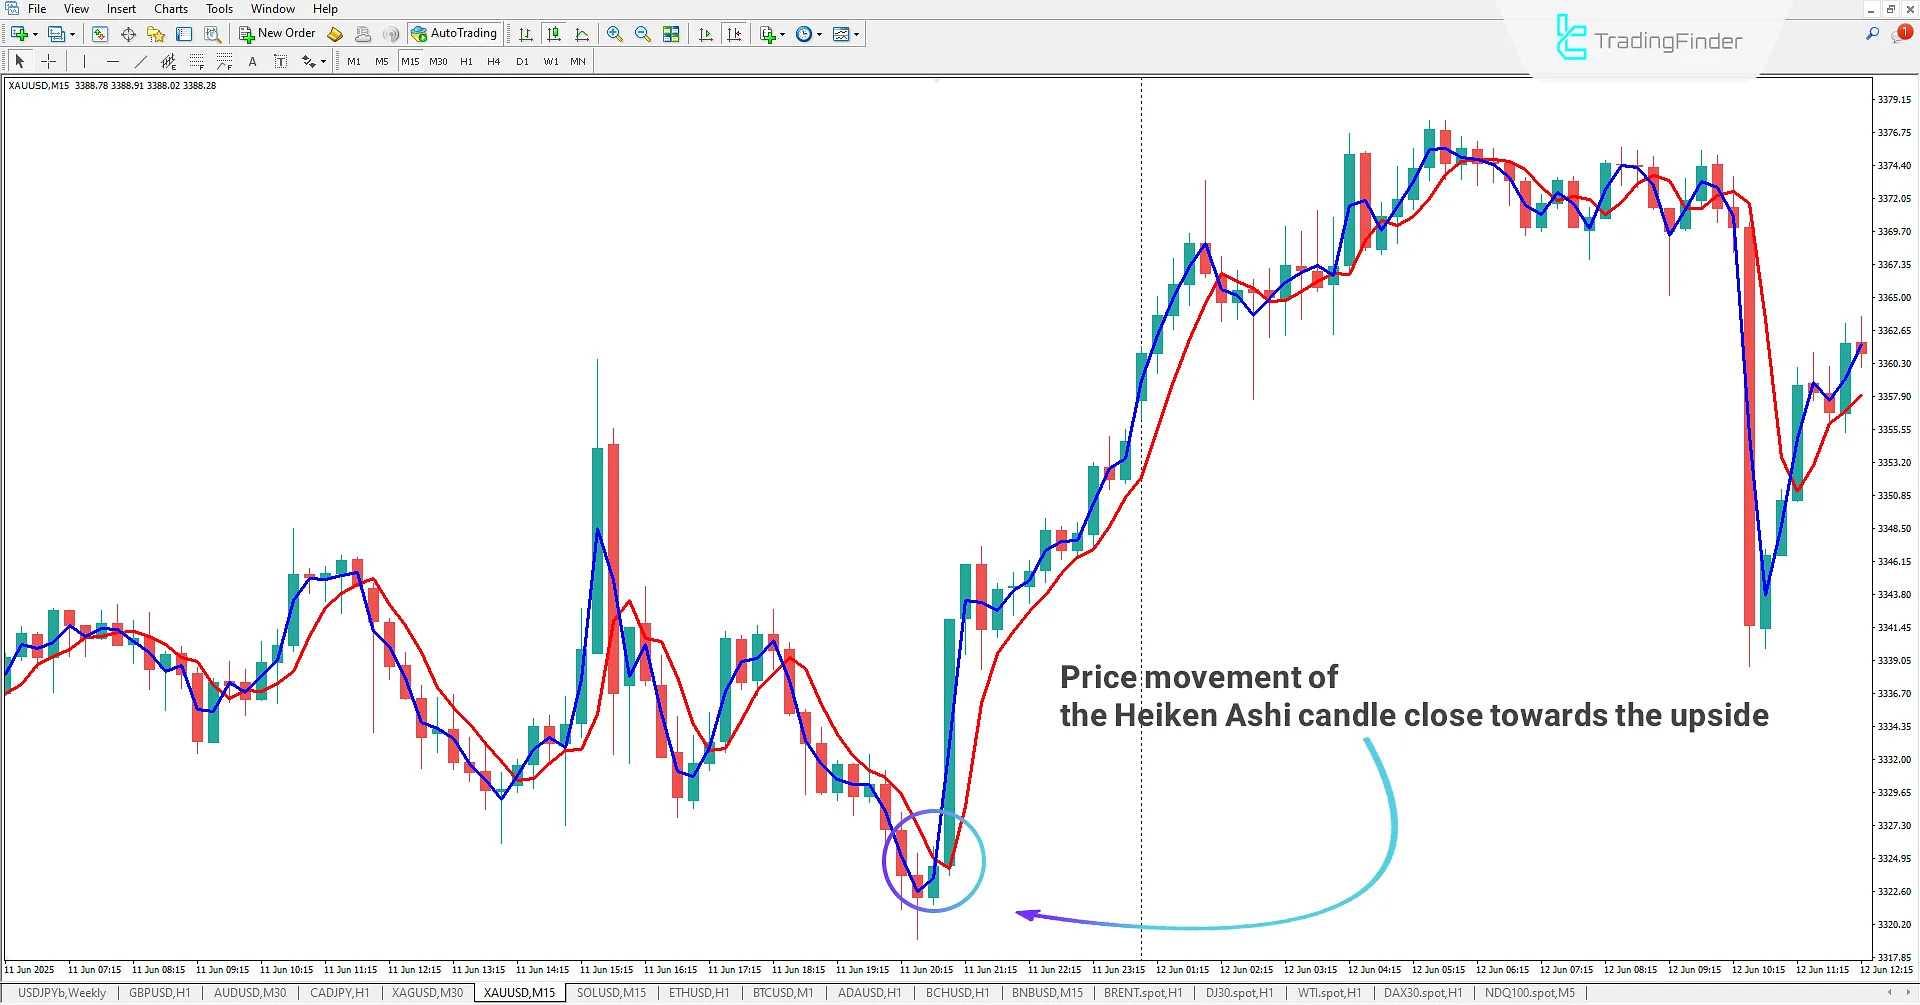
Bullish Trend
On the 15-minute XAUUSD chart, the Heiken Ashi Real Indicator signals an uptrend when the blue close line crosses upward.
Traders can follow this movement and enter long positions to capitalize on market opportunities.
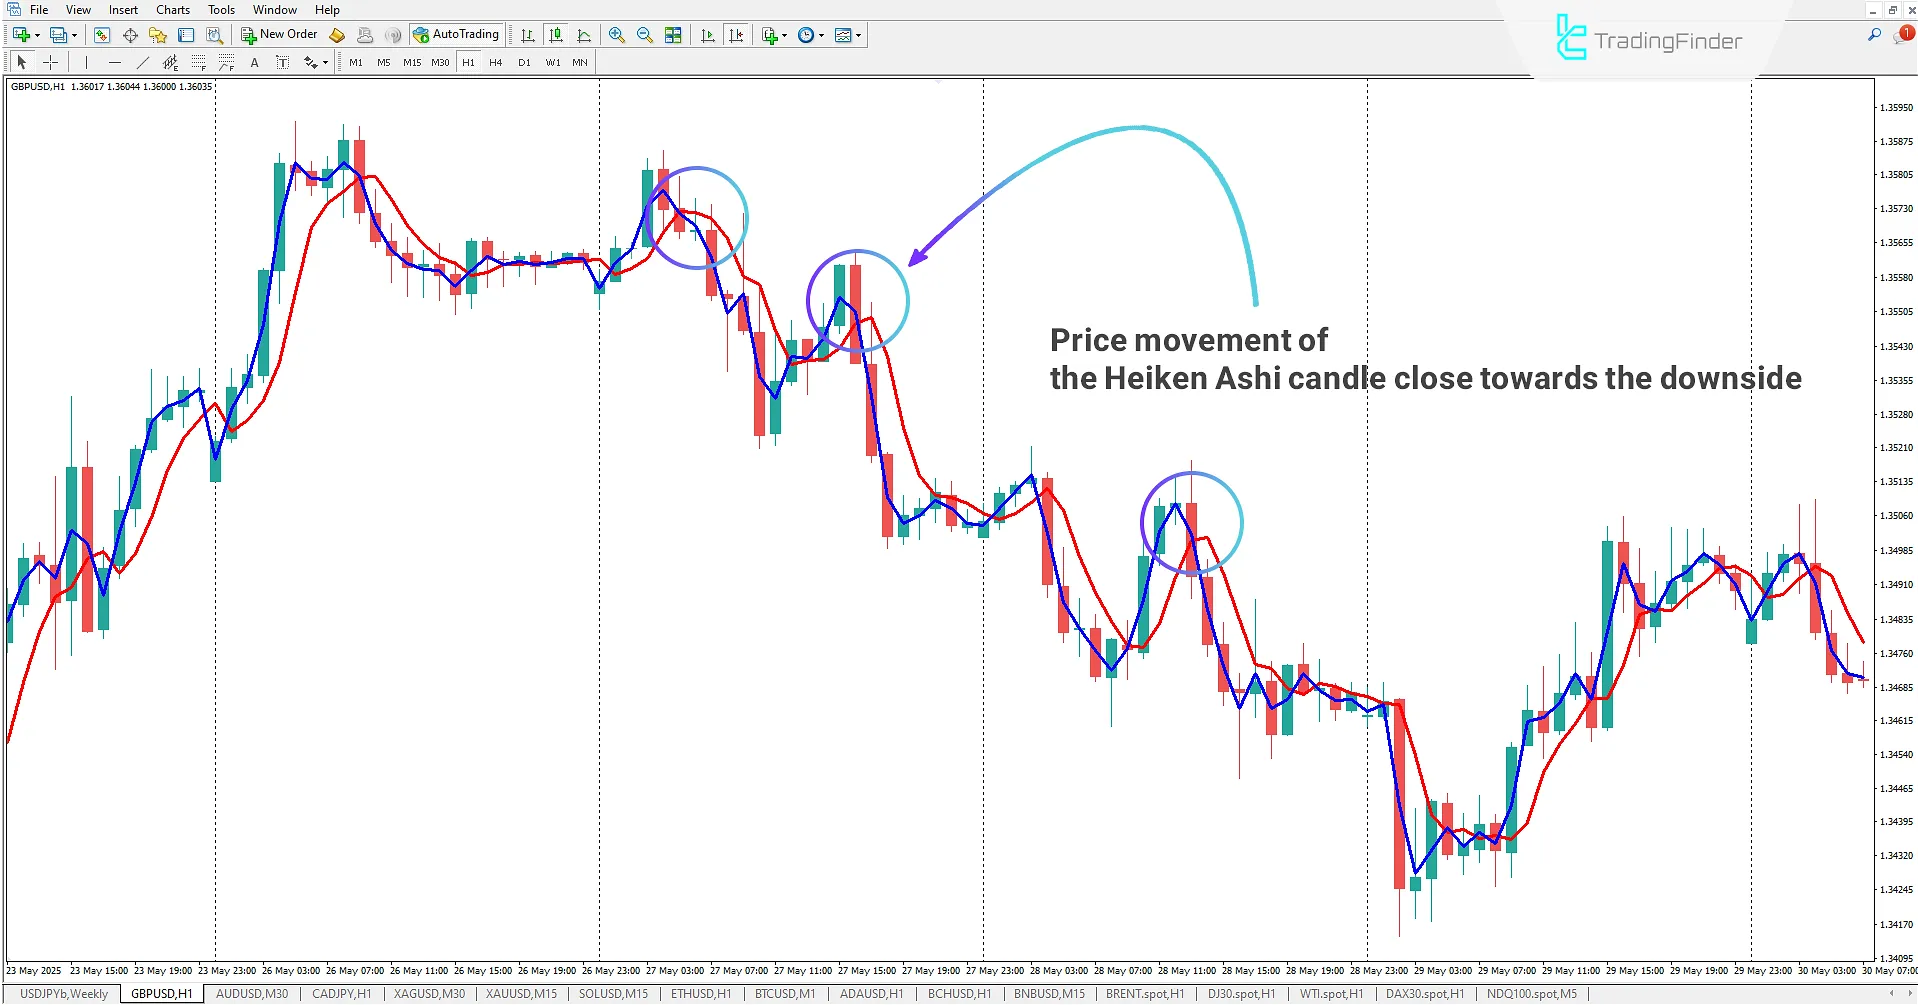
Bearish Trend
On the 1-hour GBP/USD chart, the downward movement of the Heiken Ashi close line indicates a sell opportunity.
Using this indicator, traders can identify the market trend and, upon the downward crossover of the blue line, enter short positions.
This approach helps traders accurately identify entry points and maintain better control over their trades.
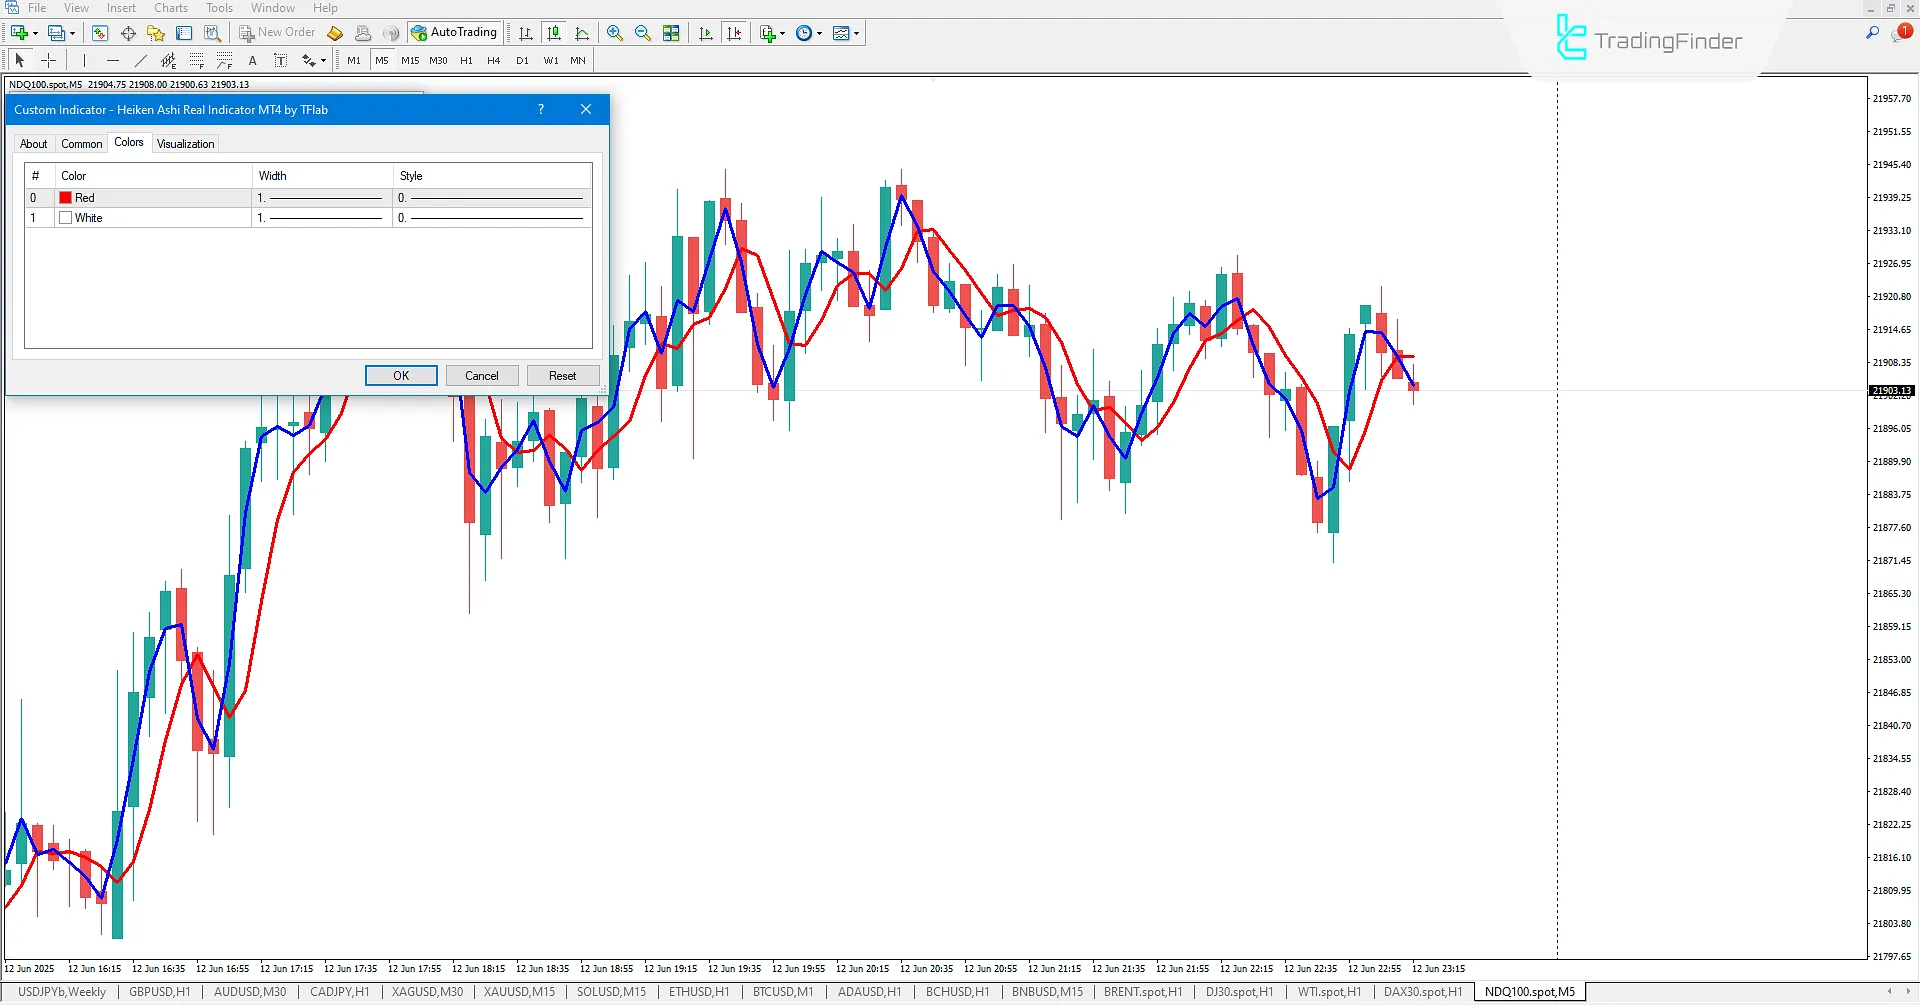
Indicator Settings
Below are the settings available for the Heiken Ashi Real Indicator:
In this indicator, only the option to customize line colors is available.
- First Line Color Setting: Set the color of the Heiken Ashi candle open line
- Second Line Color Setting: Set the color of the Heiken Ashi candle close line
Conclusion
The Heiken Ashi Real Indicator is a powerful tool for traders looking to identify market trends and determine optimal entry and exit points.
By displaying two trend lines, it offers a simple yet effective trading strategy based on the crossover of these lines. This allows traders to make decisions with better risk management.
Heiken Ashi Real MT4 PDF
Heiken Ashi Real MT4 PDF
Click to download Heiken Ashi Real MT4 PDFWhat is the Heiken Ashi Real Indicator?
It is an advanced and updated version of the classic Heiken Ashi indicator, designed for MetaTrader 4, helping traders identify market trends.
How does the Heiken Ashi Real Indicator show market trends?
It uses two main lines: the red line representing the open of the Heiken Ashi candle and the blue line representing the close, with their movement indicating the market’s trend direction.


