![Higher Highs and Lower Lows Stochastic Indicator MT4 Download - [TFlab]](https://cdn.tradingfinder.com/image/233279/13-67-en-higher-highs-lower-lows-stochastic-mt4-01.webp)
![Higher Highs and Lower Lows Stochastic Indicator MT4 Download - [TFlab] 0](https://cdn.tradingfinder.com/image/233279/13-67-en-higher-highs-lower-lows-stochastic-mt4-01.webp)
![Higher Highs and Lower Lows Stochastic Indicator MT4 Download - [TFlab] 1](https://cdn.tradingfinder.com/image/233281/13-67-en-higher-highs-lower-lows-stochastic-mt4-02.webp)
![Higher Highs and Lower Lows Stochastic Indicator MT4 Download - [TFlab] 2](https://cdn.tradingfinder.com/image/233280/13-67-en-higher-highs-lower-lows-stochastic-mt4-03.webp)
![Higher Highs and Lower Lows Stochastic Indicator MT4 Download - [TFlab] 3](https://cdn.tradingfinder.com/image/254468/13-67-en-higher-highs-lower-lows-stochastic-mt4-04.webp)
The HH and LL Stochastic Indicator for uses two colored lines to display changes in price movements and trend reversal zones. This oscillator identifies entry opportunities in the Forex market and other markets by highlighting overbought and oversold zones.
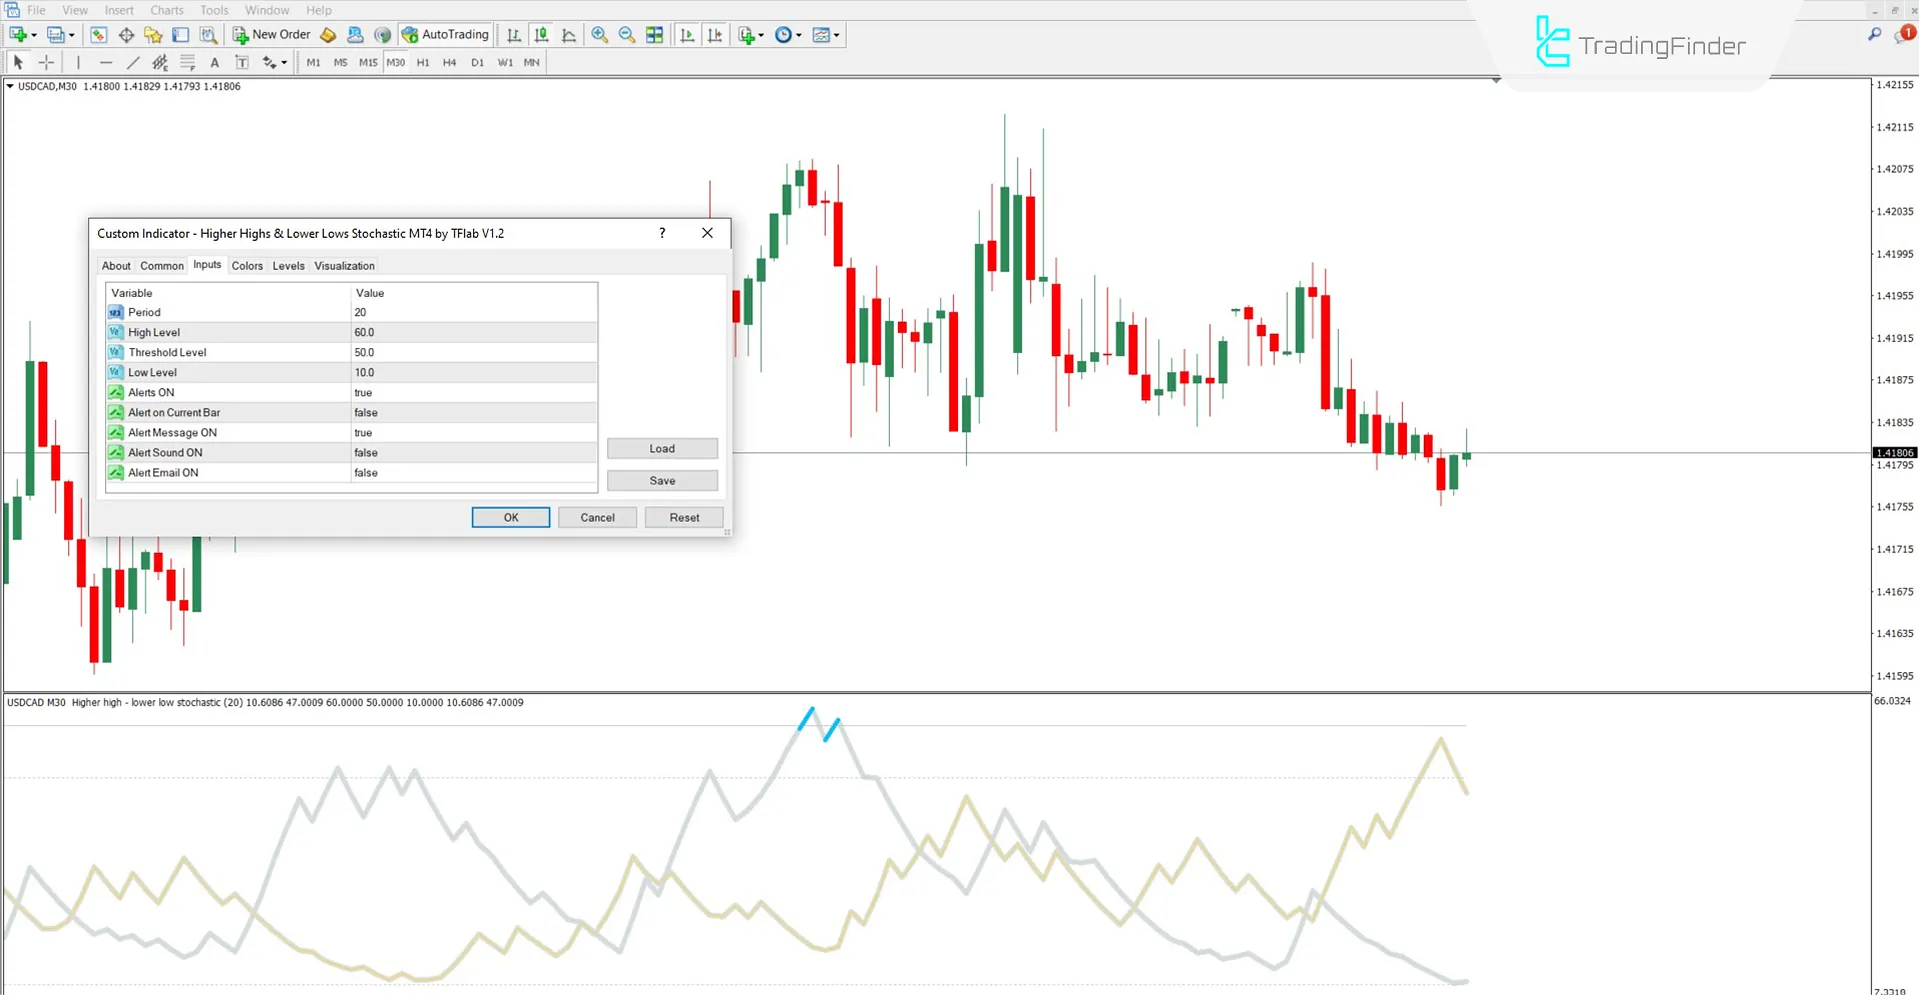
The settings panel of this high MT4 volatility indicator on the MetaTrader 4 platform allows users to modify the oscillator's calculation period and overbought/oversold zones.
Specifications of the HH & LL Stochastic Indicator
The table below explains the features and specifications of this indicator.
Indicator Categories: | Oscillators MT4 Indicators Volatility MT4 Indicators Trading Assist MT4 Indicators |
Platforms: | MetaTrader 4 Indicators |
Trading Skills: | Elementary |
Indicator Types: | Reversal MT4 Indicators |
Timeframe: | Multi-Timeframe MT4 Indicators |
Trading Style: | Intraday MT4 Indicators |
Trading Instruments: | Stock Market MT4 Indicators Cryptocurrency MT4 Indicators Forex MT4 Indicators |
Overview of the Indicator
This indicator generates entry and exit signals in several ways. The crossing of lines and their oscillation relative to each other indicate the prevailing trend strength. One key feature of this indicator is displaying overbought and oversold zones.
When the blue line is within the green zone, it indicates overbought conditions, suggesting selling opportunities. The opposite strategy applies when the brown line is in the corresponding zone.
Buy Signal
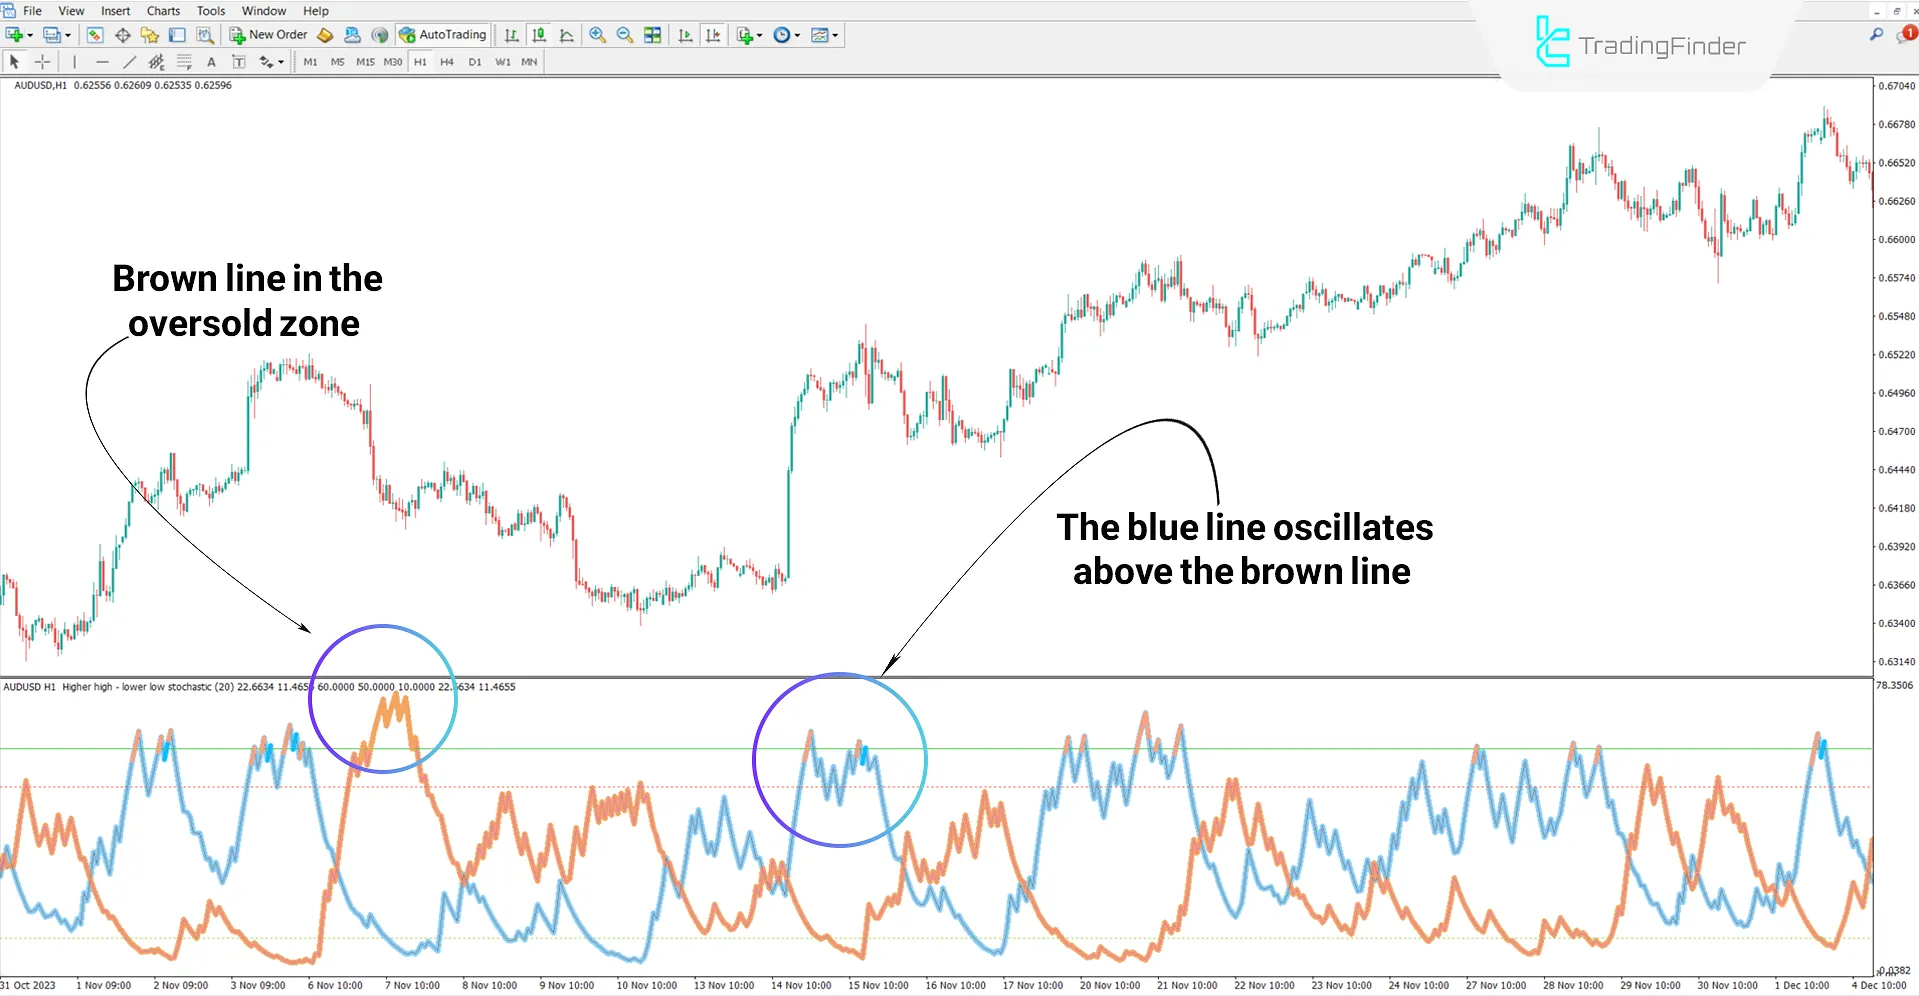
Analyzing the AUD/USD currency pair chart, the brown line reaches the oversold zone, followed by a bullish trend.
Crossing the blue line with the brown line can be considered a buy signal, and the blue line oscillating above the brown line confirms the upward trend.

Sell Signal
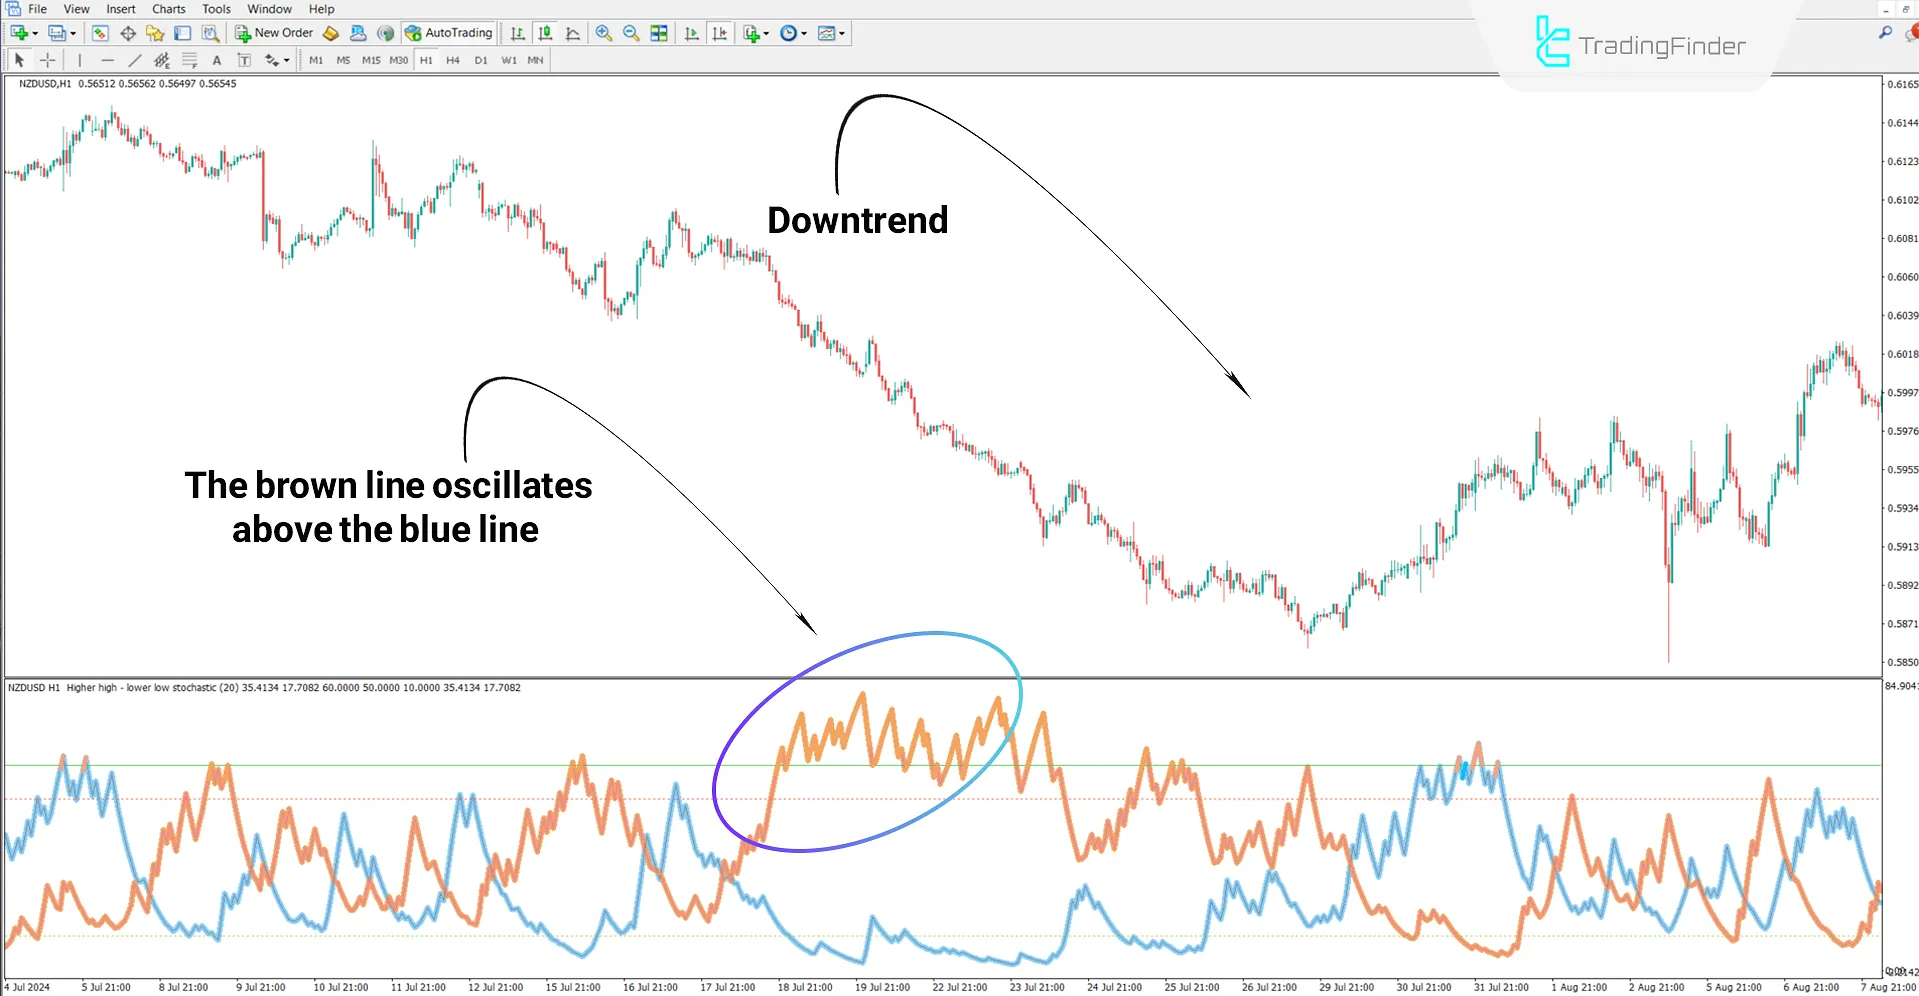
The NZD/USD currency pair chart in a 1-hour timeframe shows how the sell signal is generated by the HH & LL Stochastic Indicator.
The brown line gains strength and oscillates above the blue line. The intersection of these two lines can be regarded as an entry signal for trade.

HH & LL Stochastic Indicator Settings
The technical specifications and customizable options for the HH & LL Stochastic Indicator are as follows:

- Period: Indicator time period
- High Level: Adjust the indicator's high level
- Threshold Level: Set the threshold level
- Low Level: Adjust the indicator's low level
- Alerts ON: Enable alerts
- Alert on Current Bar: Alerts for current bars
- Alert Message ON: Enable message alerts
- Alert Sound ON: Enable sound alerts
- Alert Email ON: Enable email alerts
Note: In the new version of this indicator, the oscillator line colors have been changed from brown and blue to gold and gray, respectively.
Conclusion
The Stochastic Indicator for Higher Highs and Lower Lows is an MT4 trading tool that displays overbought and oversold zones.
It uses two oscillating lines and their relative positions to generate signals for entering or exiting trades.
Higher Highs Lower Lows MT4 PDF
Higher Highs Lower Lows MT4 PDF
Click to download Higher Highs Lower Lows MT4 PDFHow are buy and sell signals generated in this indicator?
Buy and sell signals are generated based on the intersection of the blue and brown lines and their oscillations in overbought and oversold zones.
How can the indicator settings be adjusted?
The calculation period and overbought/oversold zones can be modified through the indicator settings panel in MetaTrader 4.
Let me know if you need adjustments or additional refinements.


