![Hidden Gap Volume Indicator for MetaTrader 4 Download - [TradingFinder]](https://cdn.tradingfinder.com/image/397269/2-72-en-hidden-gap-volume-mt4-1.webp)
![Hidden Gap Volume Indicator for MetaTrader 4 Download - [TradingFinder] 0](https://cdn.tradingfinder.com/image/397269/2-72-en-hidden-gap-volume-mt4-1.webp)
![Hidden Gap Volume Indicator for MetaTrader 4 Download - [TradingFinder] 1](https://cdn.tradingfinder.com/image/397268/2-72-en-hidden-gap-volume-mt4-2.webp)
![Hidden Gap Volume Indicator for MetaTrader 4 Download - [TradingFinder] 2](https://cdn.tradingfinder.com/image/397265/2-72-en-hidden-gap-volume-mt4-3.webp)
![Hidden Gap Volume Indicator for MetaTrader 4 Download - [TradingFinder] 3](https://cdn.tradingfinder.com/image/397266/2-72-en-hidden-gap-volume-mt4-4.webp)
The Hidden Gap Volume Indicator in the MetaTrader 4 platform first calculates the average volume of the last 20 candles, then draws bands around the oscillator bars based on two standard deviations.
Next, each volume bar in the oscillator is classified based on a comparison with previous volumes and the deviation band, and is displayed in specific colors:
- Red: the bar with the lowest volume within the range
- Yellow: Volume is lower than the previous candle
- Purple: volume is lower than the two previous candles
- Blue: Volume is higher than the previous candle
- Brown: volume bars that exceed the deviation band
- Green: bars that exceed the band but have lower volume than the previous bar
Hidden Gap Volume Specifications Table
The following table presents the general specifications of the Hidden Gap Volume Indicator:
Indicator Categories: | Volume MT4 Indicators Oscillators MT4 Indicators Candle Sticks MT4 Indicators |
Platforms: | MetaTrader 4 Indicators |
Trading Skills: | Intermediate |
Indicator Types: | Trend MT4 Indicators Reversal MT4 Indicators |
Timeframe: | Multi-Timeframe MT4 Indicators |
Trading Style: | Intraday MT4 Indicators |
Trading Instruments: | Share Stocks MT4 Indicators Indices Market MT4 Indicators Commodity Market MT4 Indicators Stock Market MT4 Indicators Cryptocurrency MT4 Indicators Forex MT4 Indicators |
Indicator Overview
In the Hidden Gap Volume Indicator, yellow and purple bars indicate volume confirmation weakness (hidden gap) in the direction of the trend. Brown bars detect overbought or oversold zones.
This color coding helps the trader quickly identify weak trends and potential reversal zones, making it easier to define entry and exit levels for trades.
Uptrend Conditions
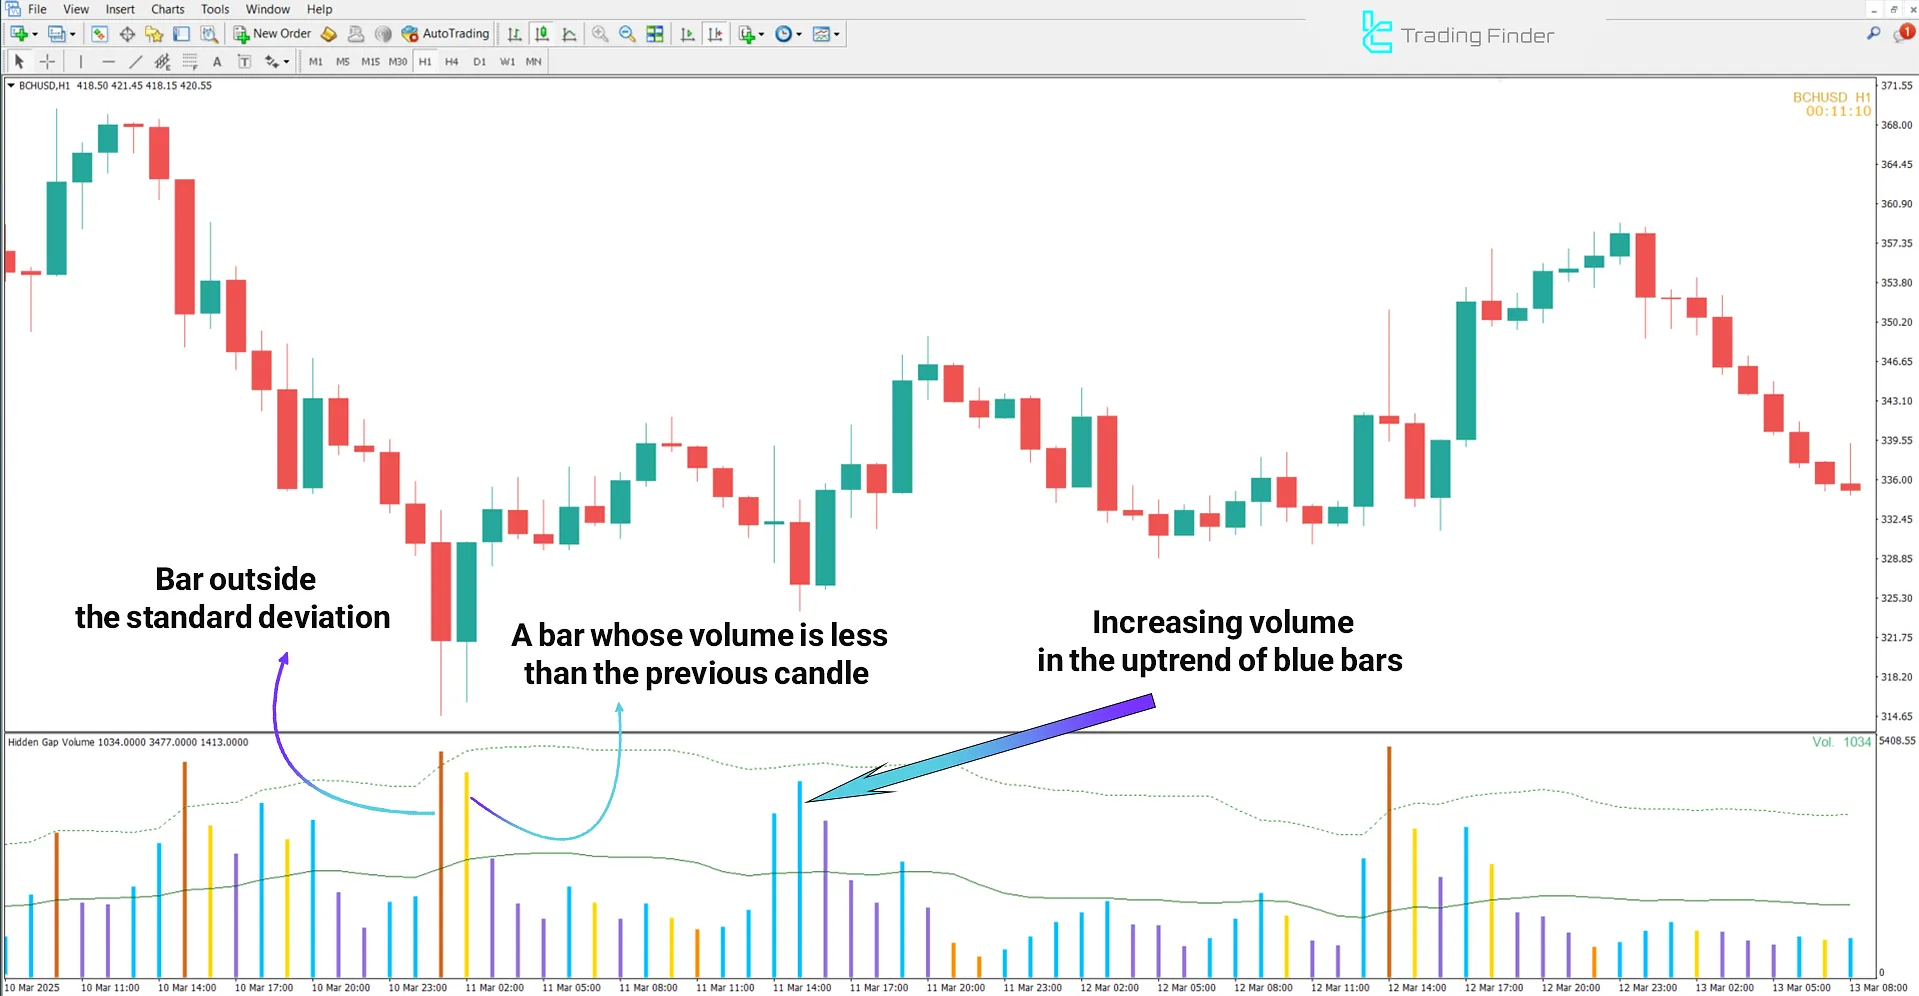
The chart below shows the Bitcoin Cash (BCH/USD) pair on the 1-hour timeframe. In uptrends, the appearance of blue bars indicates strong buying power.
However, if a new high price is formed and the volume bars turn yellow or purple, a hidden gap is present, meaning price increases without matching volume, suggesting overbought conditions.

Downtrend Conditions
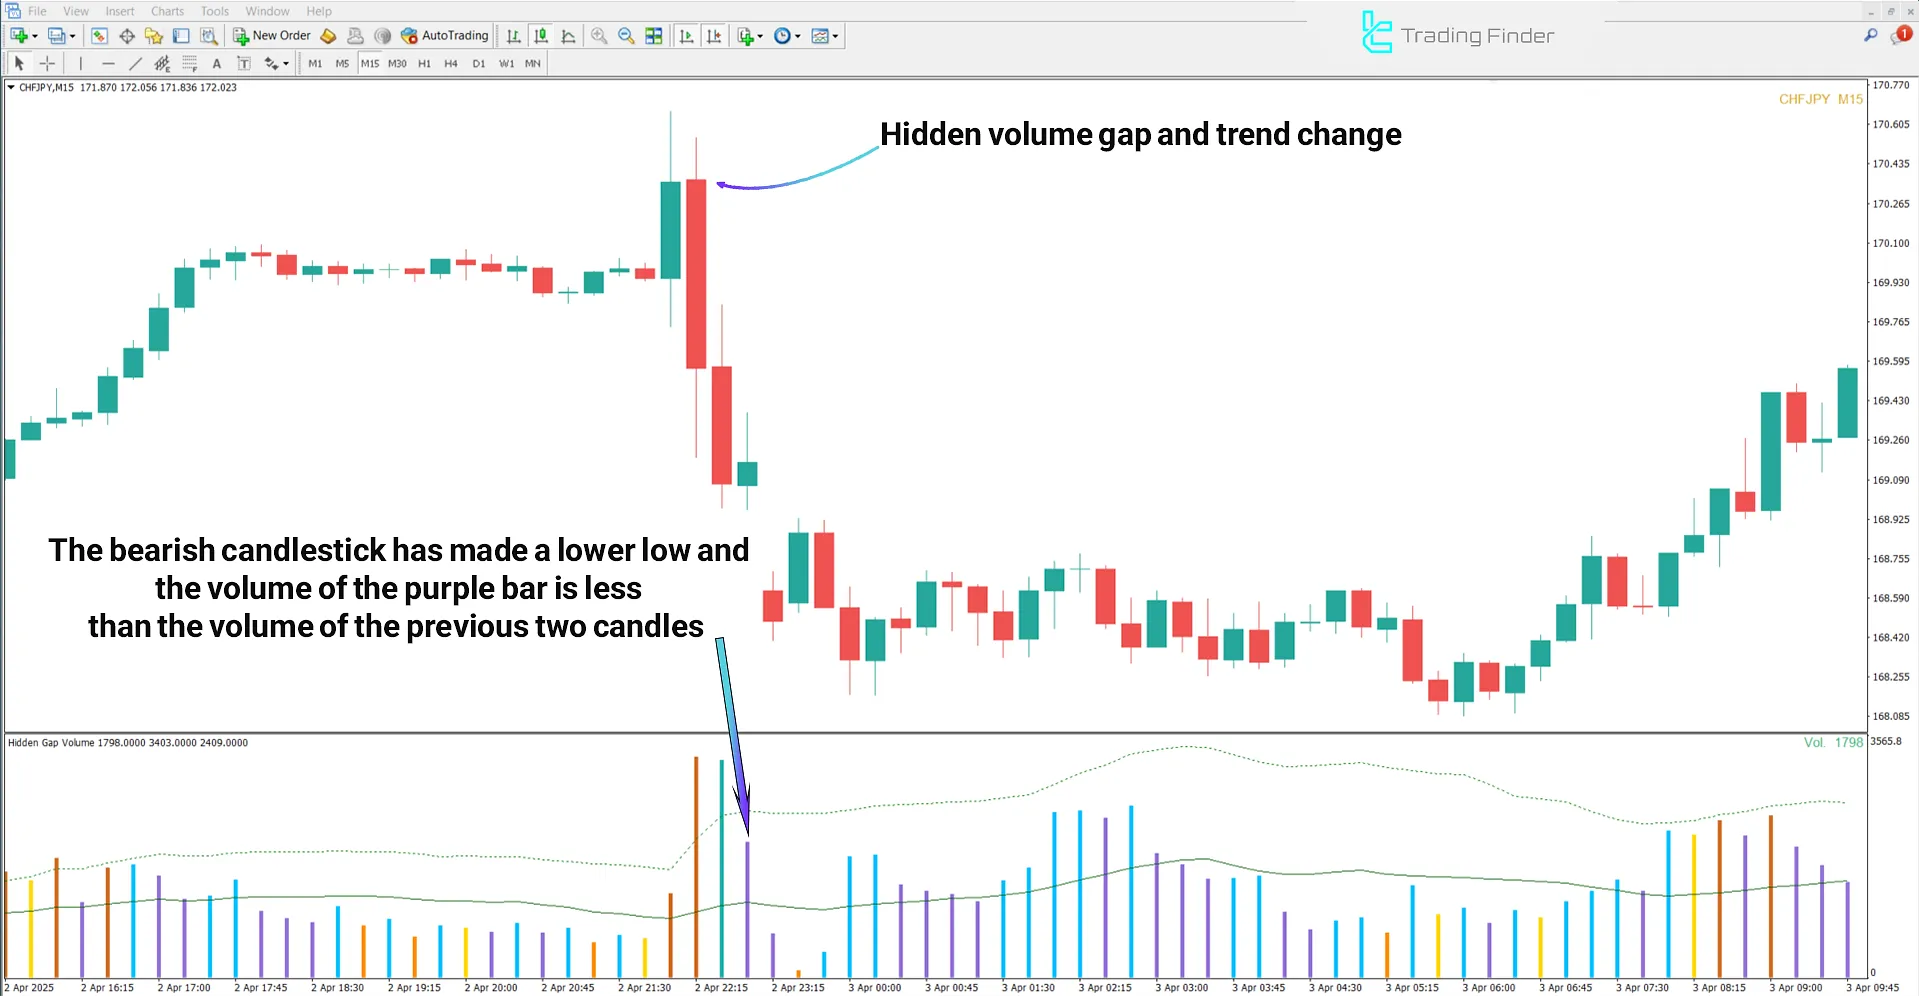
The chart below displays the CHF/JPY currency pair on the 15-minute timeframe. Blue bars signal intense selling pressure and potential for continued decline in a downtrend.
If the price makes a new low and the purple and yellow volume bars show lower values than one or two previous bars, a bullish hidden gap is formed, indicating a potential trend reversal upward.

Hidden Gap Volume Indicator Settings
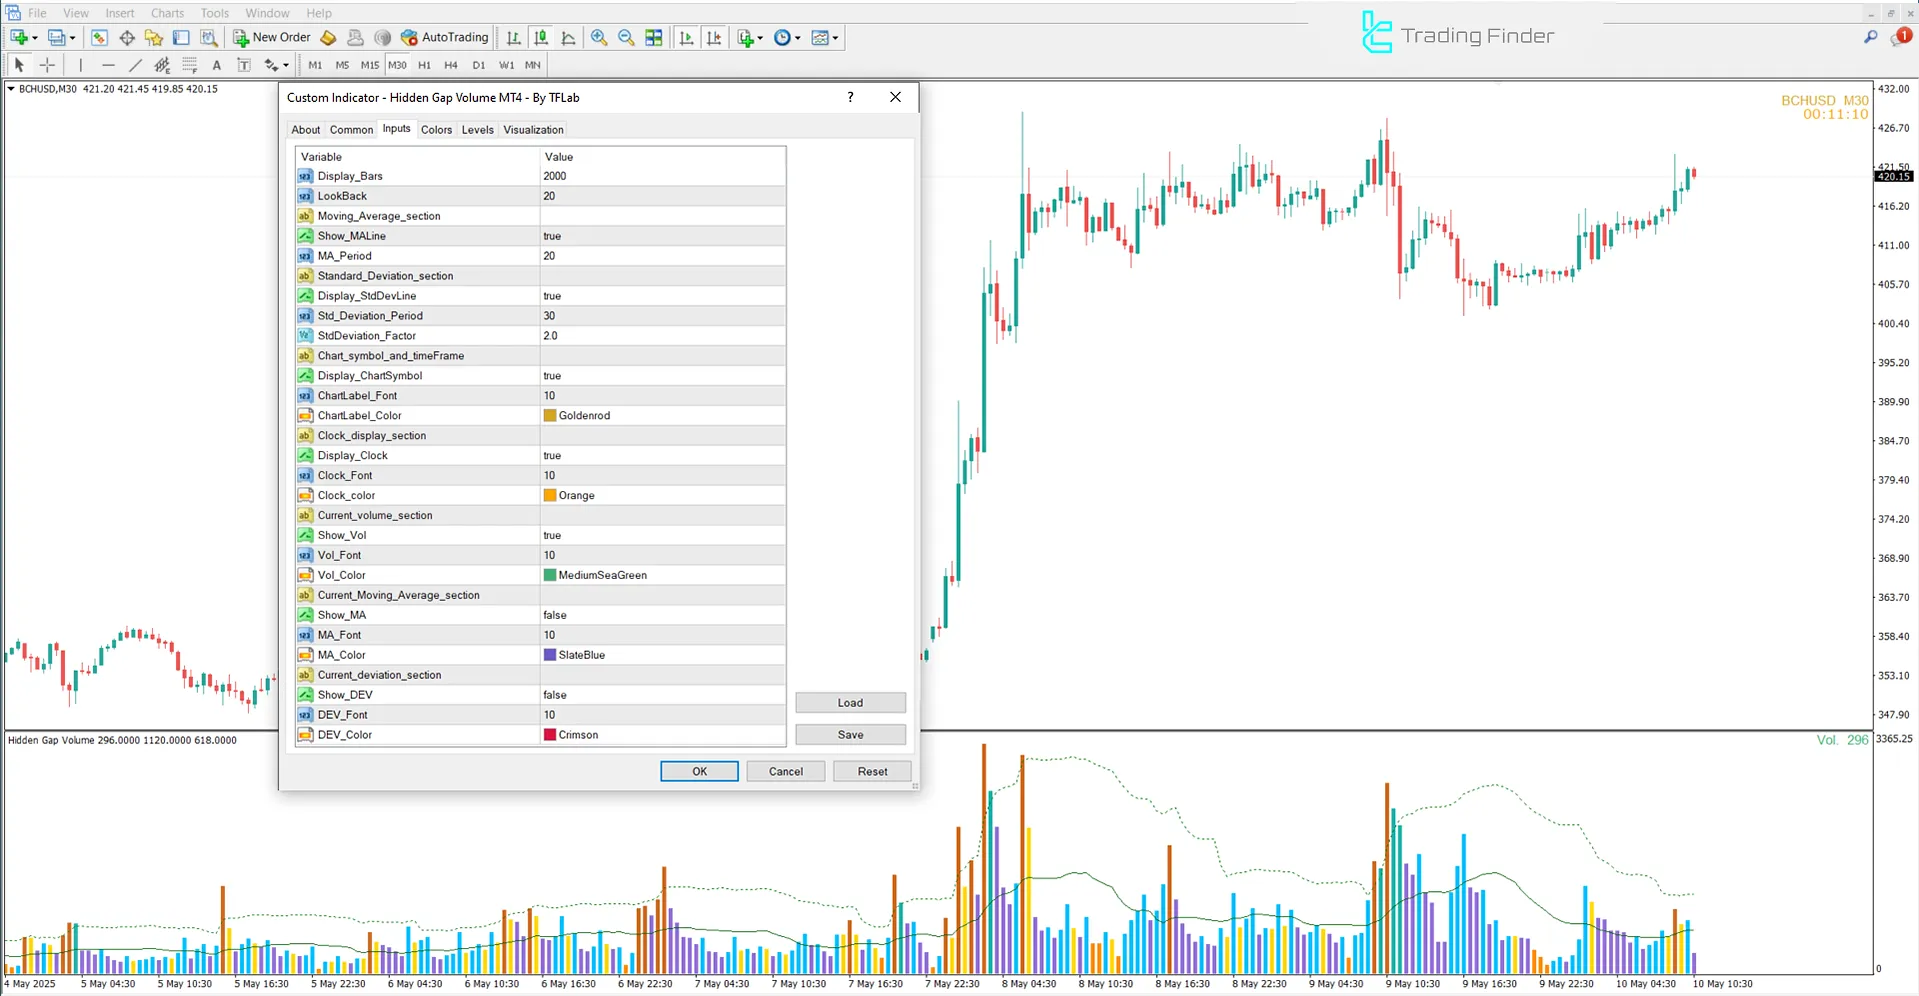
The indicator settings panel for Hidden Gap Volume is shown in the image below:

- Display Bars: Number of candles to display on the chart
- Look Back: Look-back period used for calculations
- Show MALine: Enable Moving Average line display
- MA Period: Length of the Moving Average window (period)
- Display StdDevLine: Show standard deviation boundary line
- Std Deviation Period: Period used to calculate standard deviation
- StdDeviation Factor: Multiplier for the standard deviation threshold
- Display ChartSymbol: Show chart symbol and timeframe label
- ChartLabel Font: Font size for the symbol/timeframe label
- ChartLabel Color: Label color
- Display Clock: Enable on-screen clock
- Clock Font: Font size for the digital clock
- Clock color: Clock font color
- Show Vol: Display real-time volume
- Vol Font: Font size for volume text
- Vol Color: olume display color
- Show MA: Show current MA value
- MA Font: Font size for current MA display
- MA Color: Display color for MA value
- Show DEV: Display current deviation value
- DEV Font: Font size for deviation label
- DEV Color: Color for deviation value
Conclusion
The Hidden Gap Volume trading tool, by identifying volume confirmation weaknesses (yellow bars) at peaks and bottoms and spotting volume saturation zones (brown bars), provides precise entry and exit zones for trades.
Hidden Gap Volume MT4 PDF
Hidden Gap Volume MT4 PDF
Click to download Hidden Gap Volume MT4 PDFWhy are yellow and purple bars important in the Hidden Gap Volume Indicator?
Their importance lies in their ability to reveal volume confirmation weakness in the direction of the trend.
What determines the color of the histogram bars in the Hidden Gap Volume Indicator?
The color of each histogram bar is defined by the position of the current volume relative to the 20-period moving average, the volumes of the previous two bars, and the standard deviation band.


