![Hidden SMT Divergence Indicator for MT4 Download – Free – [TFlab]](https://cdn.tradingfinder.com/image/267119/13-85-en-hidden-smt-divergence-mt4-01.webp)
![Hidden SMT Divergence Indicator for MT4 Download – Free – [TFlab] 0](https://cdn.tradingfinder.com/image/267119/13-85-en-hidden-smt-divergence-mt4-01.webp)
![Hidden SMT Divergence Indicator for MT4 Download – Free – [TFlab] 1](https://cdn.tradingfinder.com/image/267117/13-85-en-hidden-smt-divergence-mt4-02.webp)
![Hidden SMT Divergence Indicator for MT4 Download – Free – [TFlab] 2](https://cdn.tradingfinder.com/image/267120/13-85-en-hidden-smt-divergence-mt4-03.webp)
![Hidden SMT Divergence Indicator for MT4 Download – Free – [TFlab] 3](https://cdn.tradingfinder.com/image/267118/13-85-en-hidden-smt-divergence-mt4-04.webp)
The Hidden SMT Divergence Indicator can identify and display divergences between three trading instruments. This ICT indicator is designed based on the Smart Money trading strategy and helps traders identify potential price movements.
This trading tool uses lines to highlight divergences on the chart. This indicator gives traders a clear insight into Smart Money activity in the market.
Hidden Smart Money Divergence Indicator Specifications
The following table provides an overview of the Hidden Smart Money Divergence Indicator specifications.
Indicator Categories: | ICT MT4 Indicators Smart Money MT4 Indicators Liquidity MT4 Indicators |
Platforms: | MetaTrader 4 Indicators |
Trading Skills: | Advanced |
Indicator Types: | Reversal MT4 Indicators |
Timeframe: | Multi-Timeframe MT4 Indicators |
Trading Style: | Day Trading MT4 Indicators |
Trading Instruments: | Stock Market MT4 Indicators |
Understanding Hidden SMT Divergence
When an indicator's lines detect new highs or lows in a trading instrument, but the related asset fails to confirm the movement, hidden divergence occurs.This method is applicable in both bullish and bearish trends.
Bullish Trend
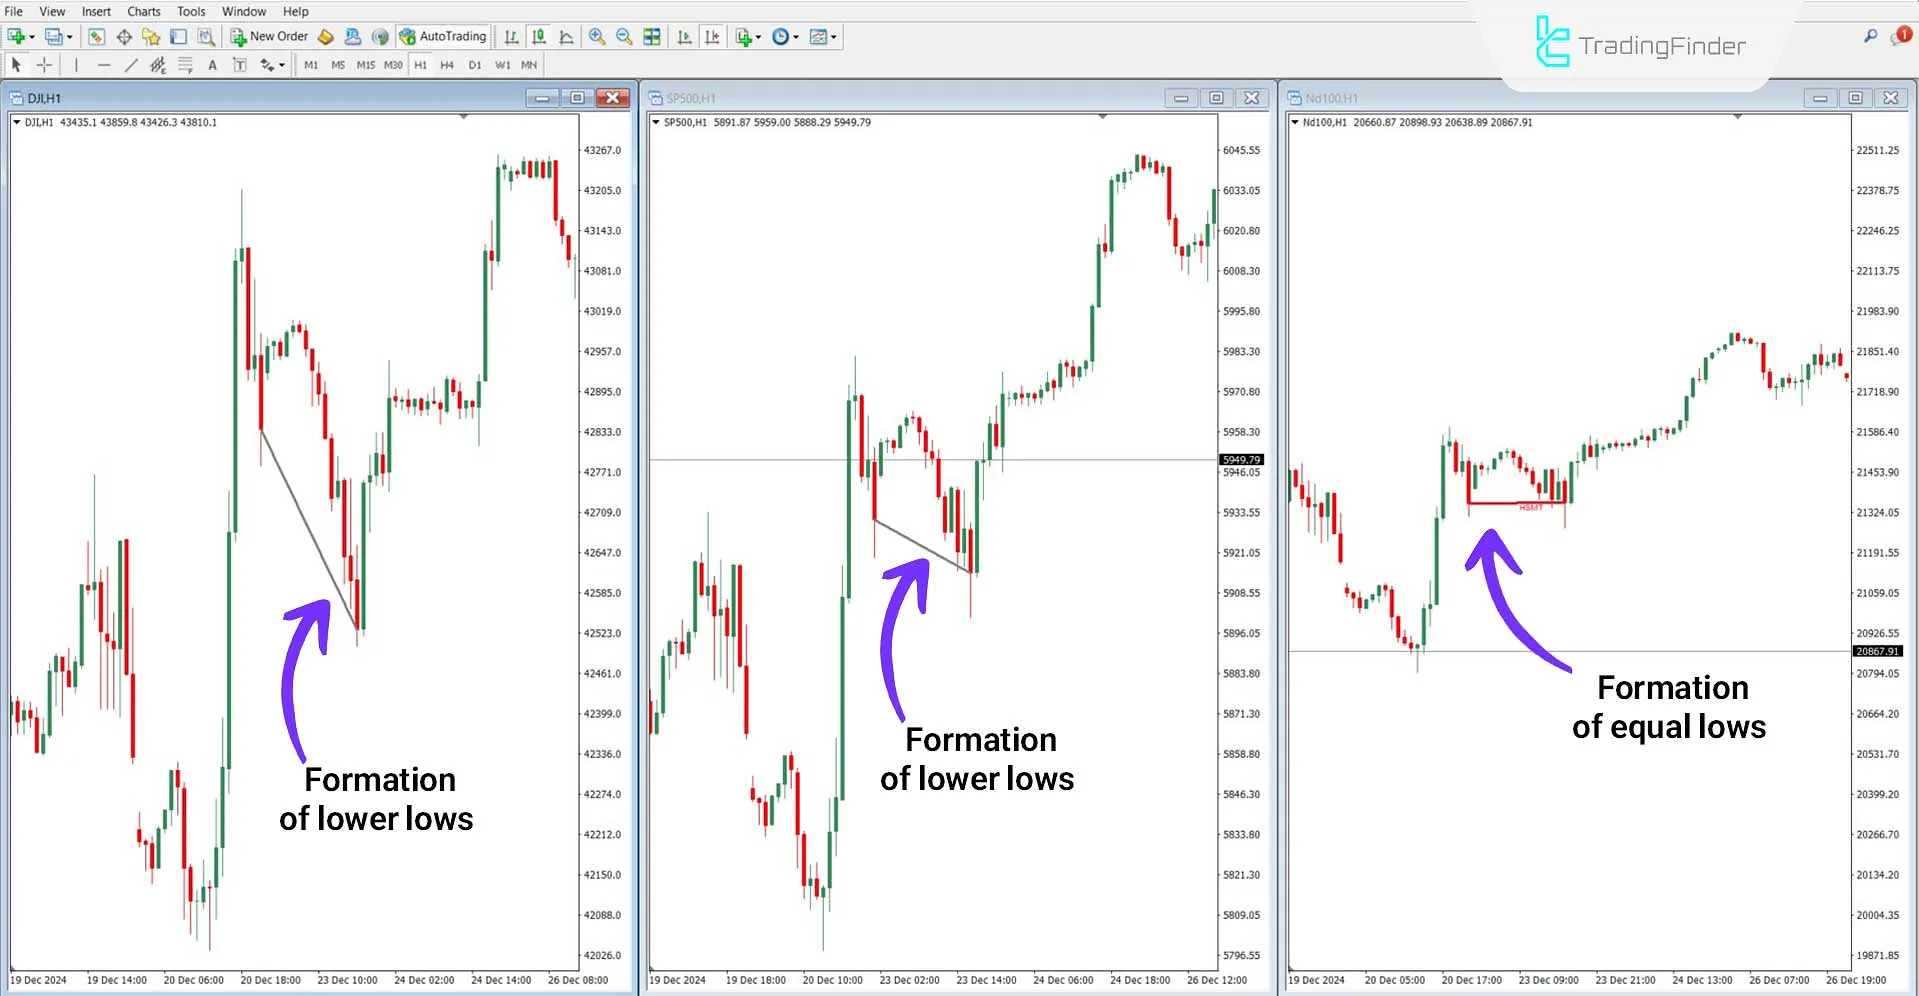
According to the 1-hour chart analysis of DJI, SP500, and ND100, the Hidden SMT Divergence Indicator has plotted the existing divergences between these three trading instruments.
As shown in the chart below, both DJI and SP500 successfully formed lower lows at a specific date, while ND100 displayed equal lows at the same time.

Bearish Trend
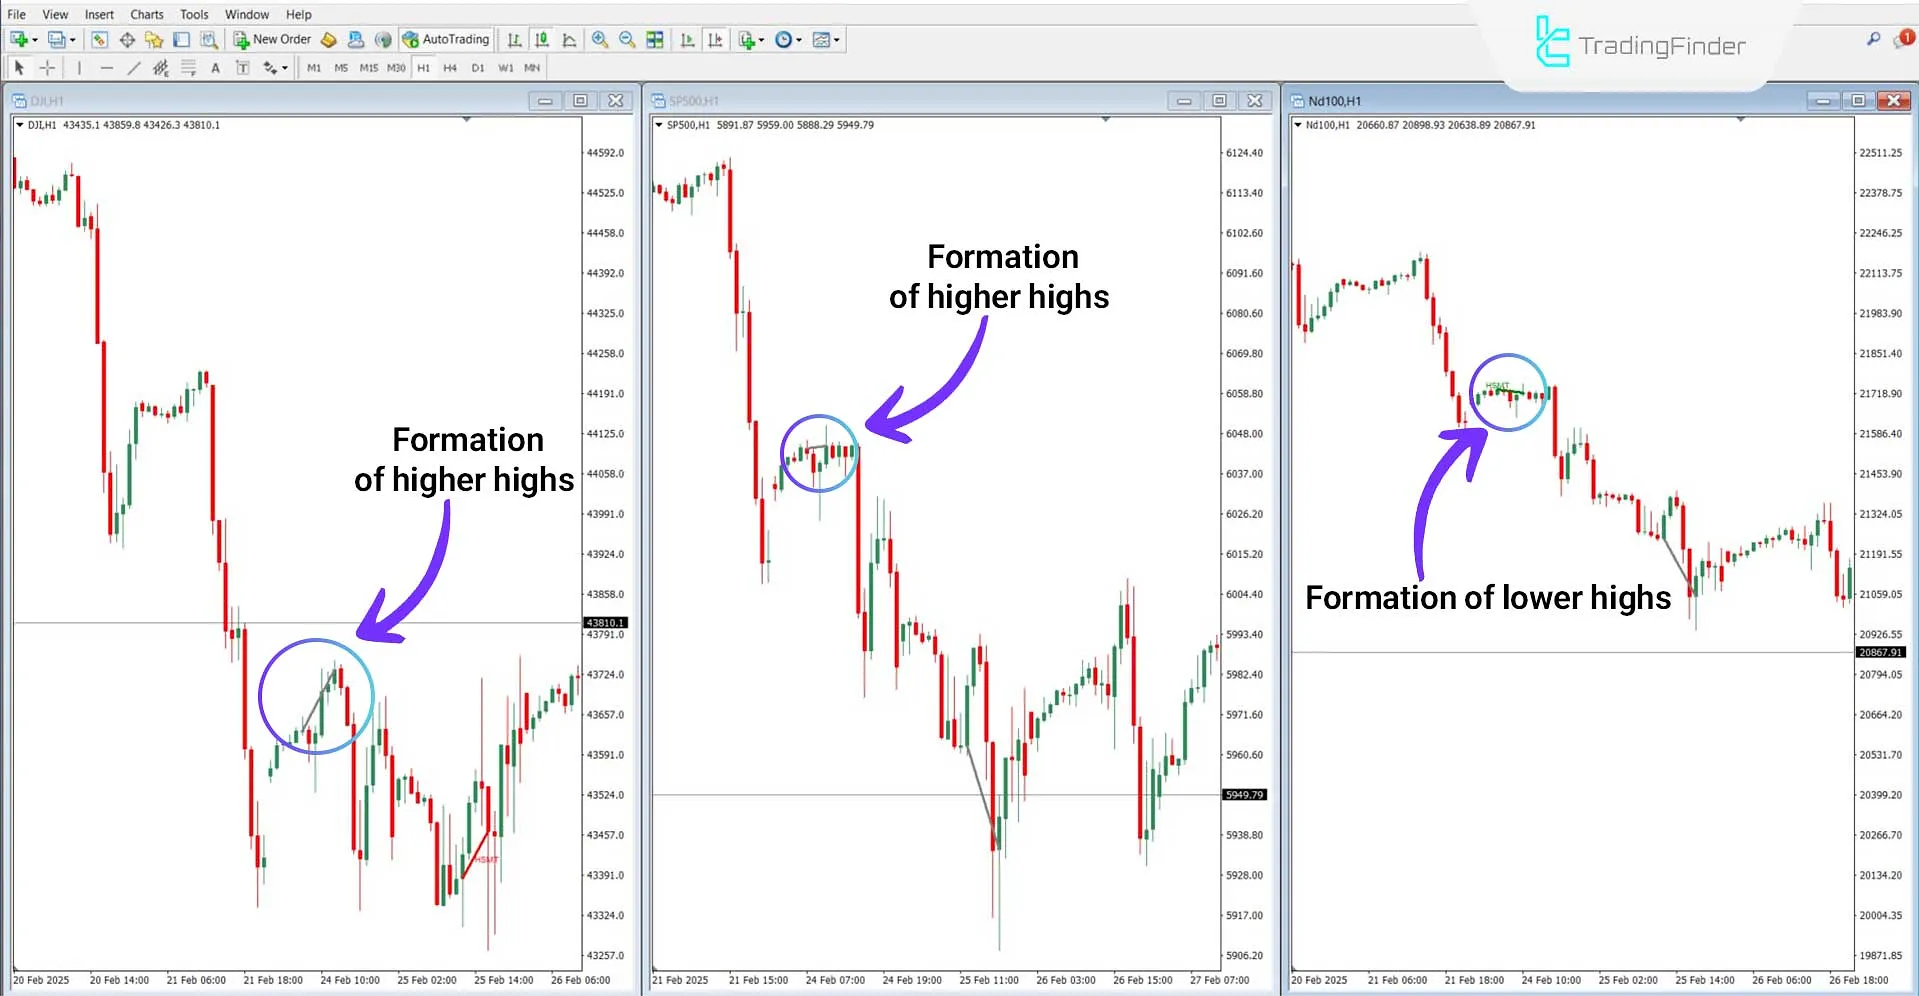
DJI, SP500, and ND100 analysis in one hour demonstrates the Hidden Smart Money Divergence Indicator's performance.
According to the chart, both DJI and SP500 formed two higher highs at the same level, indicating convergence between these two instruments. In contrast, ND100 created two lower highs, signaling weakness in the bullish trend.

Indicator Settings
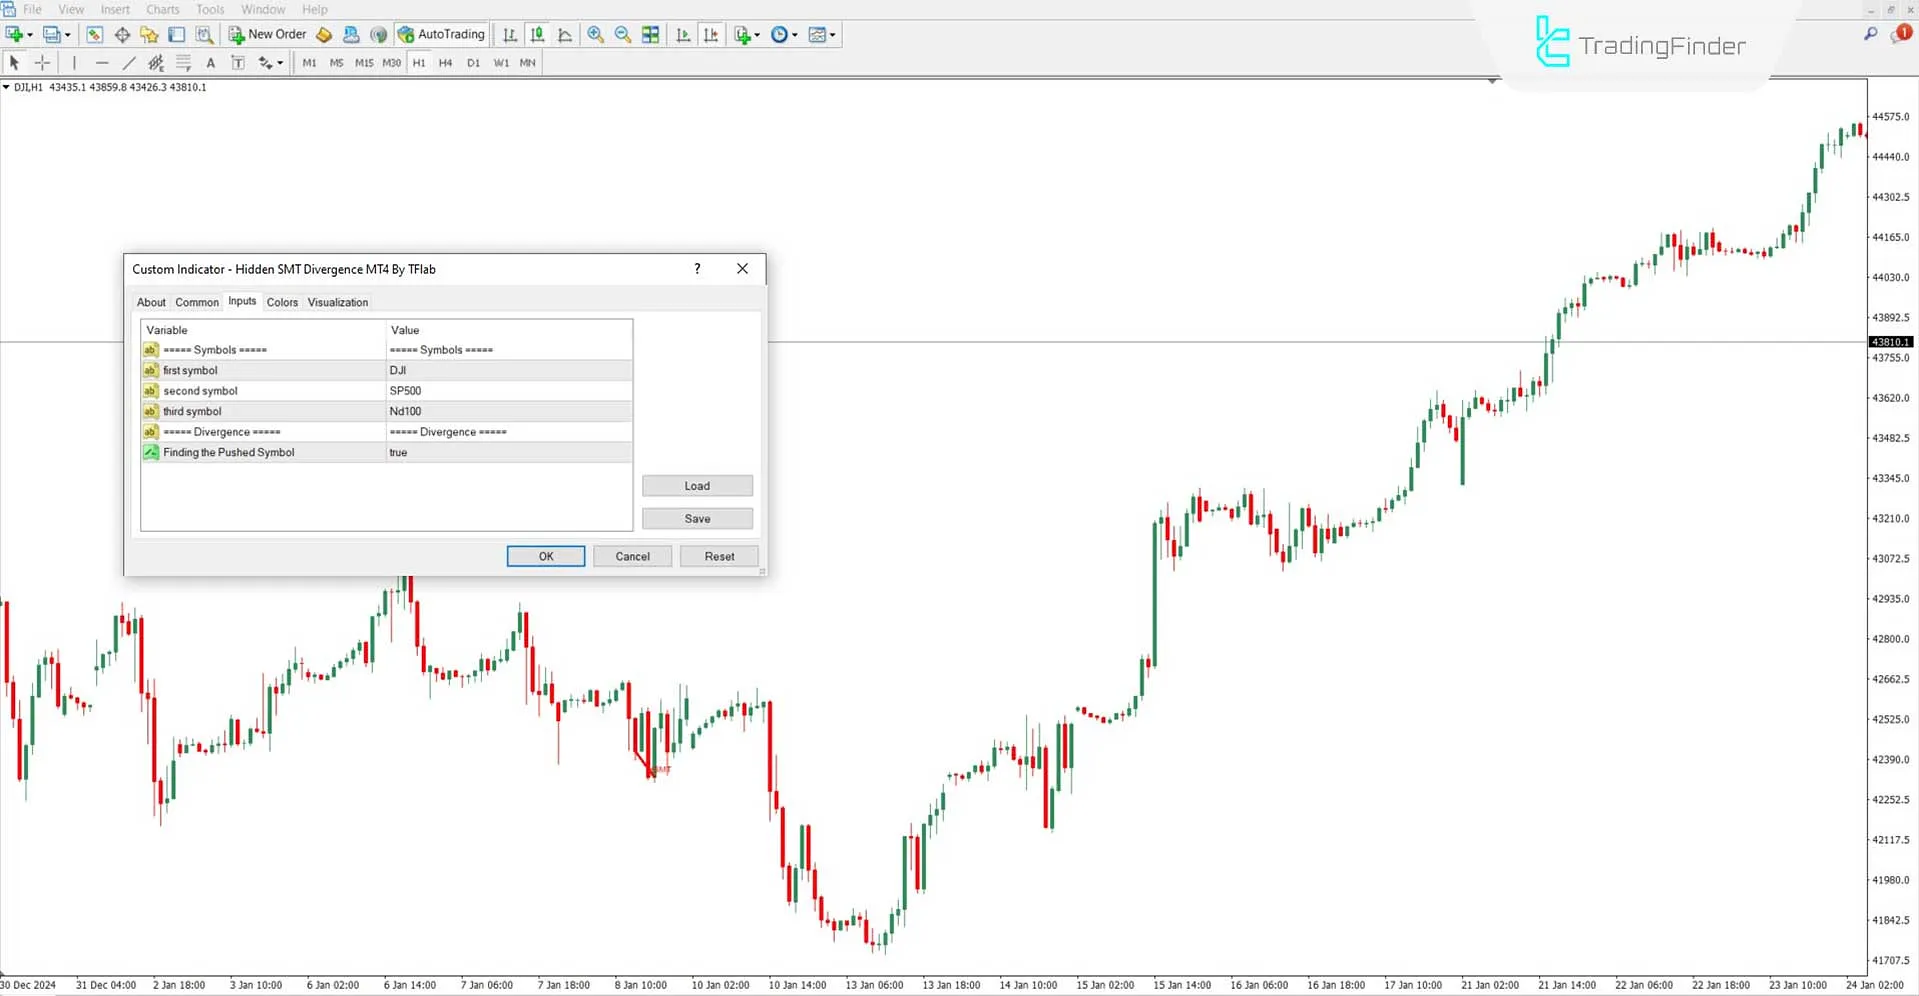
The following options are available in the Hidden Smart Money Divergence Indicator settings:

- First Symbol: Sets the first trading instrument
- Second Symbol: Sets the second trading instrument
- Third Symbol: Sets the third trading instrument
- Finding the Pushed Symbol: Enables automatic identification of the affected instrument
Conclusion
The Hidden SMT Divergence Indicator utilizes lines to identify and visualize divergences between trading instruments.
This trading tool analyzes highs and lows in three trading instruments, highlighting differences in their movements and facilitating trend direction forecasting.
It is important to note that to activate this trading tool, the indicator must first be applied to the chart of the first symbol.
Hidden SMT Divergence MT4 PDF
Hidden SMT Divergence MT4 PDF
Click to download Hidden SMT Divergence MT4 PDFCan this indicator be used in smaller timeframes?
This is a multi-timeframe indicator, meaning it can be applied to all timeframes.
What is the function of the lines drawn by this indicator?
The drawn lines highlight divergences and discrepancies between different trading instruments.


