![HMA Megatrend Indicator for MT4 Download – Free – [TradingFinder]](https://cdn.tradingfinder.com/image/430105/13-143-en-hma-megatrend-mt4-01.webp)
![HMA Megatrend Indicator for MT4 Download – Free – [TradingFinder] 0](https://cdn.tradingfinder.com/image/430105/13-143-en-hma-megatrend-mt4-01.webp)
![HMA Megatrend Indicator for MT4 Download – Free – [TradingFinder] 1](https://cdn.tradingfinder.com/image/430104/13-143-en-hma-megatrend-mt4-02.webp)
![HMA Megatrend Indicator for MT4 Download – Free – [TradingFinder] 2](https://cdn.tradingfinder.com/image/430103/13-143-en-hma-megatrend-mt4-03.webp)
![HMA Megatrend Indicator for MT4 Download – Free – [TradingFinder] 3](https://cdn.tradingfinder.com/image/430106/13-143-en-hma-megatrend-mt4-04.webp)
On July 6, 2025, in version 2, alert/notification and signal functionality was added to this indicator
The HMA Megatrend Indicator, based on the Hull Moving Average, is a powerful tool in technical analysis. Unlike traditional moving averages that often introduce lag, the Hull Moving Average uses a smoothing algorithm to filter out random price movements and reveal the actual trend direction with higher accuracy.
This oscillator visualizes price action using a dynamic, color changing line to distinguish between bullish and bearish phases.
HMA Megatrend Oscillator Specifications
The download specifications of the HMA Megatrend Indicator are as follows:
Indicator Categories: | Oscillators MT4 Indicators Signal & Forecast MT4 Indicators Trading Assist MT4 Indicators |
Platforms: | MetaTrader 4 Indicators |
Trading Skills: | Elementary |
Indicator Types: | Reversal MT4 Indicators |
Timeframe: | Multi-Timeframe MT4 Indicators |
Trading Style: | Day Trading MT4 Indicators Scalper MT4 Indicators Swing Trading MT4 Indicators |
Trading Instruments: | Share Stocks MT4 Indicators Indices Market MT4 Indicators Commodity Market MT4 Indicators Stock Market MT4 Indicators Cryptocurrency MT4 Indicators Forex MT4 Indicators |
HMA Megatrend at a Glance
The HMA Megatrend Oscillator not only shows changes in trend direction but also issues buy and sell signals.
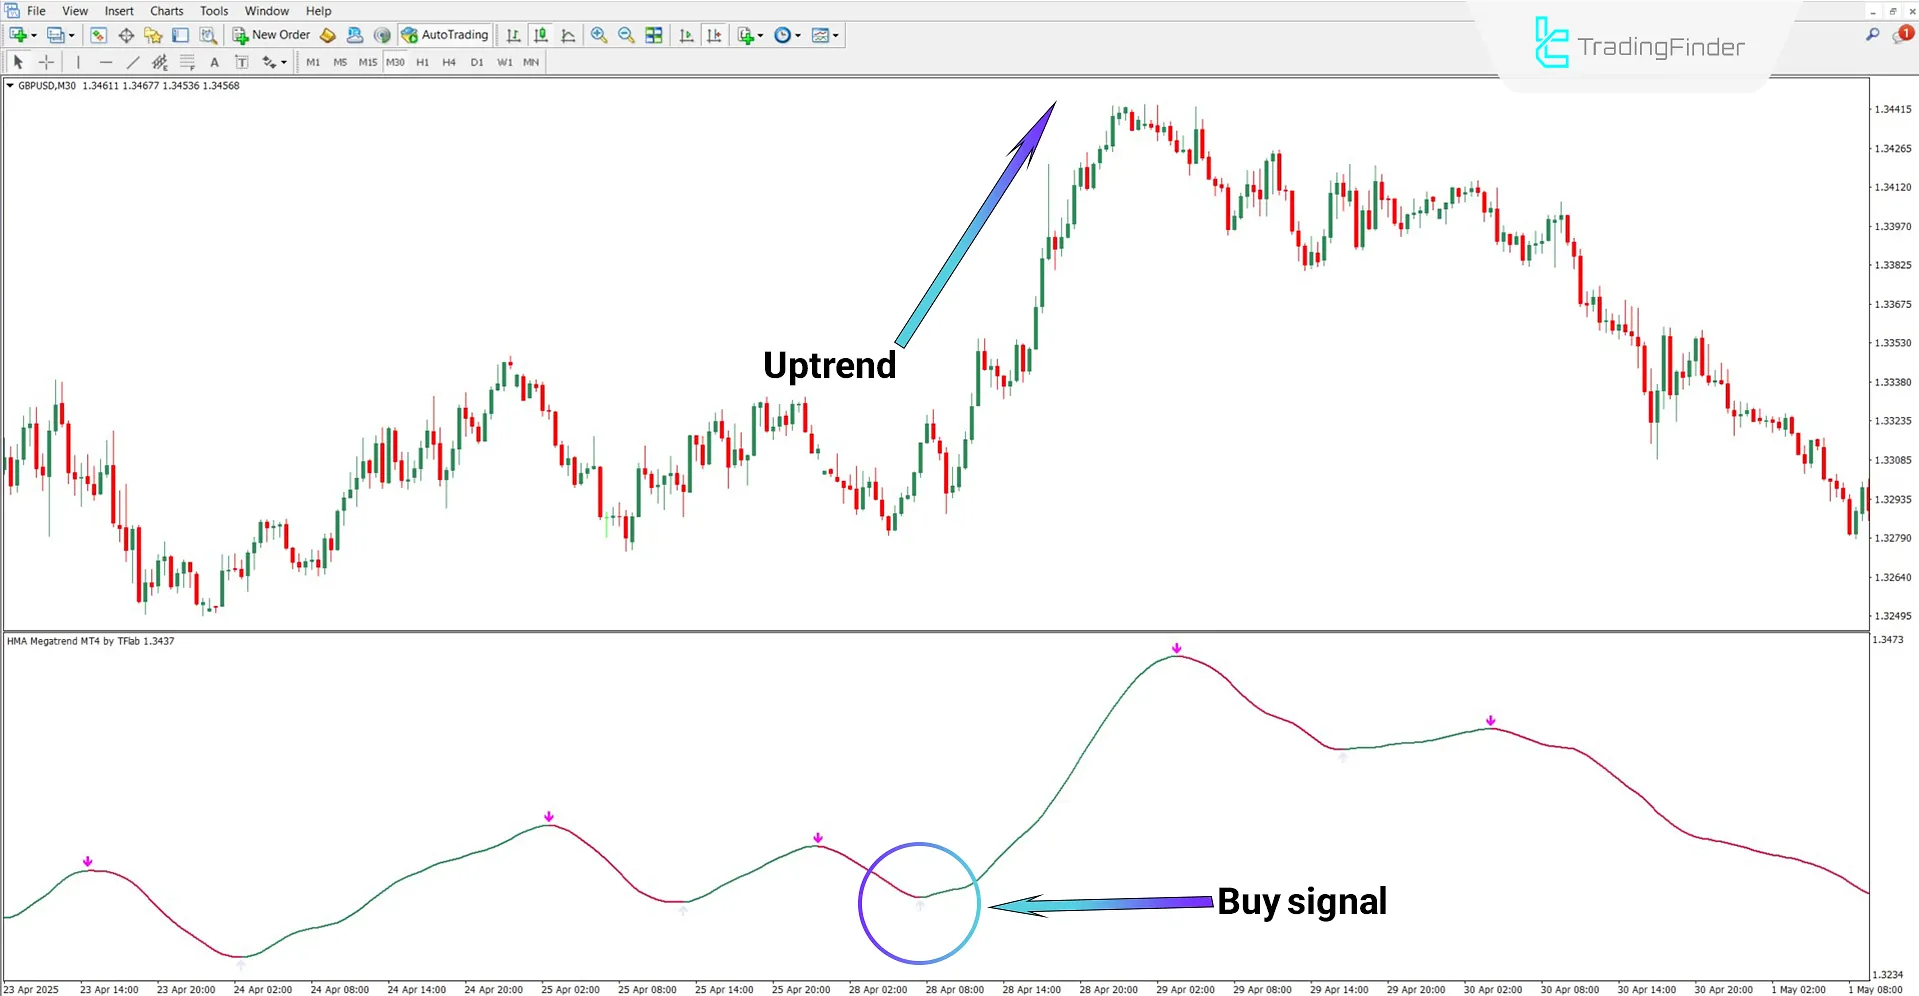
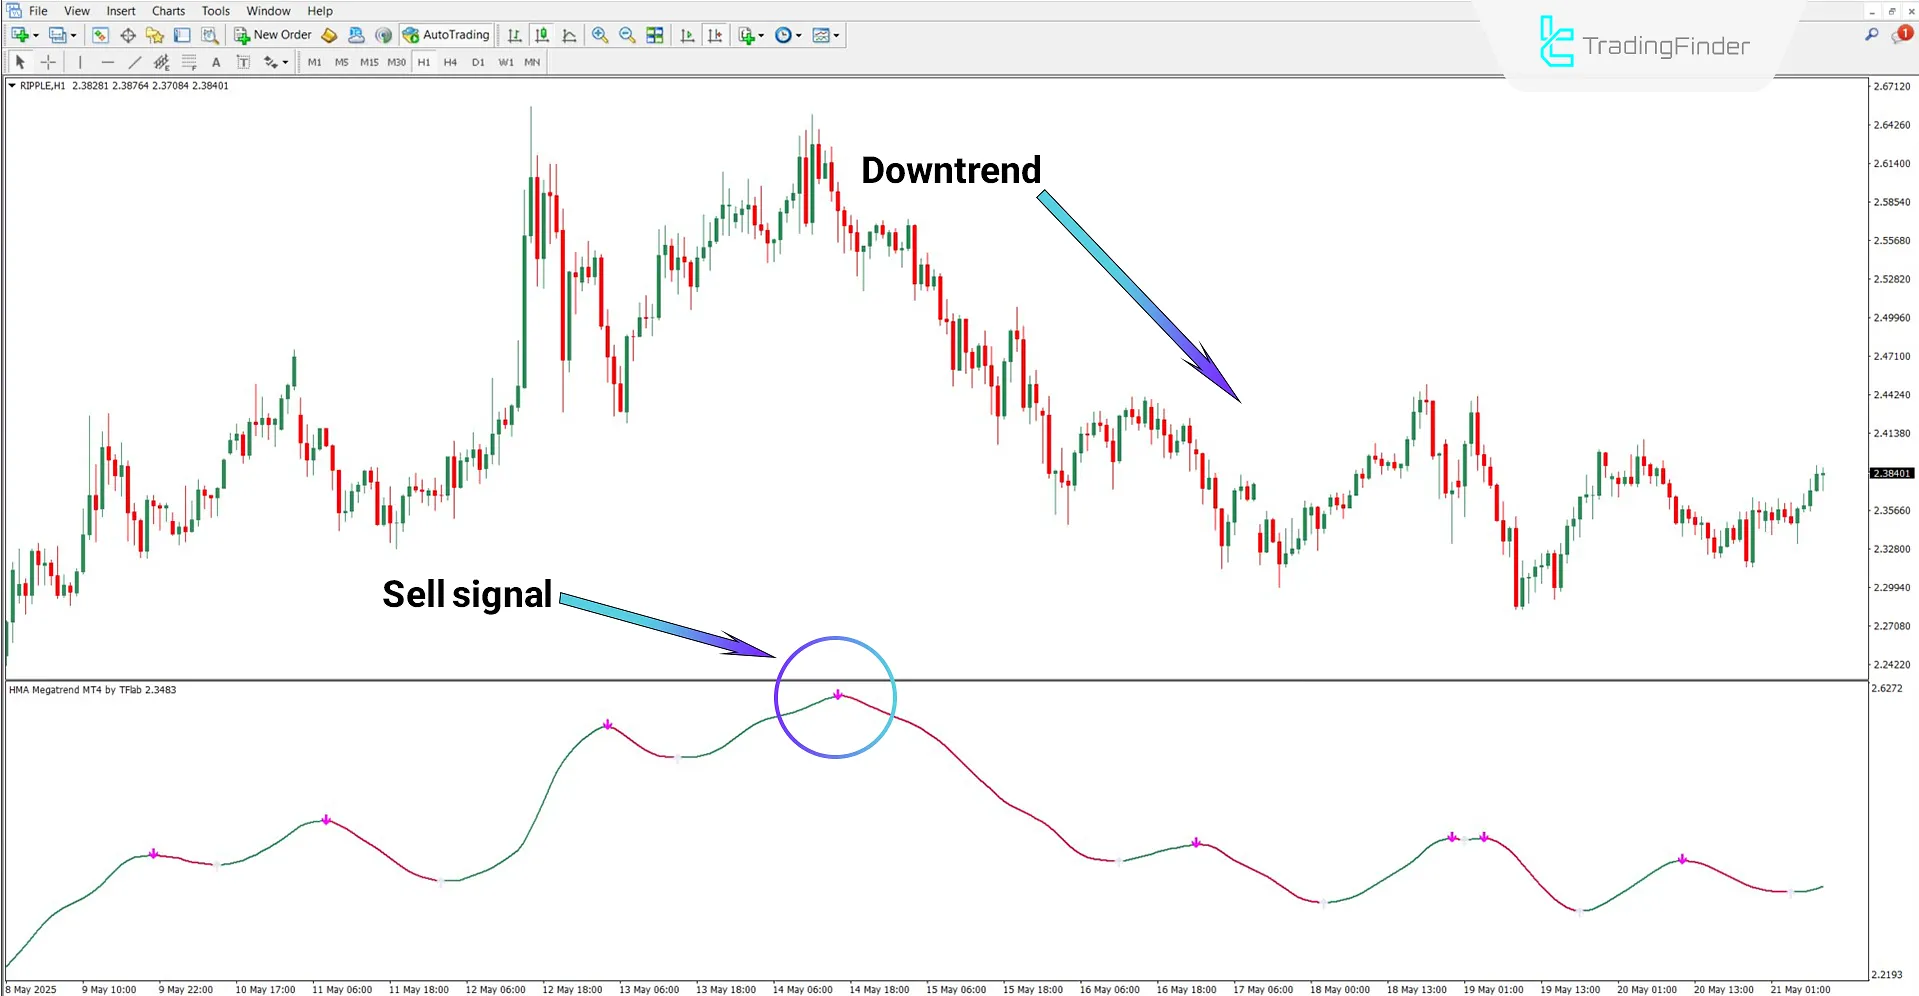
A gray arrow appears when the trend shifts from bearish to bullish, while a pink arrow appears when the trend reverses from bullish to bearish.
Buy Signal
On the GBP/USD 30-minute chart, a change in the oscillator line color from red to green signals a bullish trend reversal.
The point of the color change is marked with a gray arrow, indicating a buy entry opportunity.

Sell Signal
According to the 1-hour XRP chart, when the oscillator line changes from green to red, it signifies the start of a bearish trend.
This turning point is marked by a pink arrow, indicating a sell entry point.

HMA Megatrend Oscillator Settings
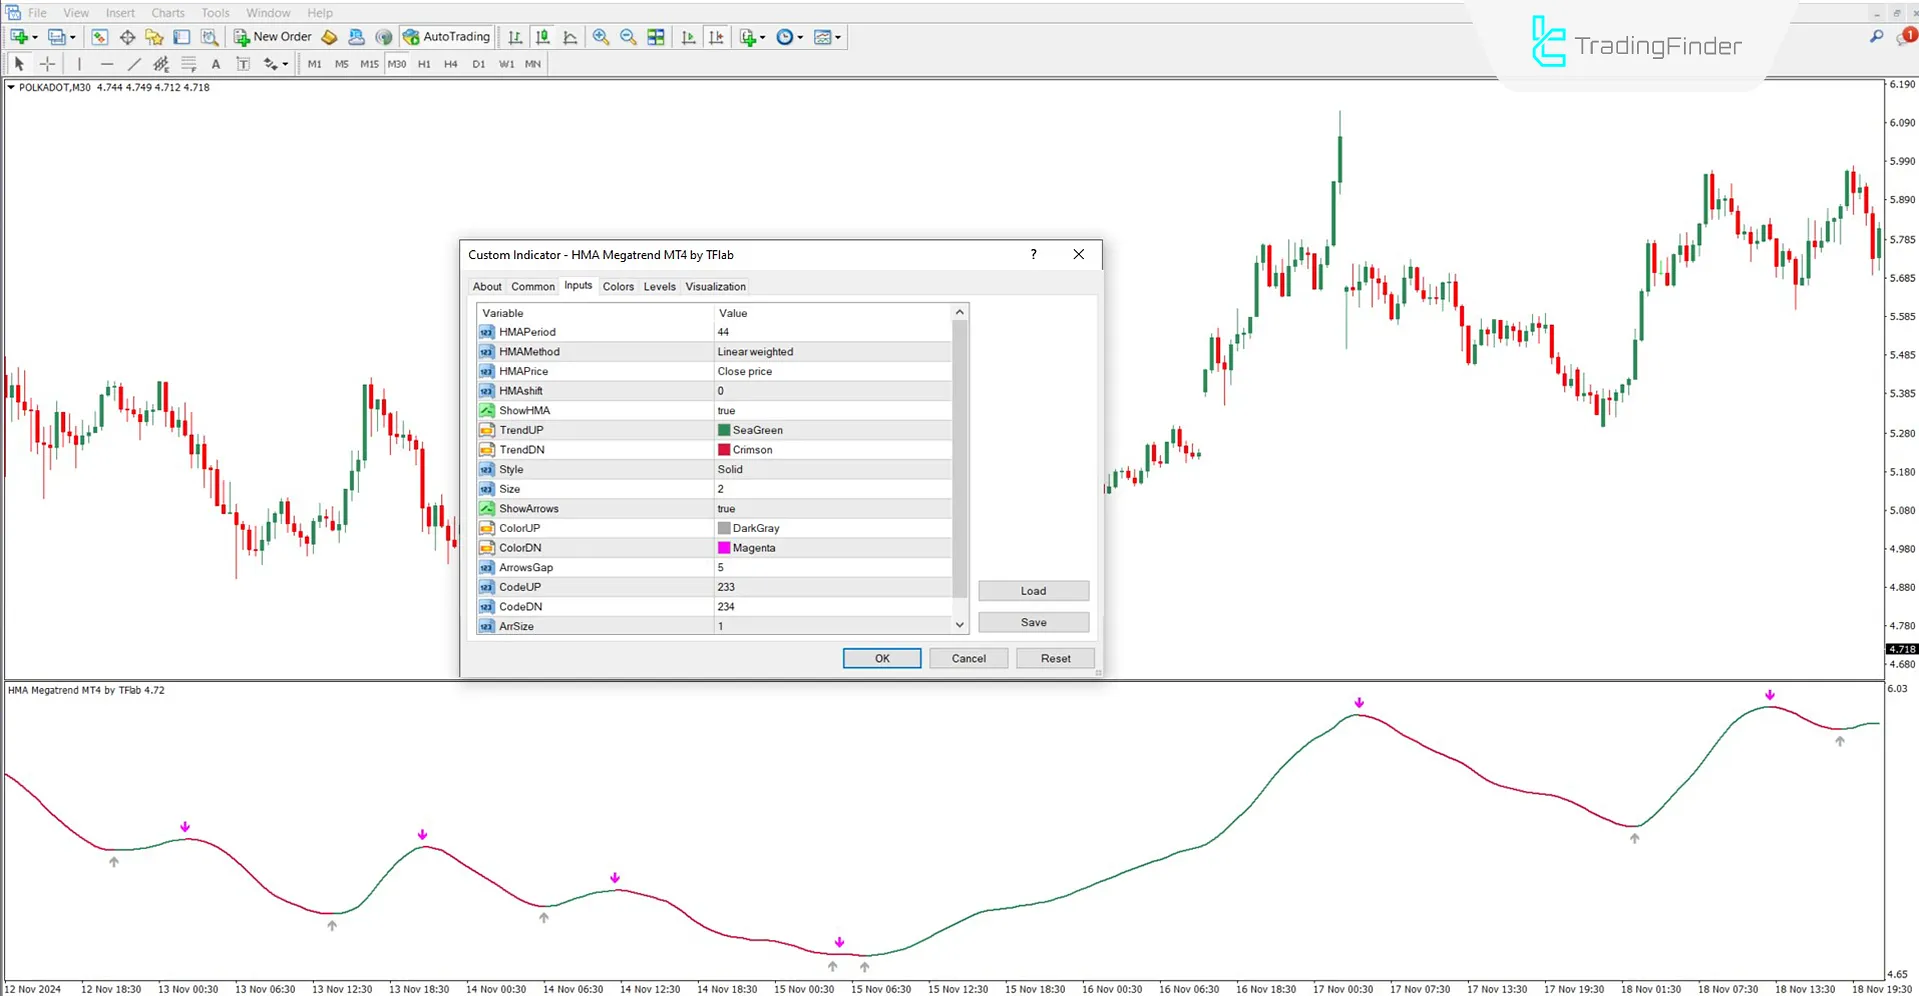
The following are the adjustable parameters available for the HMA Megatrend Oscillator:

- HMAPeriod: Hull Moving Average period
- HMAmethod: Moving average used
- HMAPrice: Price type used for HMA calculation
- HMAshift: Displacement value for the HMA line
- ShowHMA: Show or hide the HMA line on the chart
- TrendUP: Color of the HMA line during an uptrend
- TrendDN: Color of the HMA line during a downtrend
- Style: Display the style of the line
- Size: Thickness of the HMA line on the chart
- ShowArrows: Toggle to show or hide buy/sell signal arrows
- ColorUP: Color of the buy signal arrow
- ColorDN: Color of the sell signal arrow
- ArrowsGap: Vertical distance of the signal arrows from the line
- CodeUP: Arrow code for upward signal
- CodeDN: Arrow code for downward signal
- ArrSize: Size of the signal arrows
Conclusion
The HMA Megatrend Indicator, with its smoothing-based algorithm, effectively filters out random price noise, providing a clearer picture of significant market trends.
Its key advantage lies in the combination of a dynamic colored line and directional signal arrows, giving traders a visual and actionable guide to market direction andpotential entry points.
HMA Megatrend MT4 PDF
HMA Megatrend MT4 PDF
Click to download HMA Megatrend MT4 PDFHow is a buy signal displayed in the HMA Megatrend Oscillator?
A buy signal is displayed using a gray upward arrow when the trend shifts from bearish to bullish.
Can the indicator parameters be adjusted?
Yes, all parameters, including period, moving average type, line colors, and arrow settings, are fully customizable.


