![Holy Grail Indicator for MetaTrader 4 Download - [TradingFinder]](https://cdn.tradingfinder.com/image/290448/2-35-en-holy-grail-indicator-mt4-1.webp)
![Holy Grail Indicator for MetaTrader 4 Download - [TradingFinder] 0](https://cdn.tradingfinder.com/image/290448/2-35-en-holy-grail-indicator-mt4-1.webp)
![Holy Grail Indicator for MetaTrader 4 Download - [TradingFinder] 1](https://cdn.tradingfinder.com/image/290450/2-35-en-holy-grail-indicator-mt4-2.webp)
![Holy Grail Indicator for MetaTrader 4 Download - [TradingFinder] 2](https://cdn.tradingfinder.com/image/290449/2-35-en-holy-grail-indicator-mt4-3.webp)
![Holy Grail Indicator for MetaTrader 4 Download - [TradingFinder] 3](https://cdn.tradingfinder.com/image/290447/2-35-en-holy-grail-indicator-mt4-4.webp)
The Holy Grail Indicator is one of thetrading tools available on the MetaTrader 4 platform.
This MT4 signal and forecast indicator combines two technical indicators, ADX and Exponential Moving Average (EMA), to not only display entry points but also indicate exit points with an arrow in the opposite color.
Additionally, this tool highlights the latest issued signal on the right side of the chart.
Holy Grail Specifications Table
The general features of the “Holy Grail” indicator are listed in the table below.
Indicator Categories: | Signal & Forecast MT4 Indicators Currency Strength MT4 Indicators Trading Assist MT4 Indicators |
Platforms: | MetaTrader 4 Indicators |
Trading Skills: | Intermediate |
Indicator Types: | Reversal MT4 Indicators |
Timeframe: | Multi-Timeframe MT4 Indicators |
Trading Style: | Day Trading MT4 Indicators |
Trading Instruments: | Forward Market MT4 Indicators Stock Market MT4 Indicators Cryptocurrency MT4 Indicators Forex MT4 Indicators |
Indicator Overview
The Holy Grail Indicator can be used to identify trend changes and their strength at key price levels.
Additionally, it displays a box on the left side of the chart, providing comprehensive price chart data, including: ASK, BID, Spread, Account information such as Balance, Equity, and Margin.
Uptrend Conditions
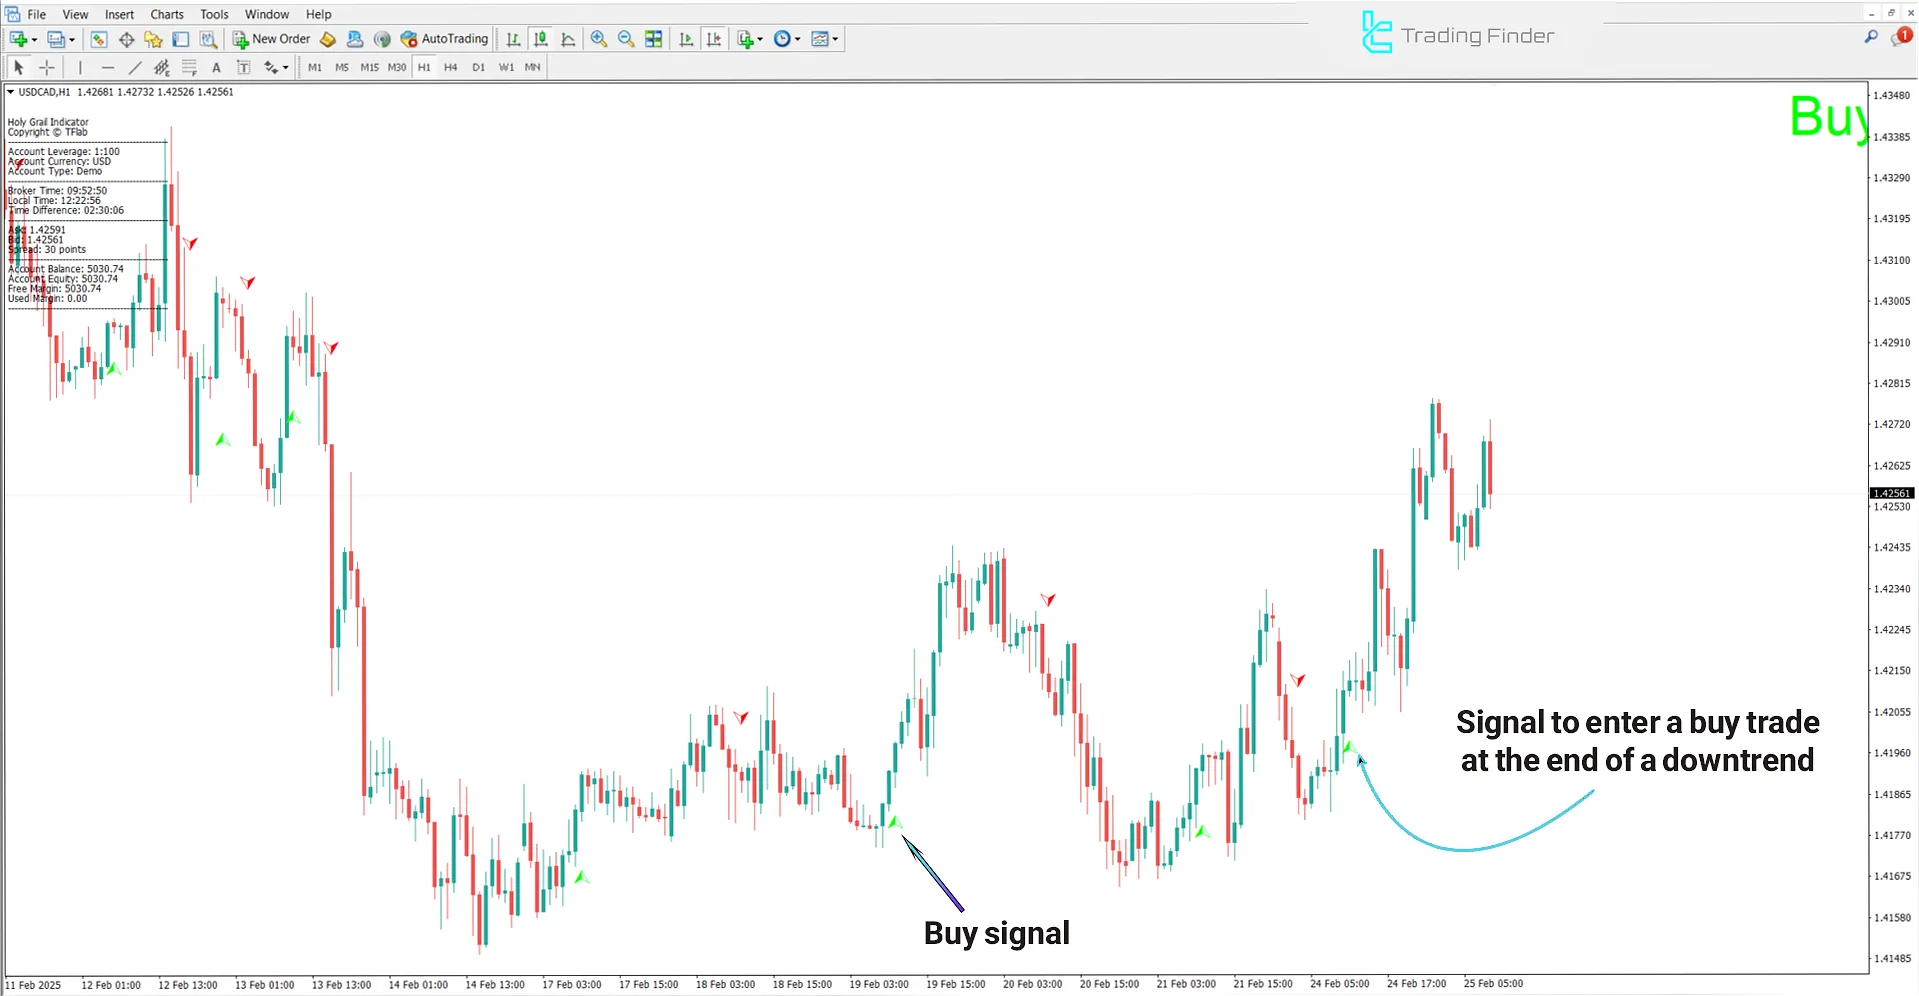
The chart below illustrates the price movement of USD/CAD in a one-hour timeframe.
The Holy Grail Indicator for MetaTrader 4 generates a bullish (Buy) signal by displaying a green arrow below the candlestick, indicating the weakness of sellers.

Downtrend Conditions
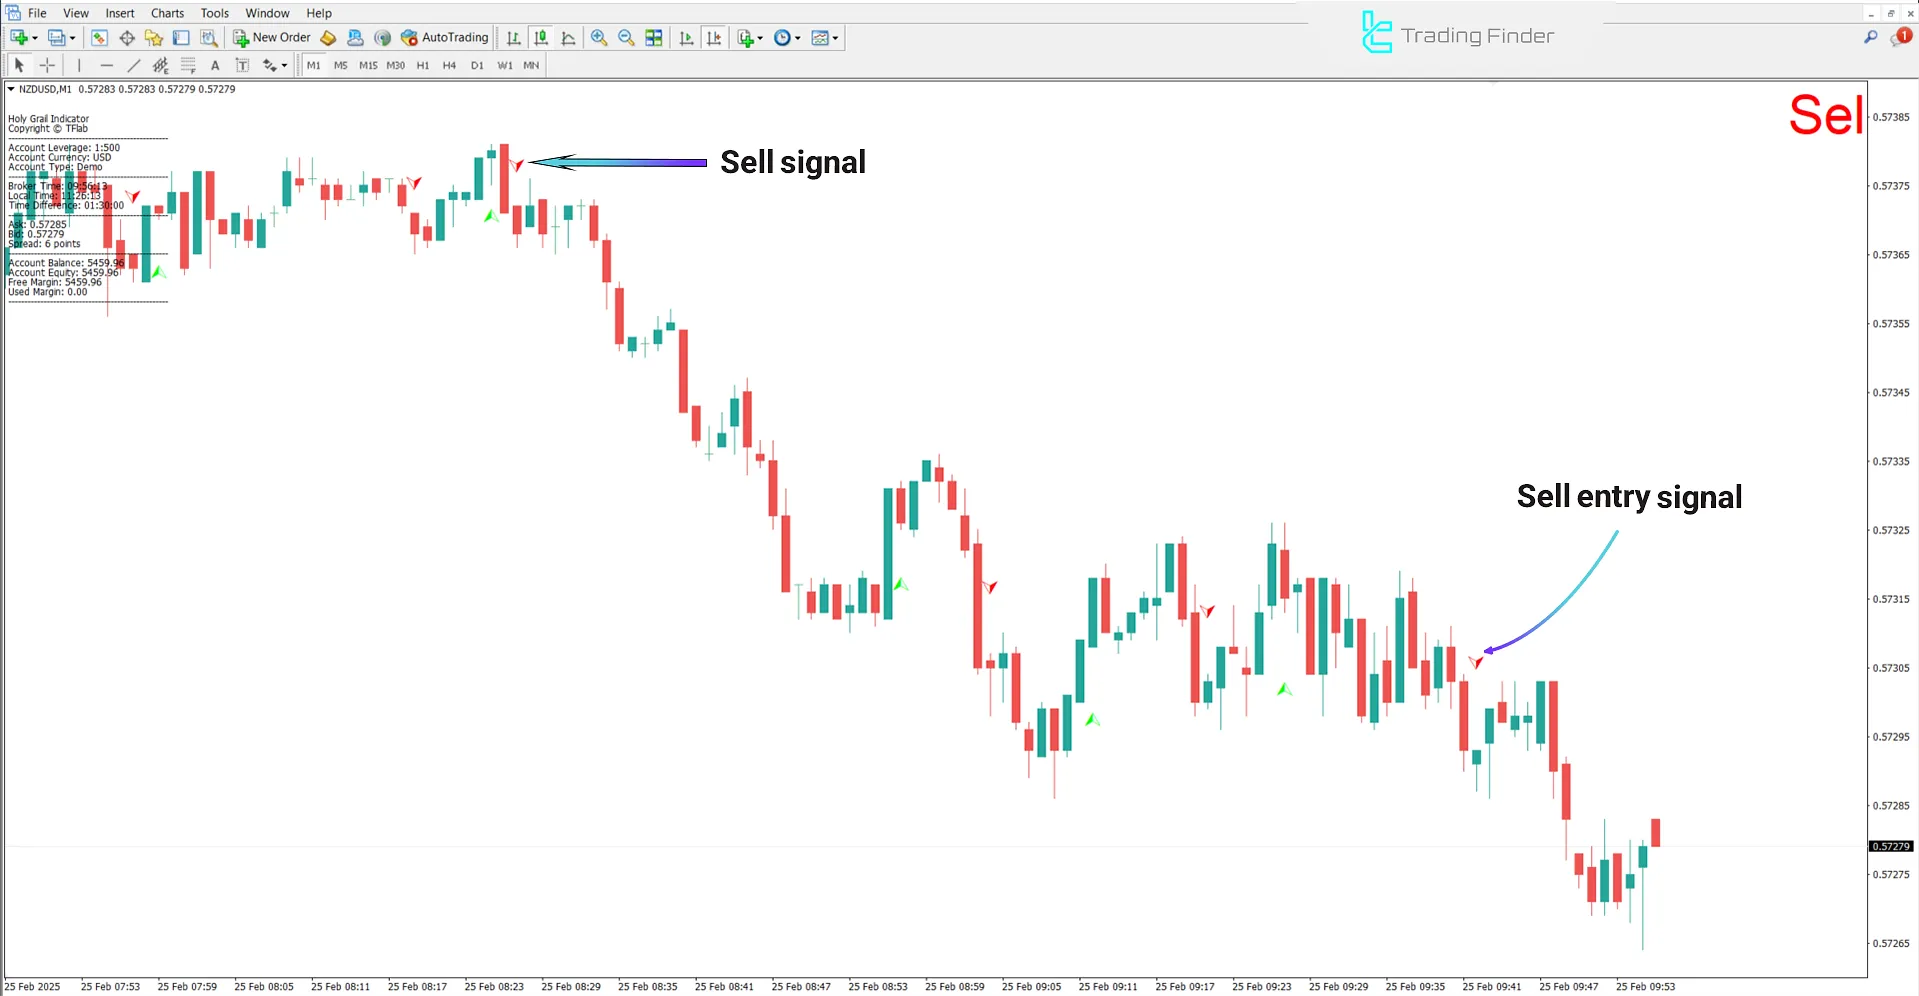
The image below displays the price chart of the NZD/USD currency pair in a 1-minute timeframe.
A red arrow above the candlestick, along with a sell signal on the right side of the image, represents the latest Sell entry signal, indicating selling pressure and the strength of the bearish trend.

Indicator Settings
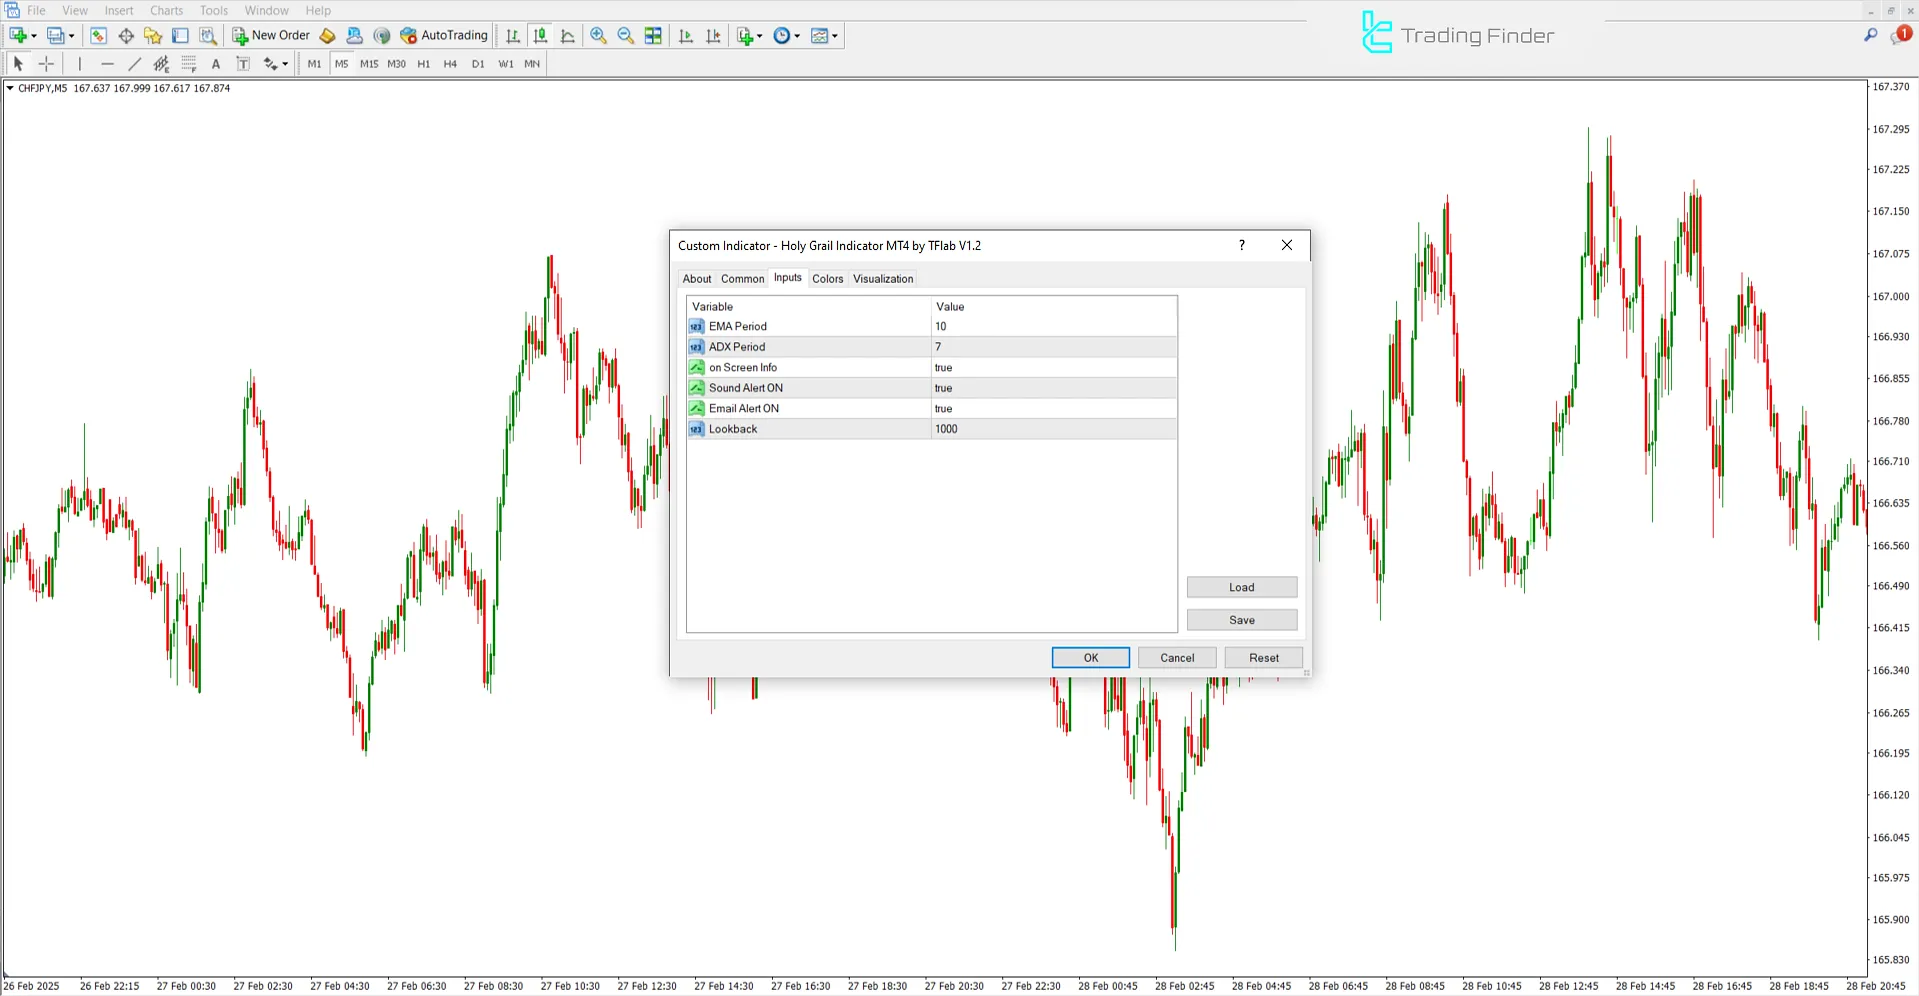
The image below displays the settings of the Holy Grail Indicator on the MetaTrader 4 platform.

- EMA Period: Exponential Moving Average period
- ADX Period: Indicator period
- On Screen Info: Display information on the screen
- Sound Alert ON: Enable sound alerts
- Email Alert ON: Enable email notifications
- Lookback: Number of past candlesticks analyzed
Conclusion
The Holy Grail Indicator combines ADX and Exponential Moving Average (EMA) to identify entry and exit points, detect trend changes, and measure trend strength at key price levels.
This MetaTrader 4 Currency Strength indicator displays the latest trading signal on the right side and provides a data box on the left side to show essential chart information.
Holy Grail MT4 PDF
Holy Grail MT4 PDF
Click to download Holy Grail MT4 PDFWhat is the suitable time frame for using the Holy Grail Indicator?
This is a multi-timeframe indicator, meaning it can be used across all timeframes.
Does the Holy Grail Indicator provide entry and exit signals?
Yes, this trading tool displays entry and exit signals using red and green arrows.


