![HRLR & LRLR ICT Indicator for MetaTrader 4 Download - Free - [TFlab]](https://cdn.tradingfinder.com/image/194941/4-37-en-hrlr-lrlr-ict-mt4-1.webp)
![HRLR & LRLR ICT Indicator for MetaTrader 4 Download - Free - [TFlab] 0](https://cdn.tradingfinder.com/image/194941/4-37-en-hrlr-lrlr-ict-mt4-1.webp)
![HRLR & LRLR ICT Indicator for MetaTrader 4 Download - Free - [TFlab] 1](https://cdn.tradingfinder.com/image/194934/4-37-en-hrlr-lrlr-ict-mt4-2.webp)
![HRLR & LRLR ICT Indicator for MetaTrader 4 Download - Free - [TFlab] 2](https://cdn.tradingfinder.com/image/194936/4-37-en-hrlr-lrlr-ict-mt4-3.webp)
![HRLR & LRLR ICT Indicator for MetaTrader 4 Download - Free - [TFlab] 3](https://cdn.tradingfinder.com/image/194935/4-37-en-hrlr-lrlr-ict-mt4-4.webp)
The High Resistance Liquidity Run (HRLR) and Low Resistance Liquidity Run (LRLR) indicators,powerful tool in MetaTrader 4 indicators for analyzingprice behavior in relation to liquidity zones, derived from the ICT methodology.
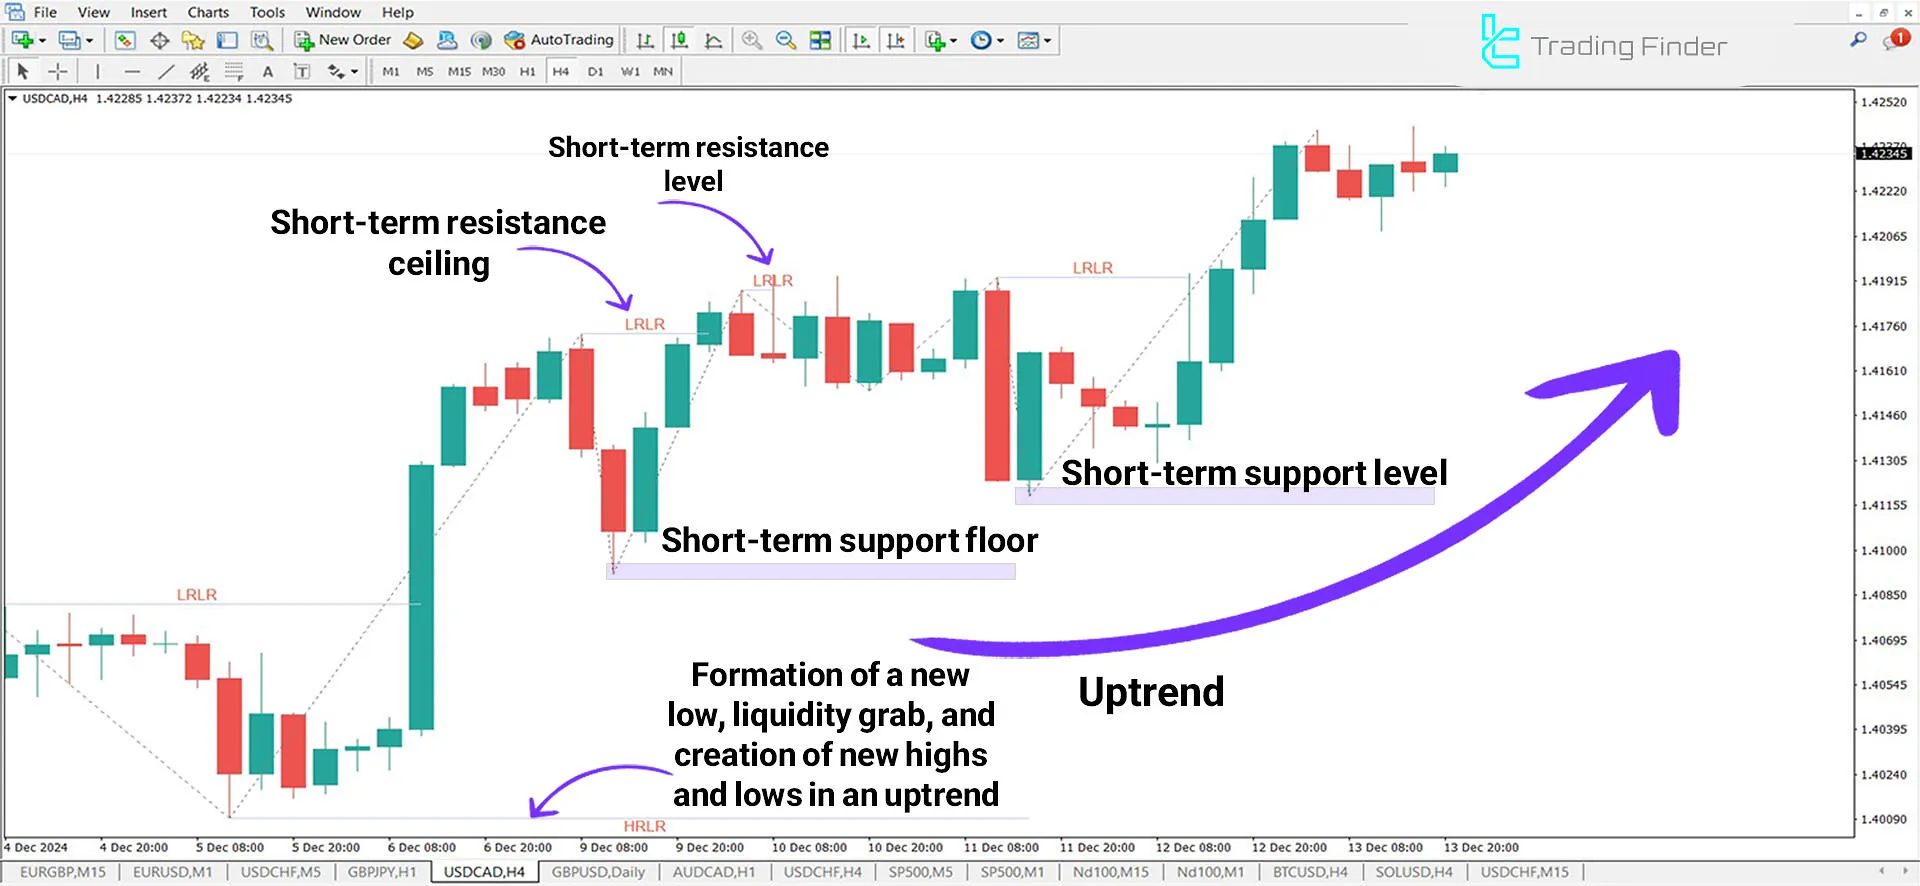
The HRLR (High Resistance Liquidity Run) occurs when the price starts to gather liquidity after forming its lowest low, initiating a movement.
This movement leads to the creation of higher lows and higher highs, eventually transitioning into an upward trend.
Conversely, the LRLR (Low Resistance Liquidity Run) represents the smooth price movement towards liquidity zones with lower resistance.
In this scenario, theprice moves upward by forming higher lows, reaching new peaks. These peaks represent LRLR (Low Resistance Liquidity Runs) within the trend structure.
Specifications Table of the HRLR & LRLR Indicator
The table below provides an overview of the HRLR & LRLR ICT indicator's specifications:
Indicator Categories: | ICT MT4 Indicators Support & Resistance MT4 Indicators Levels MT4 Indicators |
Platforms: | MetaTrader 4 Indicators |
Trading Skills: | Advanced |
Indicator Types: | Breakout MT4 Indicators Reversal MT4 Indicators |
Timeframe: | Multi-Timeframe MT4 Indicators |
Trading Style: | Day Trading MT4 Indicators |
Trading Instruments: | Share Stocks MT4 Indicators Forward Market MT4 Indicators Cryptocurrency MT4 Indicators Forex MT4 Indicators |
Indicator in an Uptrend
On the price chart of the USD/CAD currency pair in the 4-hour timeframe, the price, after forming HRLR (High-Resistance Liquidity Movement), begins creating new lows and highs within an uptrend.
In this scenario, traders can enter buy trades in this key area by confirming patterns such as pin bars or strong bullish candles.

Indicator in a Downtrend
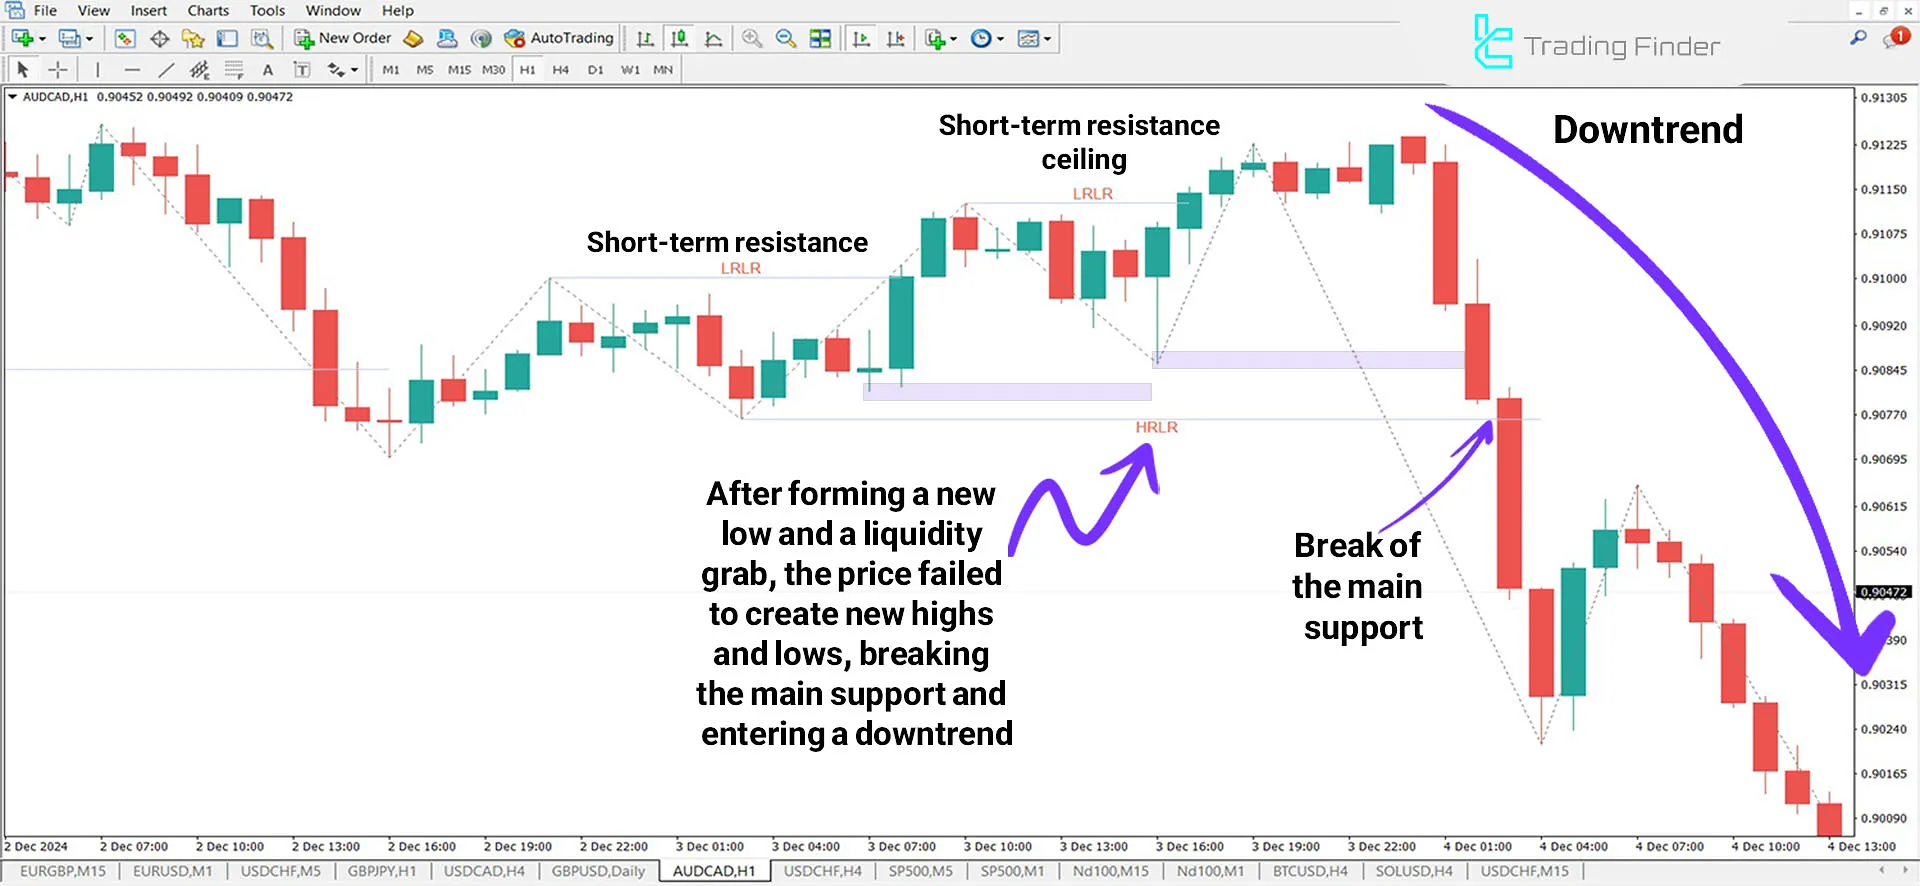
In the following downtrend, the price temporarily grows after a liquidity grab, but after forming two short-term lows, it fails to form higher highs and lows.
Consequently, with the break of one of these main lows, traders can receive the necessary confirmation to enter sell trades in line with the continuation of the downtrend.

Settings of the HRLR & LRLR Indicator
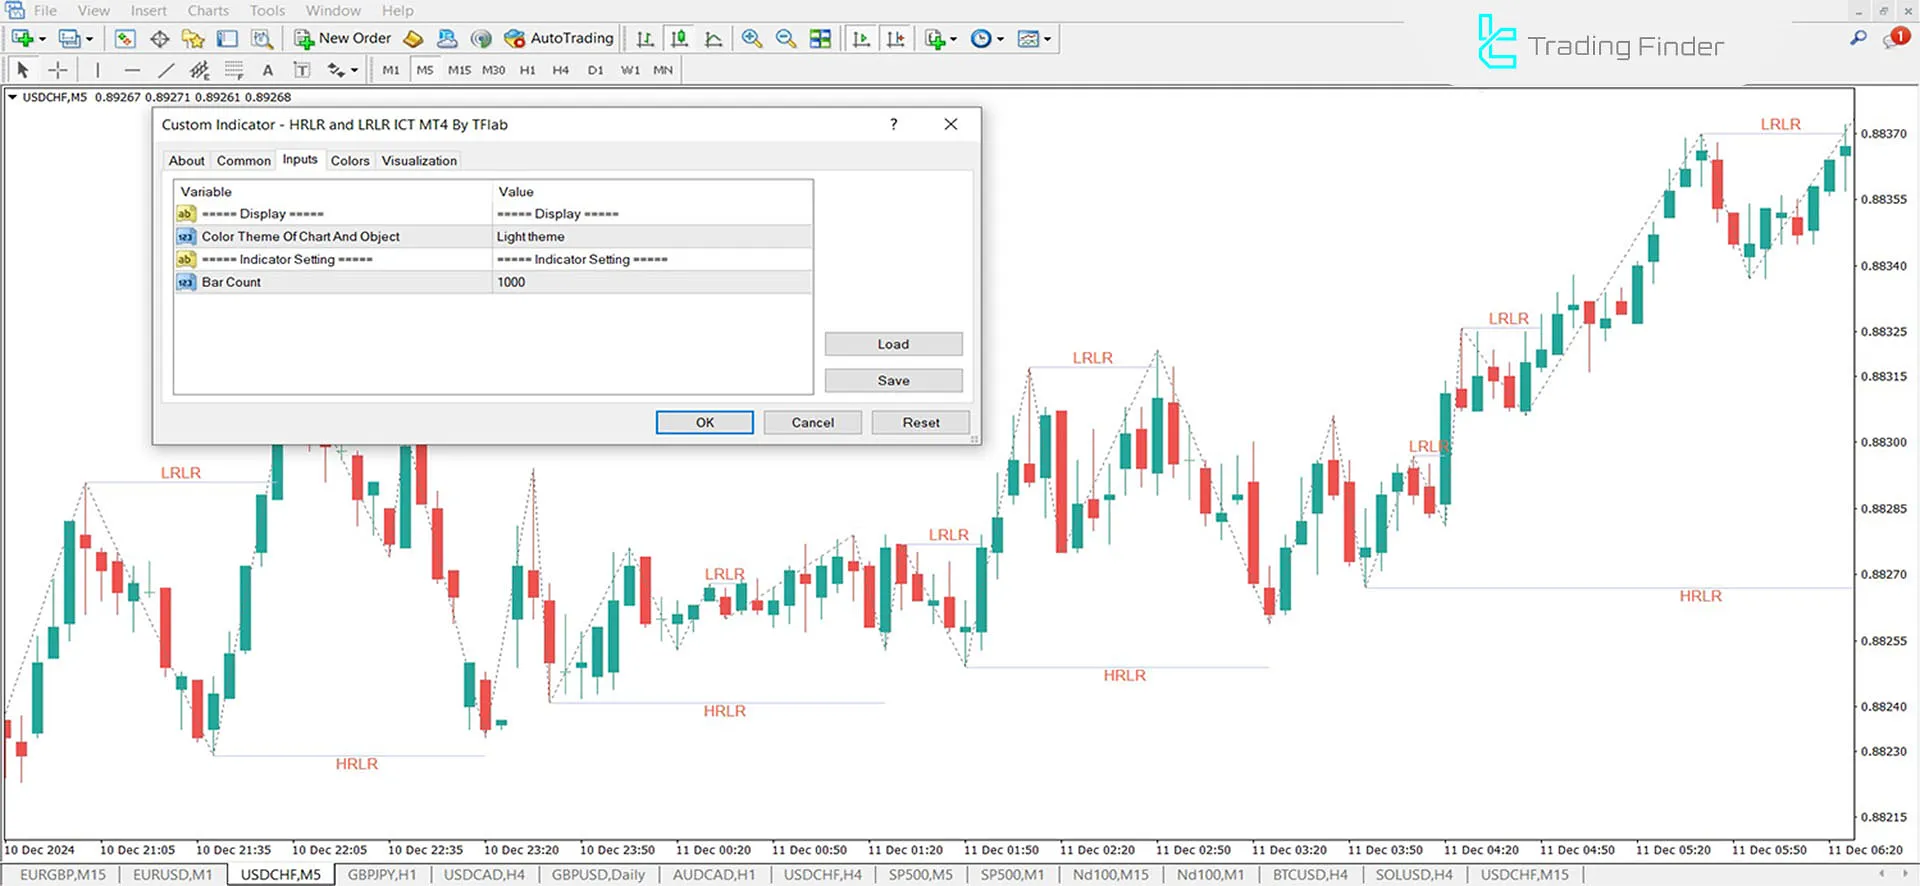
In the image below, a complete description of the indicator settings is provided, which includes [Display and Indicator Setting]:

- Color Theme of Chart and Object: The background theme of the indicator;
- Bar Count: Counts the number of reversal candles to display the indicator.
Conclusion
HRLR & LRLR indicator identifies key reversal zones or trend continuation areas by analyzing the formation of new highs and lows.
In scenarios where higher highs and higher lows or lower highs and lower lows are formed, this indicator plays a crucial role in confirming entry or exit points in a trade.
HRLR LRLR ICT MT4 PDF
HRLR LRLR ICT MT4 PDF
Click to download HRLR LRLR ICT MT4 PDFHow can I get a confirmation for trade entry using this indicator?
Using candlestick patterns like pin bars and strong candles or complementary tools like Fibonacci retracements.
Is this indicator suitable for intermediate traders?
With a basic understanding of technical analysis concepts, such as recognizing liquidity zones, intermediate traders can use it effectively.


