![Ichimoku Senkou A Channel Indicator MT4 Download – Free – [TFlab]](https://cdn.tradingfinder.com/image/601398/13-235-en-ichimoku-senkou-a-envelope-mt4-01.webp)
![Ichimoku Senkou A Channel Indicator MT4 Download – Free – [TFlab] 0](https://cdn.tradingfinder.com/image/601398/13-235-en-ichimoku-senkou-a-envelope-mt4-01.webp)
![Ichimoku Senkou A Channel Indicator MT4 Download – Free – [TFlab] 1](https://cdn.tradingfinder.com/image/601395/13-235-en-ichimoku-senkou-a-envelope-mt4-02.webp)
![Ichimoku Senkou A Channel Indicator MT4 Download – Free – [TFlab] 2](https://cdn.tradingfinder.com/image/601396/13-235-en-ichimoku-senkou-a-envelope-mt4-03.webp)
![Ichimoku Senkou A Channel Indicator MT4 Download – Free – [TFlab] 3](https://cdn.tradingfinder.com/image/601400/13-235-en-ichimoku-senkou-a-envelope-mt4-04.webp)
The Ichimoku Senkou A Envelope Indicator is one of the advanced tools in technical analysis. This tool is used to identify the market trend direction and potential price reversal points.
The Ichimoku Senkou A Channel Indicator is part of the Ichimoku family of tools and, by using upper and lower bands, shows traders dynamic support and resistance areas.
Specification Table of Ichimoku Senkou A Envelope Indicator
The specifications of the Ichimoku Senkou A Envelope Indicator are as follows:
Indicator Categories: | Signal & Forecast MT4 Indicators Bands & Channels MT4 Indicators Ichimoku Indicators for MetaTrader 4 |
Platforms: | MetaTrader 4 Indicators |
Trading Skills: | Intermediate |
Indicator Types: | Reversal MT4 Indicators |
Timeframe: | Multi-Timeframe MT4 Indicators |
Trading Style: | Day Trading MT4 Indicators Scalper MT4 Indicators Swing Trading MT4 Indicators |
Trading Instruments: | Share Stocks MT4 Indicators Indices Market MT4 Indicators Commodity Market MT4 Indicators Stock Market MT4 Indicators Cryptocurrency MT4 Indicators Forex MT4 Indicators |
Ichimoku Senkou A Envelope Indicator at a Glance
This indicator, by drawing two main bands and analyzing price movement relative to these bands, displays potential price reversal points.
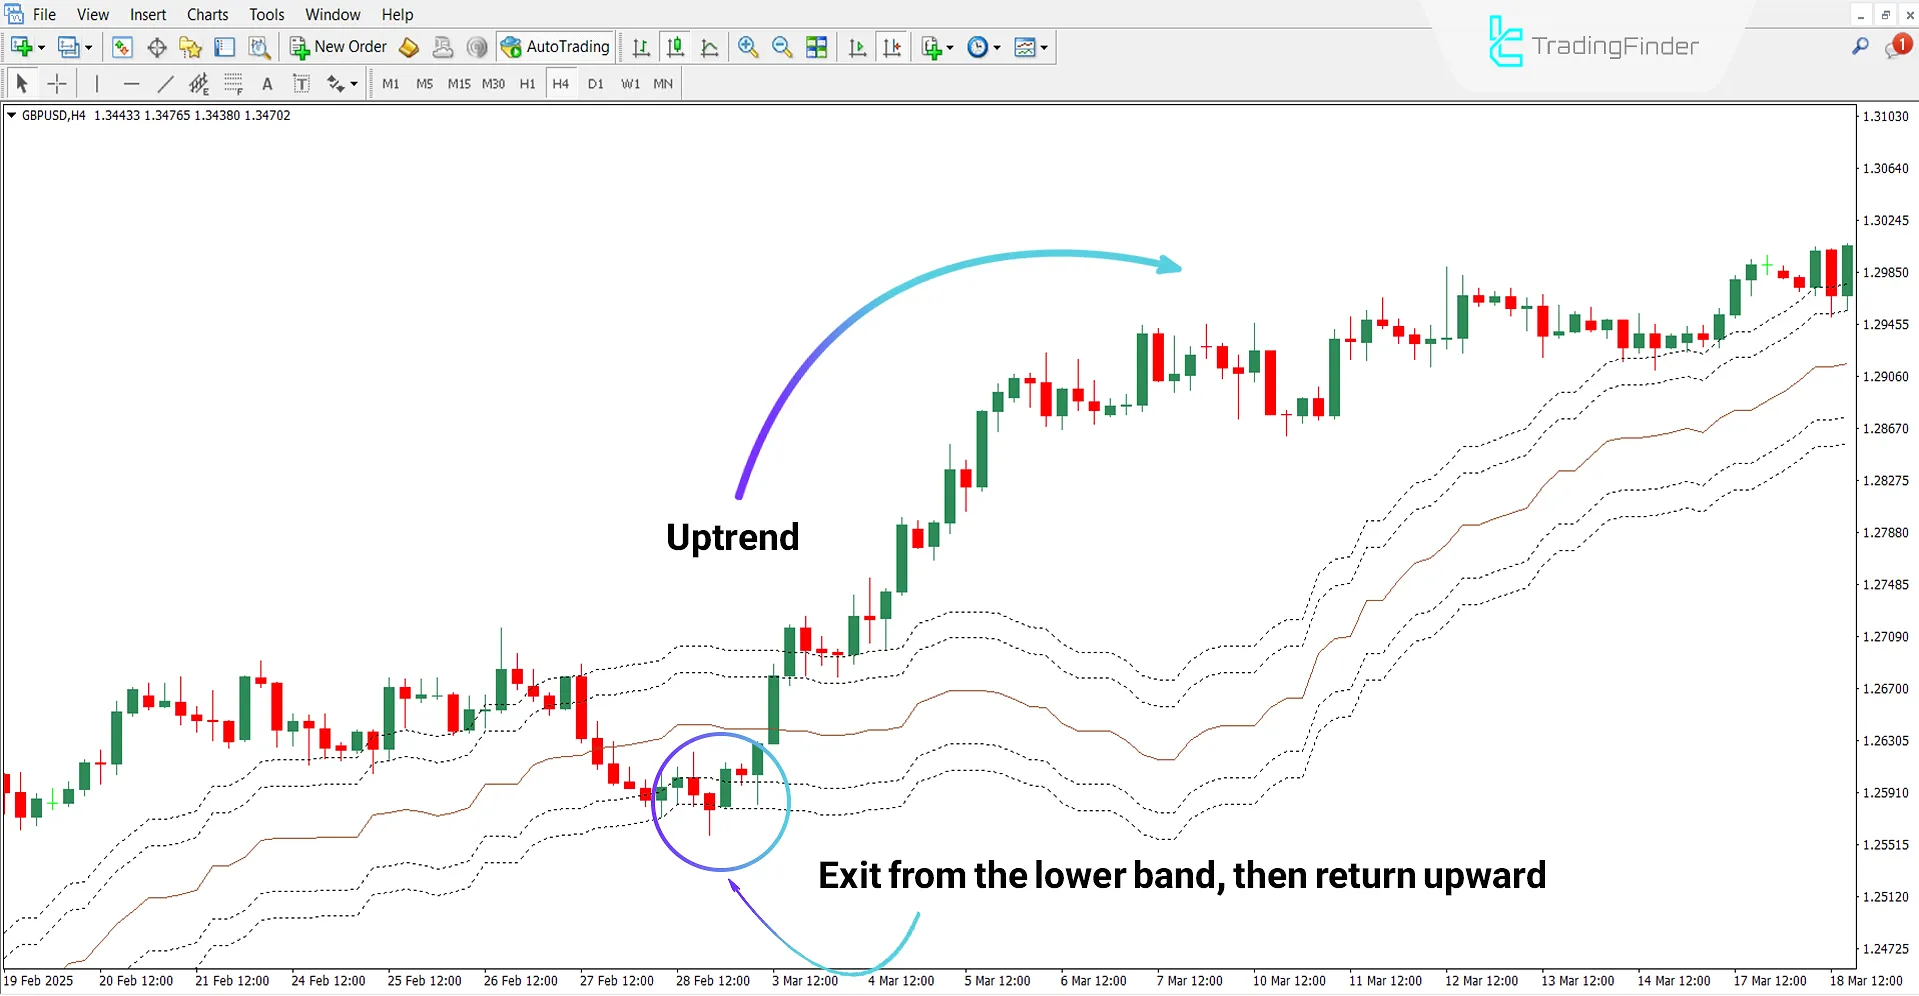
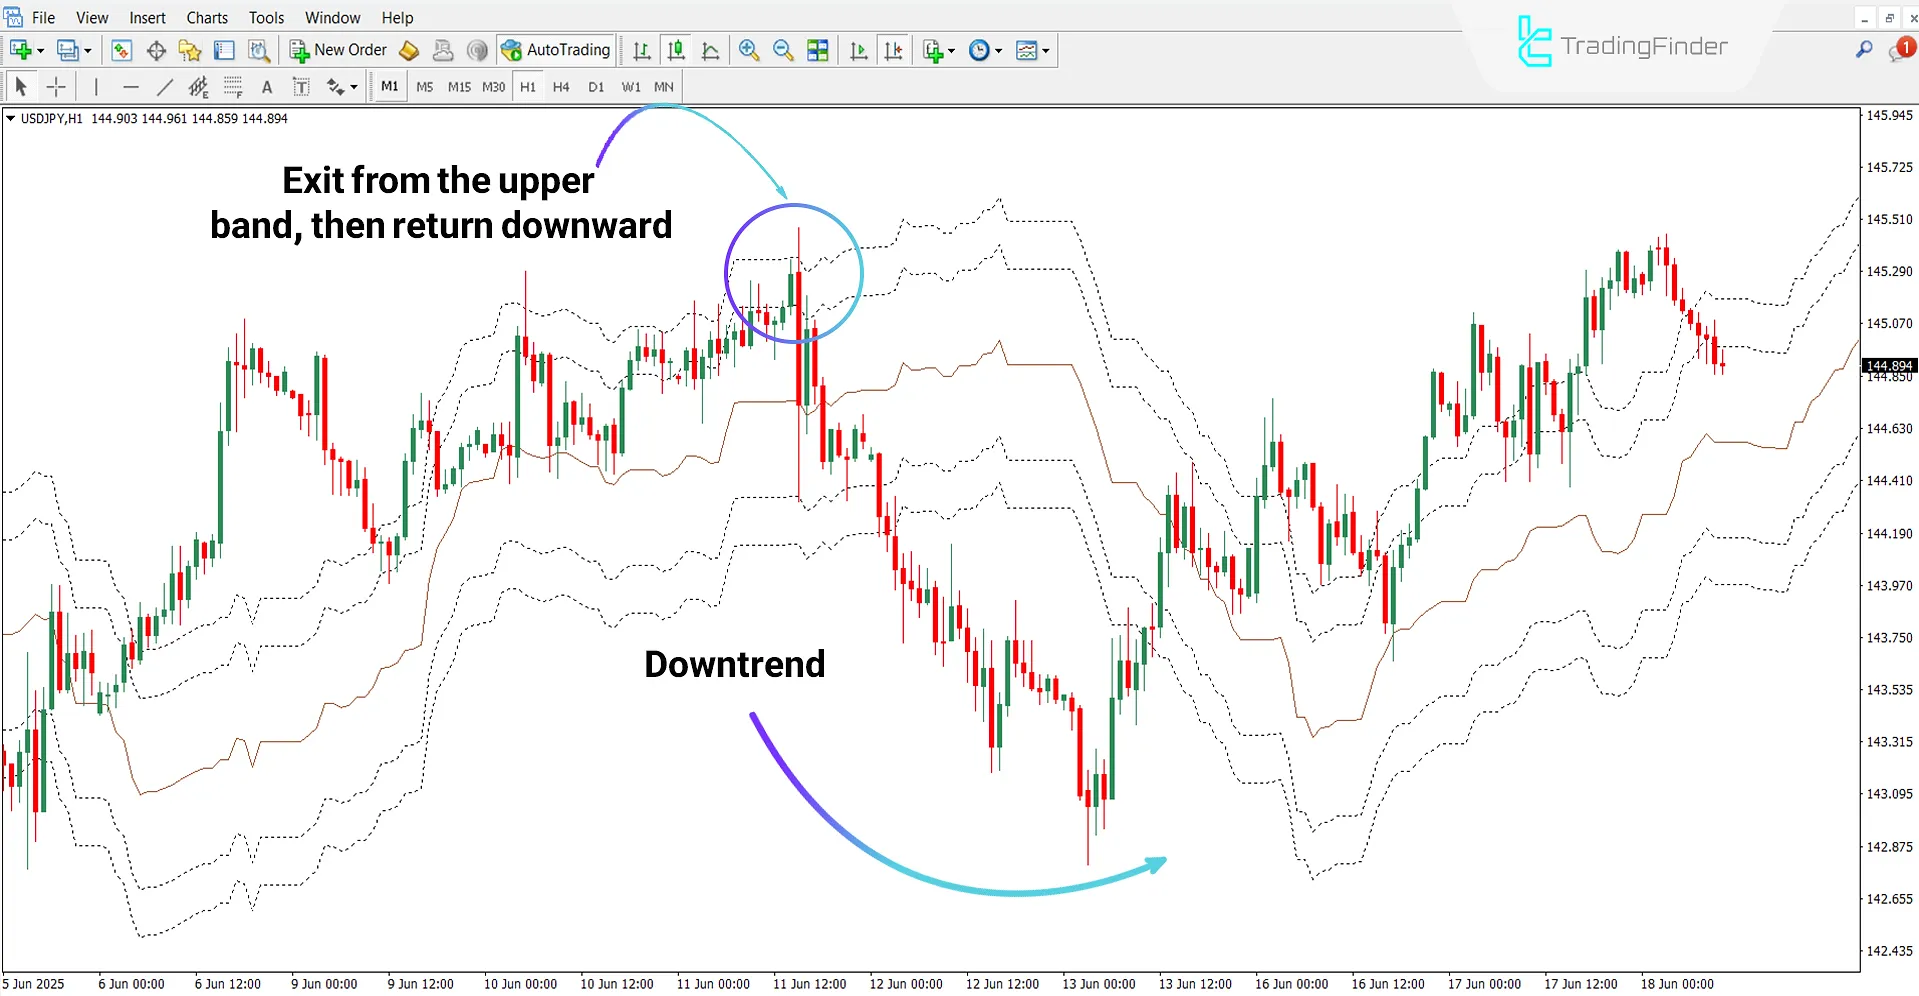
Thus, when the price crosses below the lower band and returns upward, it indicates an uptrend. Conversely, when the price crosses above the upper band and then closes below the lower band, it confirms a downtrend.
Bullish Trend Conditions
According to the GBP/USD chart on the 4-hour timeframe, crossing the lower band and returning above it indicates the beginning of an uptrend.
Furthermore, price stabilization above the indicator’s bands signals buyer strength and a continuing uptrend.

Bearish Trend Conditions
Based on the USD/JPY chart on the 1-hour timeframe, the price returning downward after crossing the upper band is the first sign of the beginning of a downtrend.
In addition, stabilization of the downtrend below the bands confirms its continuation.

Settings of Ichimoku Senkou A Channel Indicator
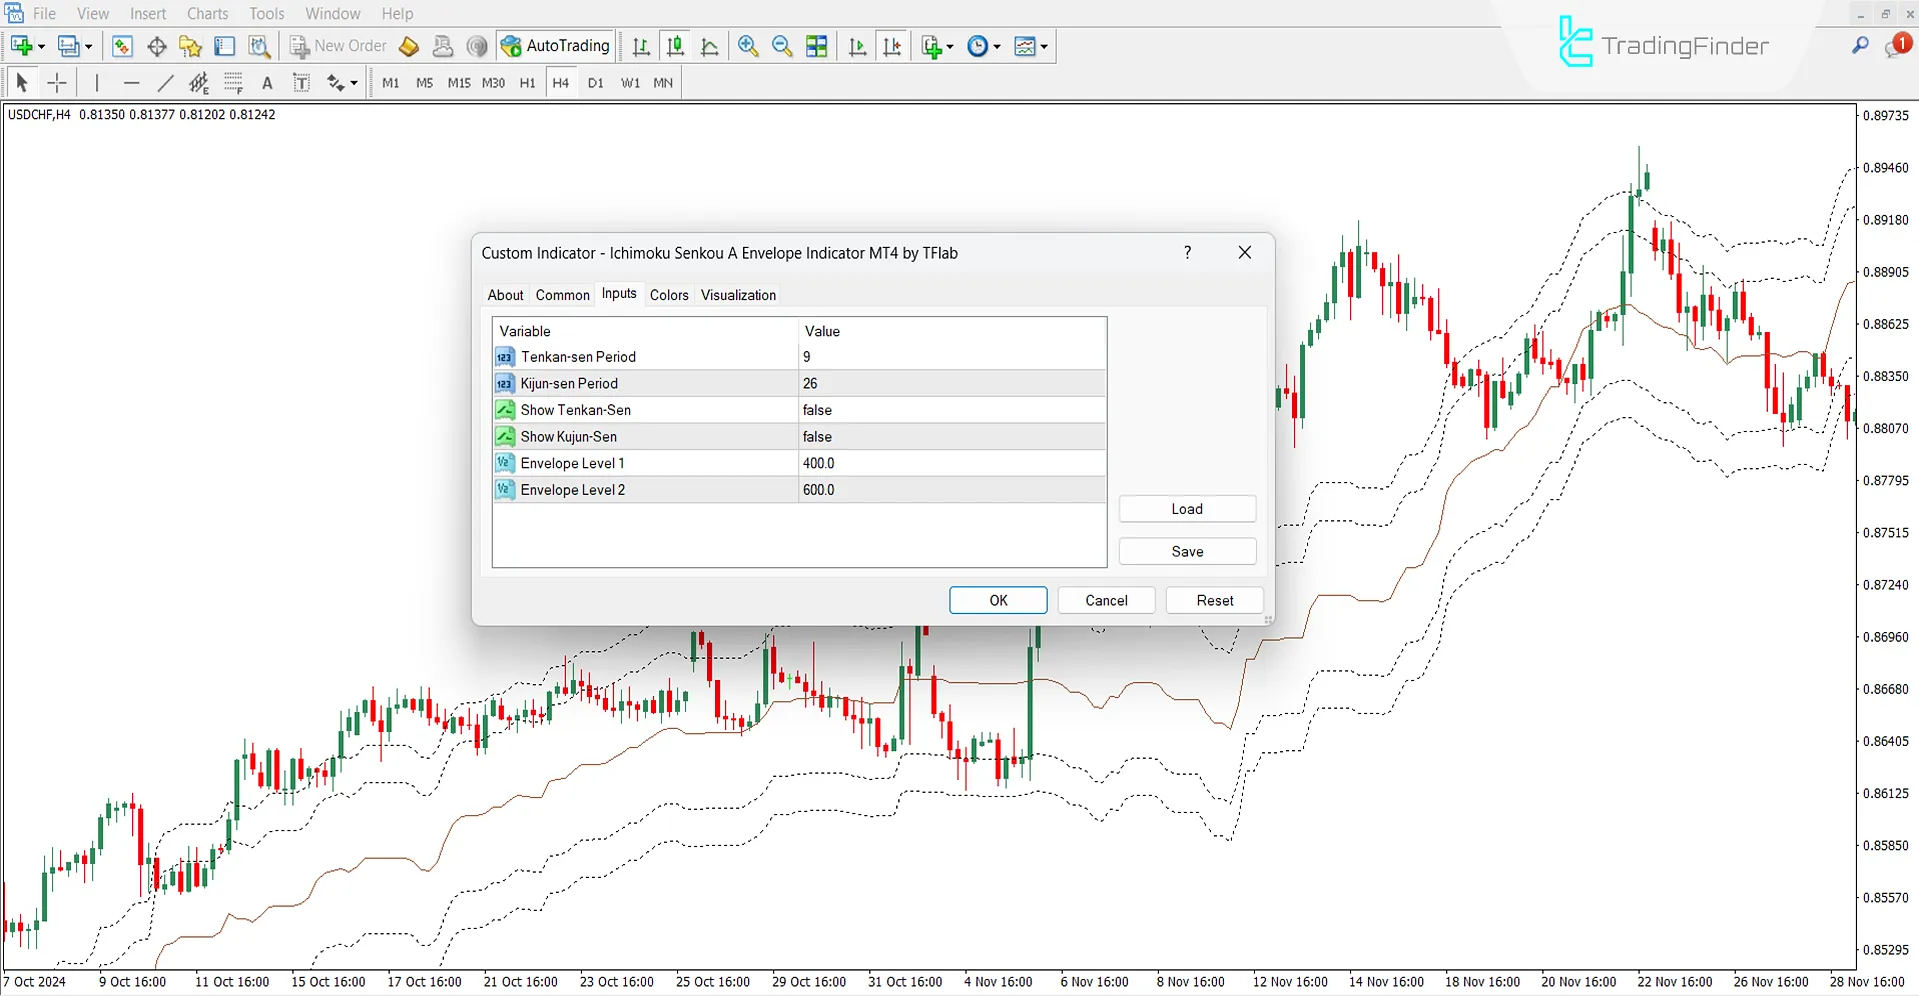
The adjustable parameters of the Ichimoku Senkou A Envelope Indicator are as follows:

- Tenkan-sen Period: Calculation period of Tenkan-sen line
- Kijun-sen Period: Calculation period of Kijun-sen line
- Show Tenkan-Sen: Display status of Tenkan-sen line
- Show Kijun-Sen: Display status of Kijun-sen line
- Envelope Level 1: Coverage range of level one
- Envelope Level 2: Coverage range of level two
Conclusion
The Ichimoku Senkou A Envelope Indicator, by drawing dynamic bands, displays the market trend and potential price reversal zones.
Additionally, the positioning of price relative to these bands confirms the beginning of bullish and bearish trends.
One of the features of this trading tool is displaying the important Ichimoku lines, namely Tenkan-sen and Kijun-sen.
Ichimoku Senkou A Channel Indicator MT4 PDF
Ichimoku Senkou A Channel Indicator MT4 PDF
Click to download Ichimoku Senkou A Channel Indicator MT4 PDFDoes it only apply to the Forex market?
No, the Ichimoku Senkou A Envelope Indicator can be used in all markets.
What is Tenkan-sen in the Ichimoku Senkou A Envelope Indicator?
A line from the Ichimoku system that shows the short-term average of price.


