![ICT ADR Levels and Zones Indicator for MT4 Download – Free – [TradingFinder]](https://cdn.tradingfinder.com/image/460891/13-166-en-ict-adr-levels-and-zones-mt4-01.webp)
![ICT ADR Levels and Zones Indicator for MT4 Download – Free – [TradingFinder] 0](https://cdn.tradingfinder.com/image/460891/13-166-en-ict-adr-levels-and-zones-mt4-01.webp)
![ICT ADR Levels and Zones Indicator for MT4 Download – Free – [TradingFinder] 1](https://cdn.tradingfinder.com/image/460880/13-166-en-ict-adr-levels-and-zones-mt4-02.webp)
![ICT ADR Levels and Zones Indicator for MT4 Download – Free – [TradingFinder] 2](https://cdn.tradingfinder.com/image/460869/13-166-en-ict-adr-levels-and-zones-mt4-03.webp)
The ICT ADR Levels and Zones Indicator is designed based on the concepts of the ICT trading methodology and is suitable for analyzing daily market volatility.
This trading tool analyzes price behavior over the past five periods, assessing previous highs and lows, and identifies Average Daily Range (ADR) zones, which are then displayed on the chart. These levels are shown at 1/3, 1/2, and 1 times the ADR and are respectively marked in green, blue, and red on the chart.
Specifications Table – ICT ADR Levels and Zones Indicator
Below are the specifications of the ADR Levels Indicator in ICT style.
Indicator Categories: | ICT MT4 Indicators Liquidity MT4 Indicators Trading Assist MT4 Indicators |
Platforms: | MetaTrader 4 Indicators |
Trading Skills: | Advanced |
Indicator Types: | Reversal MT4 Indicators |
Timeframe: | Multi-Timeframe MT4 Indicators |
Trading Style: | Day Trading MT4 Indicators Scalper MT4 Indicators Swing Trading MT4 Indicators |
Trading Instruments: | Stock Market MT4 Indicators Cryptocurrency MT4 Indicators Forex MT4 Indicators |
ICT ADR Levels and Zones Indicator at a Glance
One of the key applications of the ICT ADR Levels and Zones Indicator is identifying early deceptive moves in trading sessions, such as those in London or New York, known in the ICT methodology as the Judas Swing.
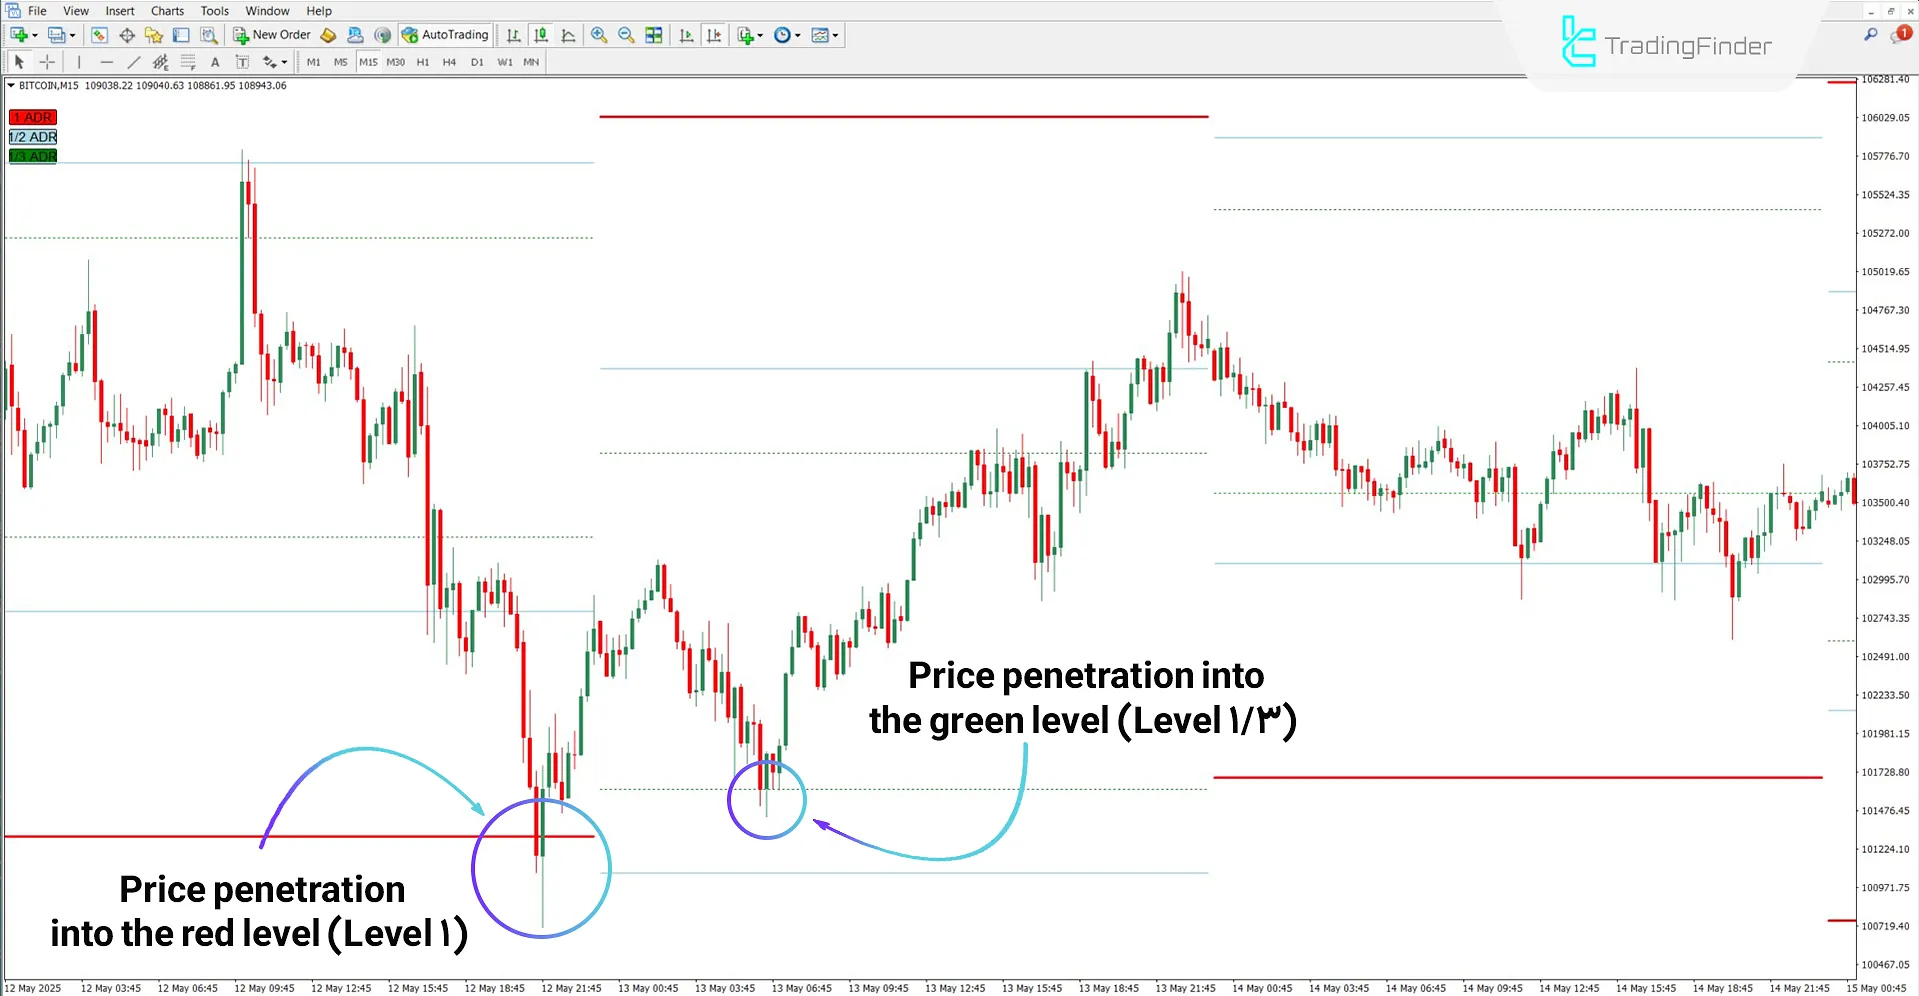
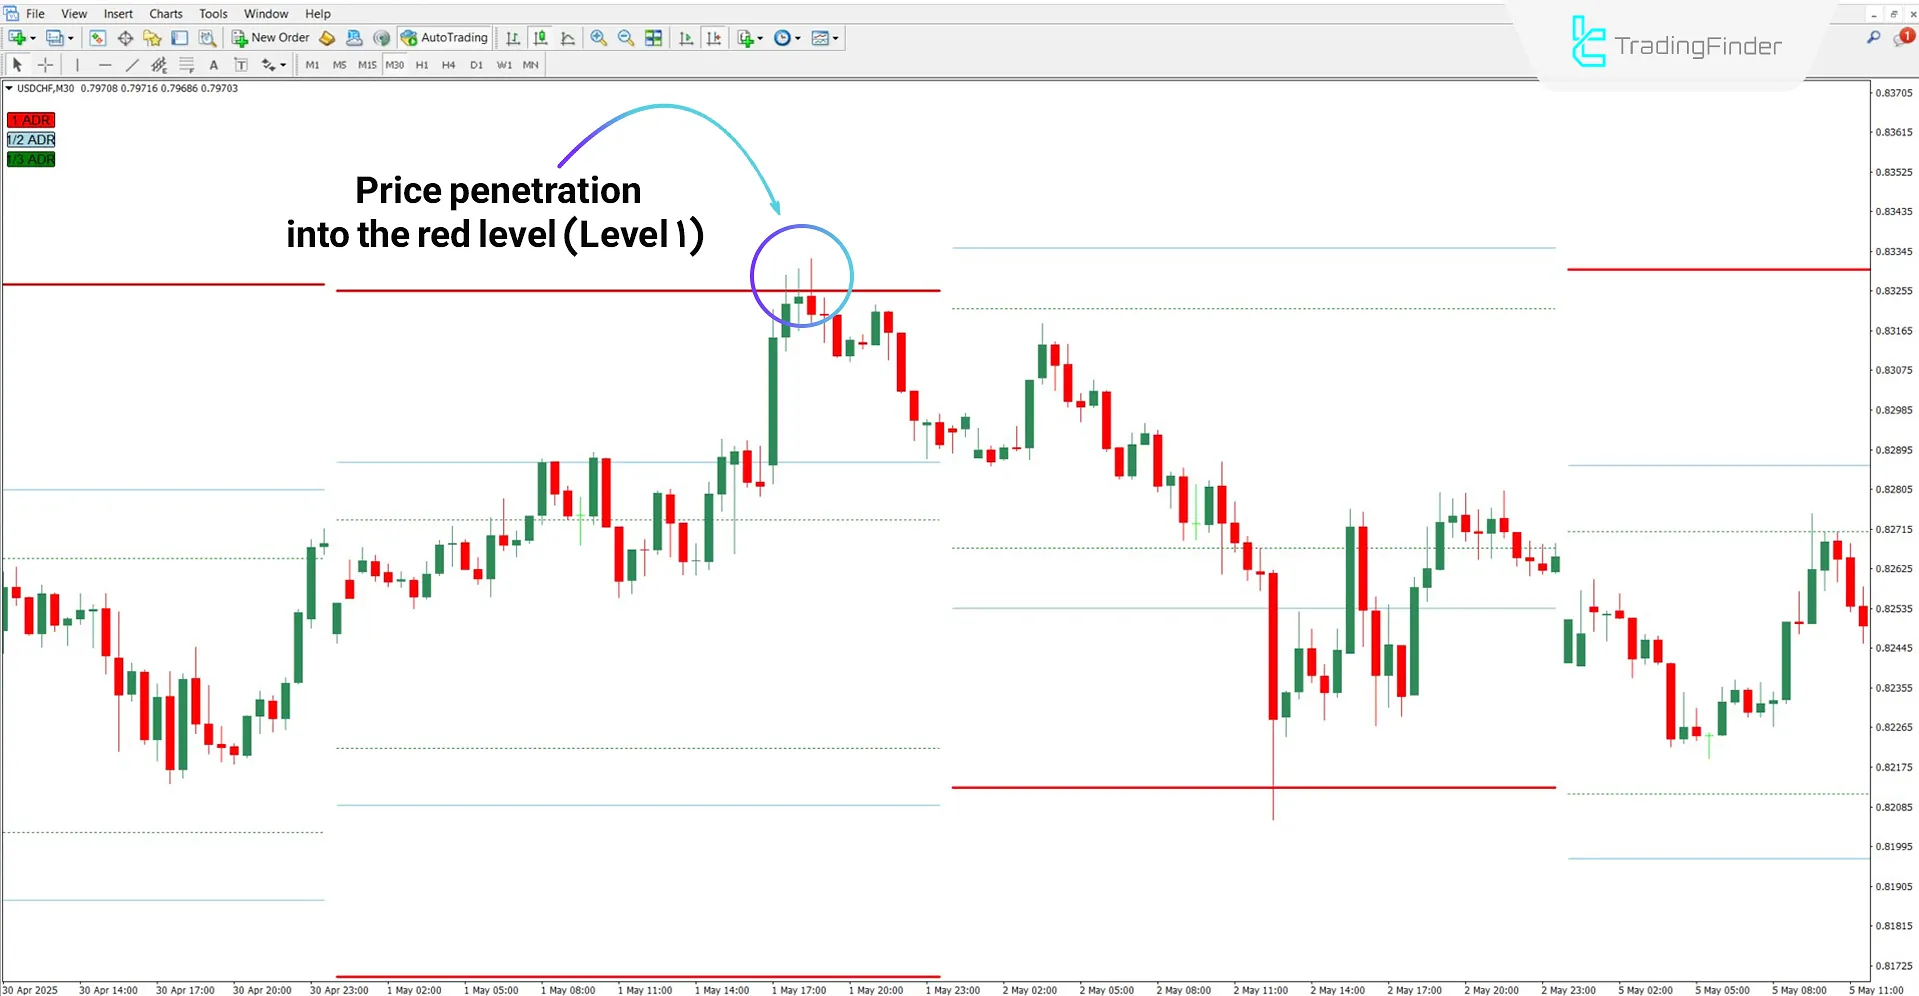
These moves typically begin with price penetration into one of the ADR levels, absorb liquidity, and then reverse direction to enter the main move of the day.
Bullish Move
Based on the 15-minute chart analysis of Bitcoin (BTC), the price penetrated zones such as 1 and 1/3, absorbed sellers' liquidity, and then turned bullish. In such conditions, the trend is considered bullish until the price reaches the opposite ADR level.

Bearish Move
The30-minute chart analysis of the USD/CHF pair demonstrates the performance of the ICT ADR Levels and Zones Indicator. As shown, the price moved toward higher ADR levels and, after absorbing buyers' liquidity in those areas, reversed direction.

Conclusion
TheICT ADR Levels and Zones Indicator is a practical tool for analyzing daily market volatility. By displaying the 1/3, 1/2, and full ADR zones, this trading tool helps identify potential reversal points and price targets.
ICT ADR Levels & Zones MT4 PDF
ICT ADR Levels & Zones MT4 PDF
Click to download ICT ADR Levels & Zones MT4 PDFDoes this Indicator provide entry and exit signals?
No, the ADR Levels Indicator in ICT style does not issue trade entry signals.
Can this Indicator be used on higher timeframes?
Yes, the ICT ADR Levels and Zones Indicator is multi-timeframe and can be used across all timeframes.


