![Inverse Fisher Transform of RSI Indicator MT4 Download – Free – [TFlab]](https://cdn.tradingfinder.com/image/279539/13-88-en-inverse-fisher-transform-of-rsi-mt4-01.webp)
![Inverse Fisher Transform of RSI Indicator MT4 Download – Free – [TFlab] 0](https://cdn.tradingfinder.com/image/279539/13-88-en-inverse-fisher-transform-of-rsi-mt4-01.webp)
![Inverse Fisher Transform of RSI Indicator MT4 Download – Free – [TFlab] 1](https://cdn.tradingfinder.com/image/279536/13-88-en-inverse-fisher-transform-of-rsi-mt4-02.webp)
![Inverse Fisher Transform of RSI Indicator MT4 Download – Free – [TFlab] 2](https://cdn.tradingfinder.com/image/279538/13-88-en-inverse-fisher-transform-of-rsi-mt4-03.webp)
![Inverse Fisher Transform of RSI Indicator MT4 Download – Free – [TFlab] 3](https://cdn.tradingfinder.com/image/279537/13-88-en-inverse-fisher-transform-of-rsi-mt4-04.webp)
The Inverse Fisher Transform of RSI Indicator applies it to RSI values, making it useful for identifying trend reversals.
This oscillator in MT4 determines entry zones for trades based on overbought and oversold levels, defined by the position of the oscillator line relative to preset values.
Inverse Fisher Transform of RSI Indicator Table
The following table outlines the specifications and features of the Inverse Fisher Transform of RSI Oscillator.
Indicator Categories: | Oscillators MT4 Indicators Signal & Forecast MT4 Indicators Trading Assist MT4 Indicators RSI Indicators for MetaTrader 4 |
Platforms: | MetaTrader 4 Indicators |
Trading Skills: | Elementary |
Indicator Types: | Leading MT4 Indicators Reversal MT4 Indicators |
Timeframe: | Multi-Timeframe MT4 Indicators |
Trading Style: | Day Trading MT4 Indicators Intraday MT4 Indicators Scalper MT4 Indicators |
Trading Instruments: | Indices Market MT4 Indicators Cryptocurrency MT4 Indicators Forex MT4 Indicators |
Indicator Overview
The Inverse Fisher Transform of the RSI indicator is an advanced tool for traders identifying overbought and oversold zones on price charts. This indicator, designed by combining the Fisher and RSI indicators, provides a more precise analysis and helps identify price reversal areas.
When the price reaches the overbought zone, the indicator displays this condition in orange. In this case, traders can enter sell trades or exit buy positions.
The condition is displayed in green when the price enters the oversold zone. After the price exits this zone, traders can enter buy trades or exit sell positions.
This indicator is effective and reliable for identifying critical price reversal points and improving trading decision-making.
Buy Trades
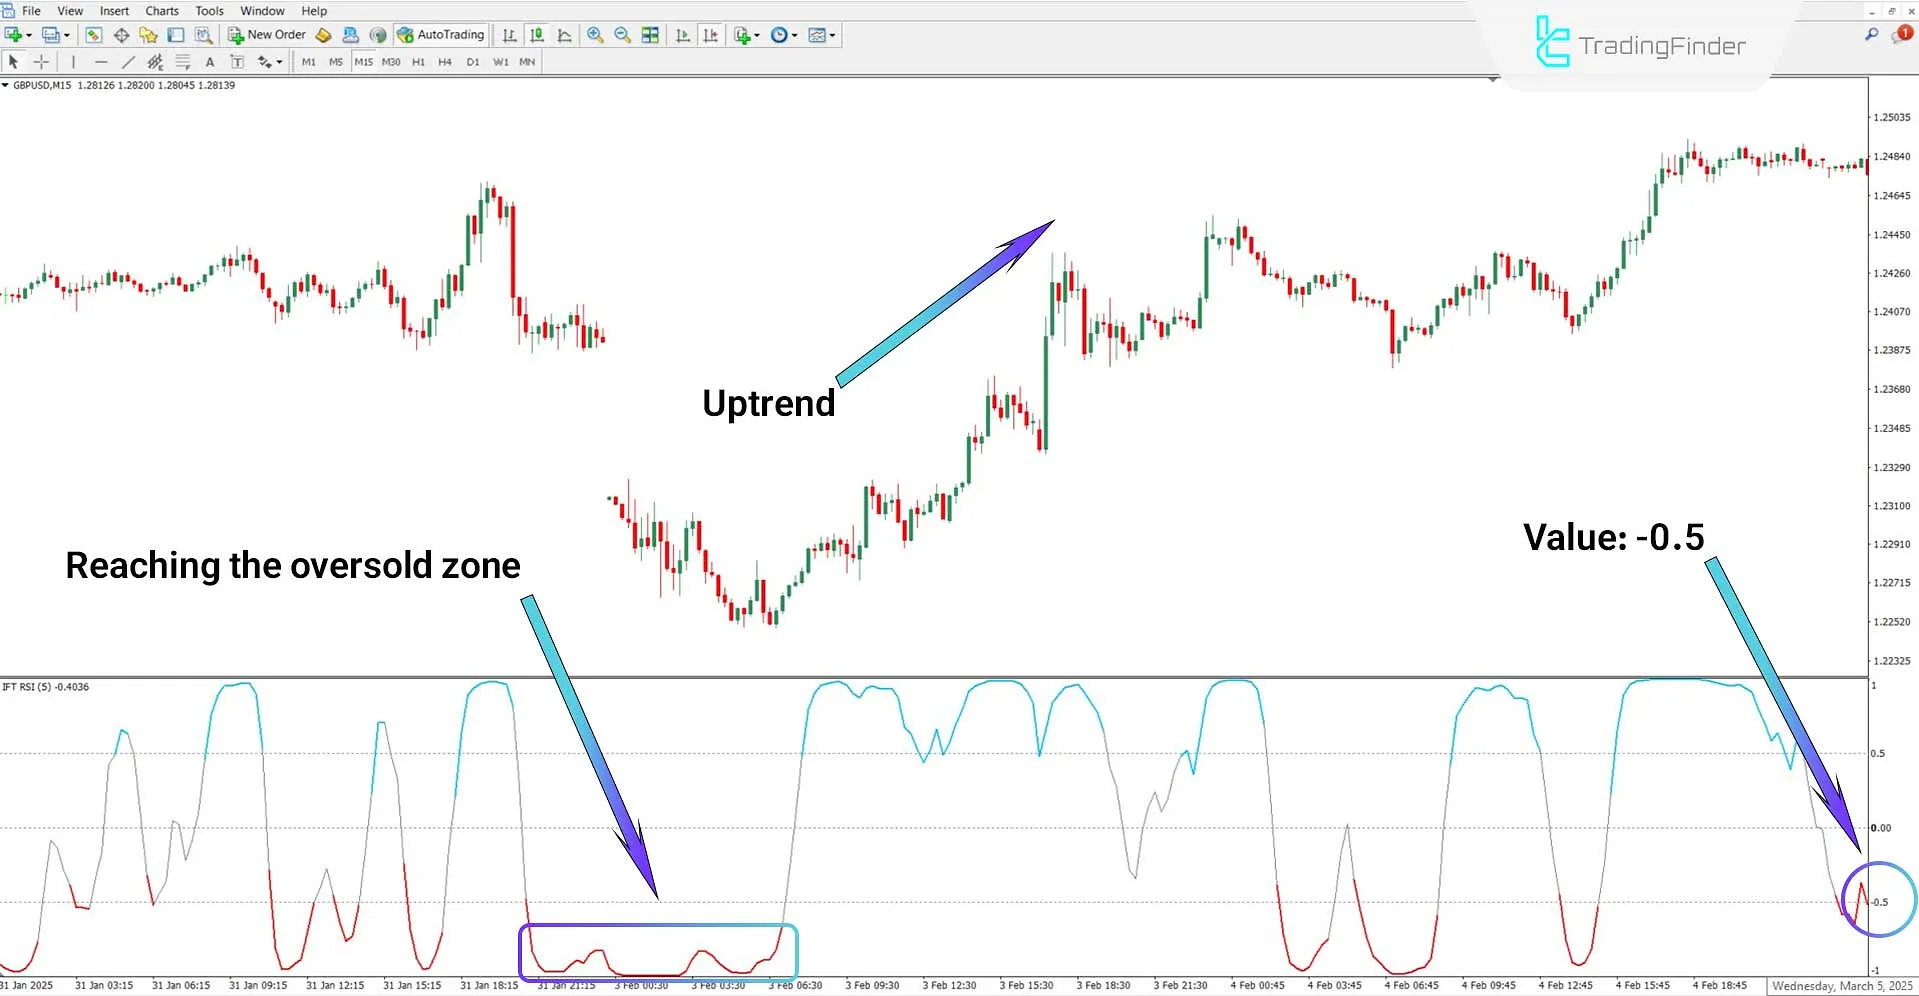
Based on the 15-minute chart analysis of the GBP/USD currency pair, the oscillator line fluctuates around -0.5, indicating an oversold condition.
As a result, the indicator plots the signal line in red. Exiting the oversold zone serves as a buy signal.

Sell Trades
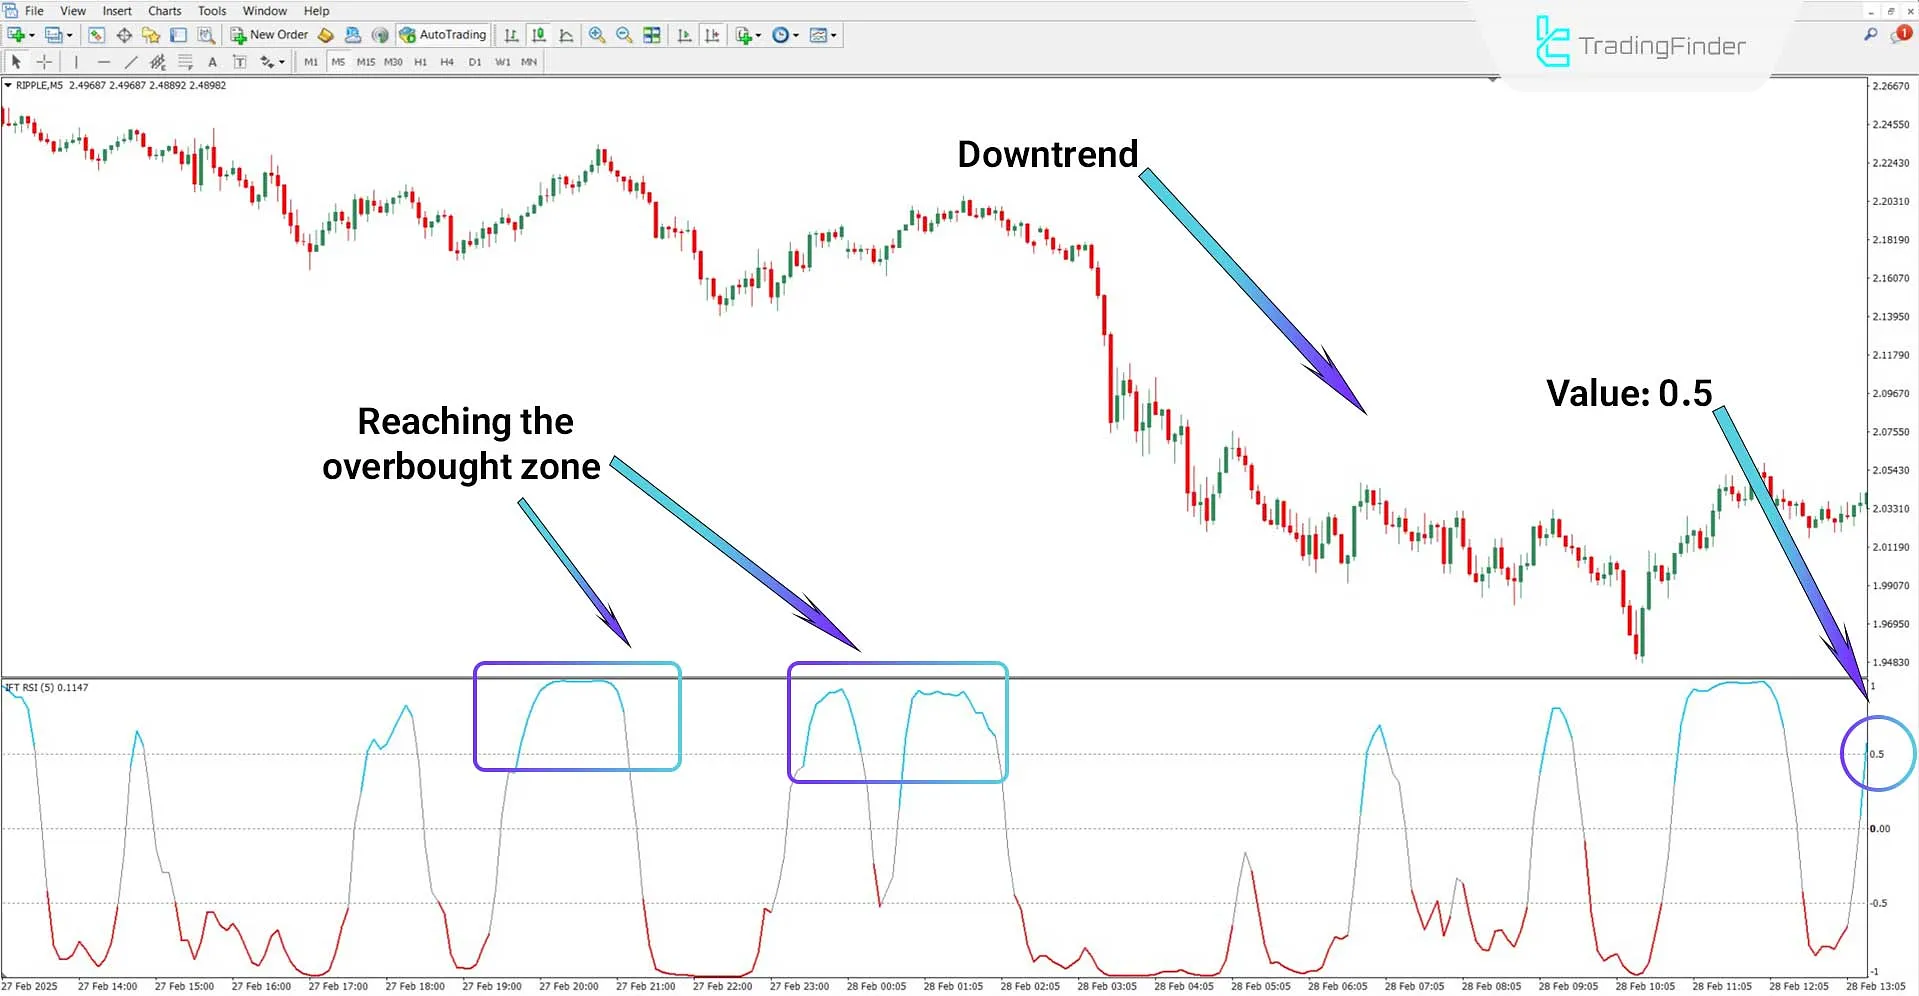
According to the 5-minute chart of Ripple (XRP), price fluctuations above +0.5 indicate an overbought condition. Under these circumstances, the oscillator line turns light blue.
Exiting this zone (when the line drops below +0.5) is considered a sell signal.

Settings of the Inverse Fisher Transform of RSI Indicator
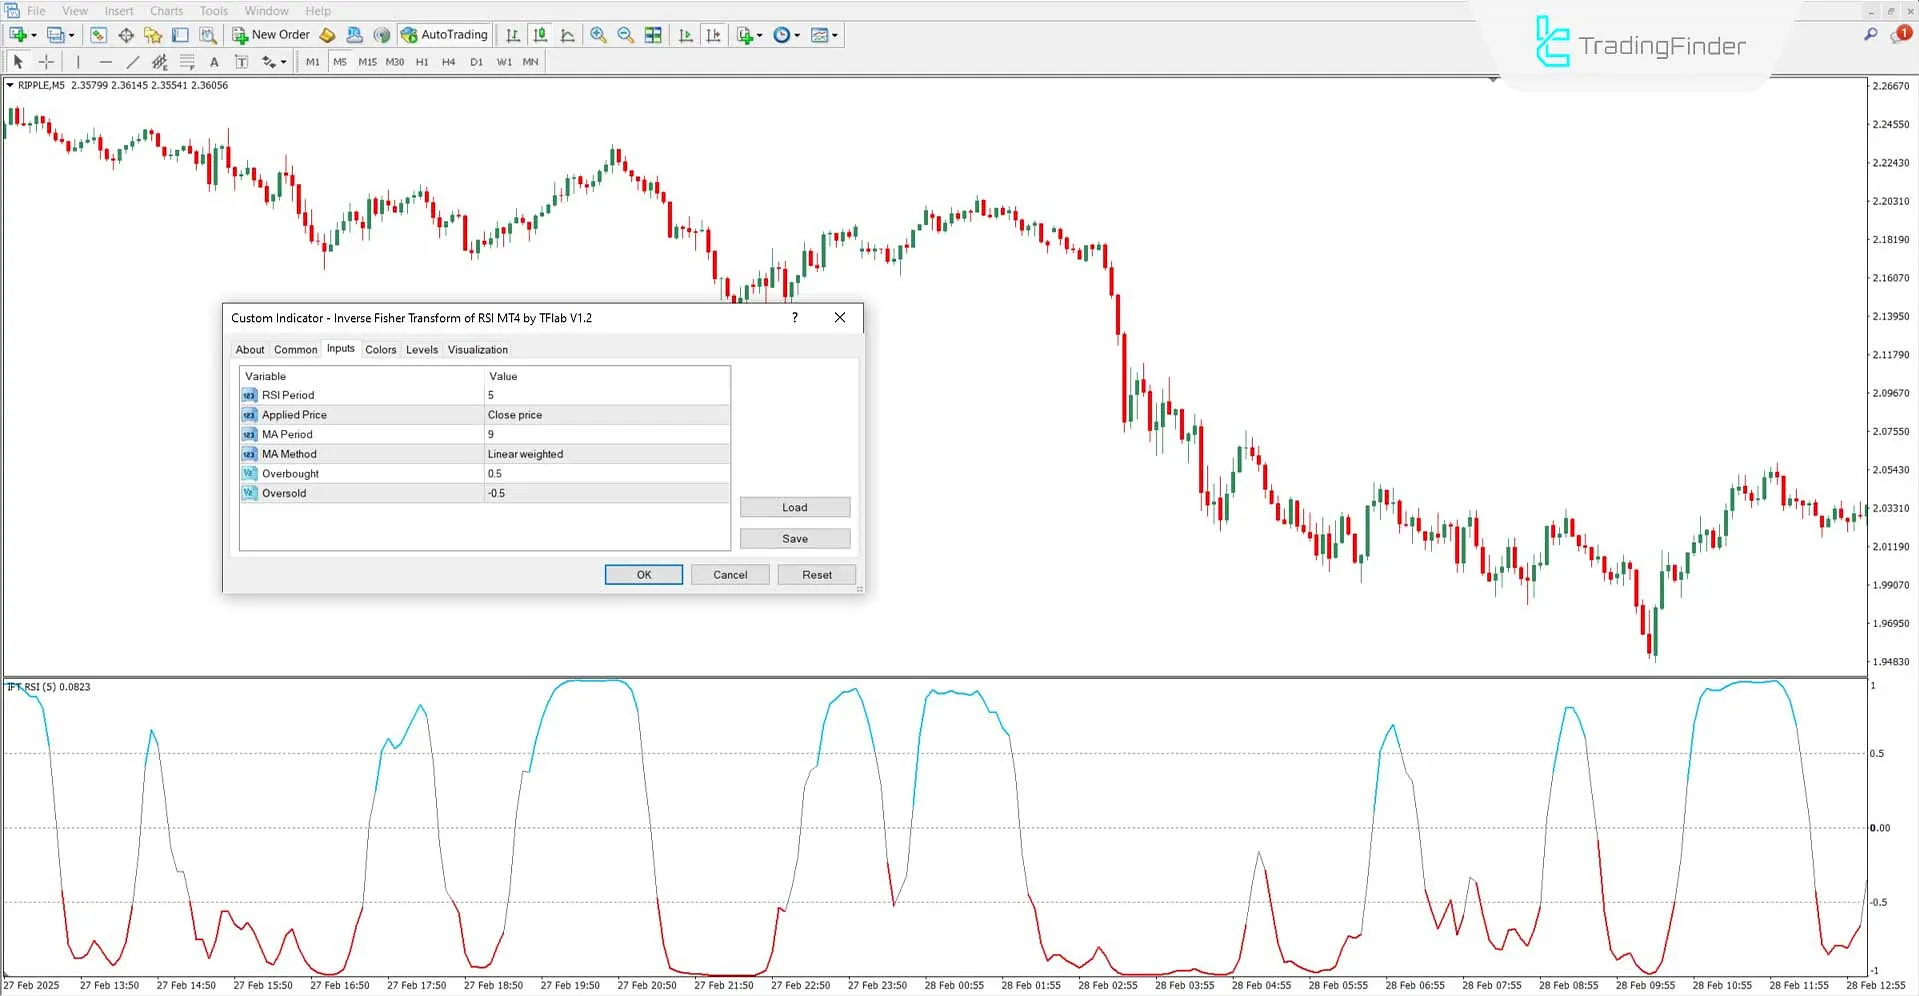
The image below represents the settings panel for the Inverse Fisher Transform of RSI Indicator:

- RSI Period: Setting for calculating the RSI period
- Applied Price: Selection of the RSI calculation method
- MA Period: Setting the moving average period
- MA Method: Choosing the moving average calculation method
- Overbought Level: Setting the overbought threshold
- Oversold Level: Setting the oversold threshold
Conclusion
The Inverse Fisher Transform of RSI Indicator is a MT4 signal and forecast indicator, generating trade entry and exit signals based on overbought and oversold levels.
By analyzing the position of the indicator line relative to predefined levels, traders can identify trend reversals. Additionally, the flexible settings allow customization to fit various technical analysis styles.
Inverse Fisher Transform RSI MT4 PDF
Inverse Fisher Transform RSI MT4 PDF
Click to download Inverse Fisher Transform RSI MT4 PDFWhat is the Inverse Fisher Transform of RSI Indicator?
This indicator combines the RSI oscillator with the Fisher Transform, providing more accurate market condition analysis and helping identify price reversal points.
Which markets is this indicator suitable for?
The Inverse Fisher Transform of RSI Indicator can be used without limitations in all financial markets, including Forex, cryptocurrencies, and indices.


