![KAGI 1 Indicator for MetaTrader 4 – Free – [TradingFinder]](https://cdn.tradingfinder.com/image/426018/2-77-en-kagi-1-mt4-1.webp)
![KAGI 1 Indicator for MetaTrader 4 – Free – [TradingFinder] 0](https://cdn.tradingfinder.com/image/426018/2-77-en-kagi-1-mt4-1.webp)
![KAGI 1 Indicator for MetaTrader 4 – Free – [TradingFinder] 1](https://cdn.tradingfinder.com/image/426019/2-77-en-kagi-1-mt4-2.webp)
![KAGI 1 Indicator for MetaTrader 4 – Free – [TradingFinder] 2](https://cdn.tradingfinder.com/image/426033/2-77-en-kagi-1-mt4-3.webp)
![KAGI 1 Indicator for MetaTrader 4 – Free – [TradingFinder] 3](https://cdn.tradingfinder.com/image/426036/2-77-en-kagi-1-mt4-4.webp)
The KAGI 1 Indicator is designed based on the Kagi Chart structure and operates on the MetaTrader 4 platform, presenting a non-time-based chart.
Unlike traditional charts, the Kagi chart changes shape only when the price moves by a specific amount. This trading tool accurately identifies significant trends, price reversals, and optimal entry and exit points.
KAGI 1 Indicator Table
The general specifications of the KAGI 1 Indicator are provided in the table below.
Indicator Categories: | Price Action MT4 Indicators Oscillators MT4 Indicators Currency Strength MT4 Indicators |
Platforms: | MetaTrader 4 Indicators |
Trading Skills: | Intermediate |
Indicator Types: | Reversal MT4 Indicators |
Timeframe: | Multi-Timeframe MT4 Indicators |
Trading Style: | Intraday MT4 Indicators |
Trading Instruments: | Stock Market MT4 Indicators Cryptocurrency MT4 Indicators Forex MT4 Indicators |
Indicator Overview
The KAGI 1 Indicator utilizes a colored line to represent changes in market trends on the chart.
Dark blue indicates buyer dominance and an uptrend, while light blue reflects seller strength and a downtrend. These color shifts define the direction and momentum of the price movement.
Uptrend Condition
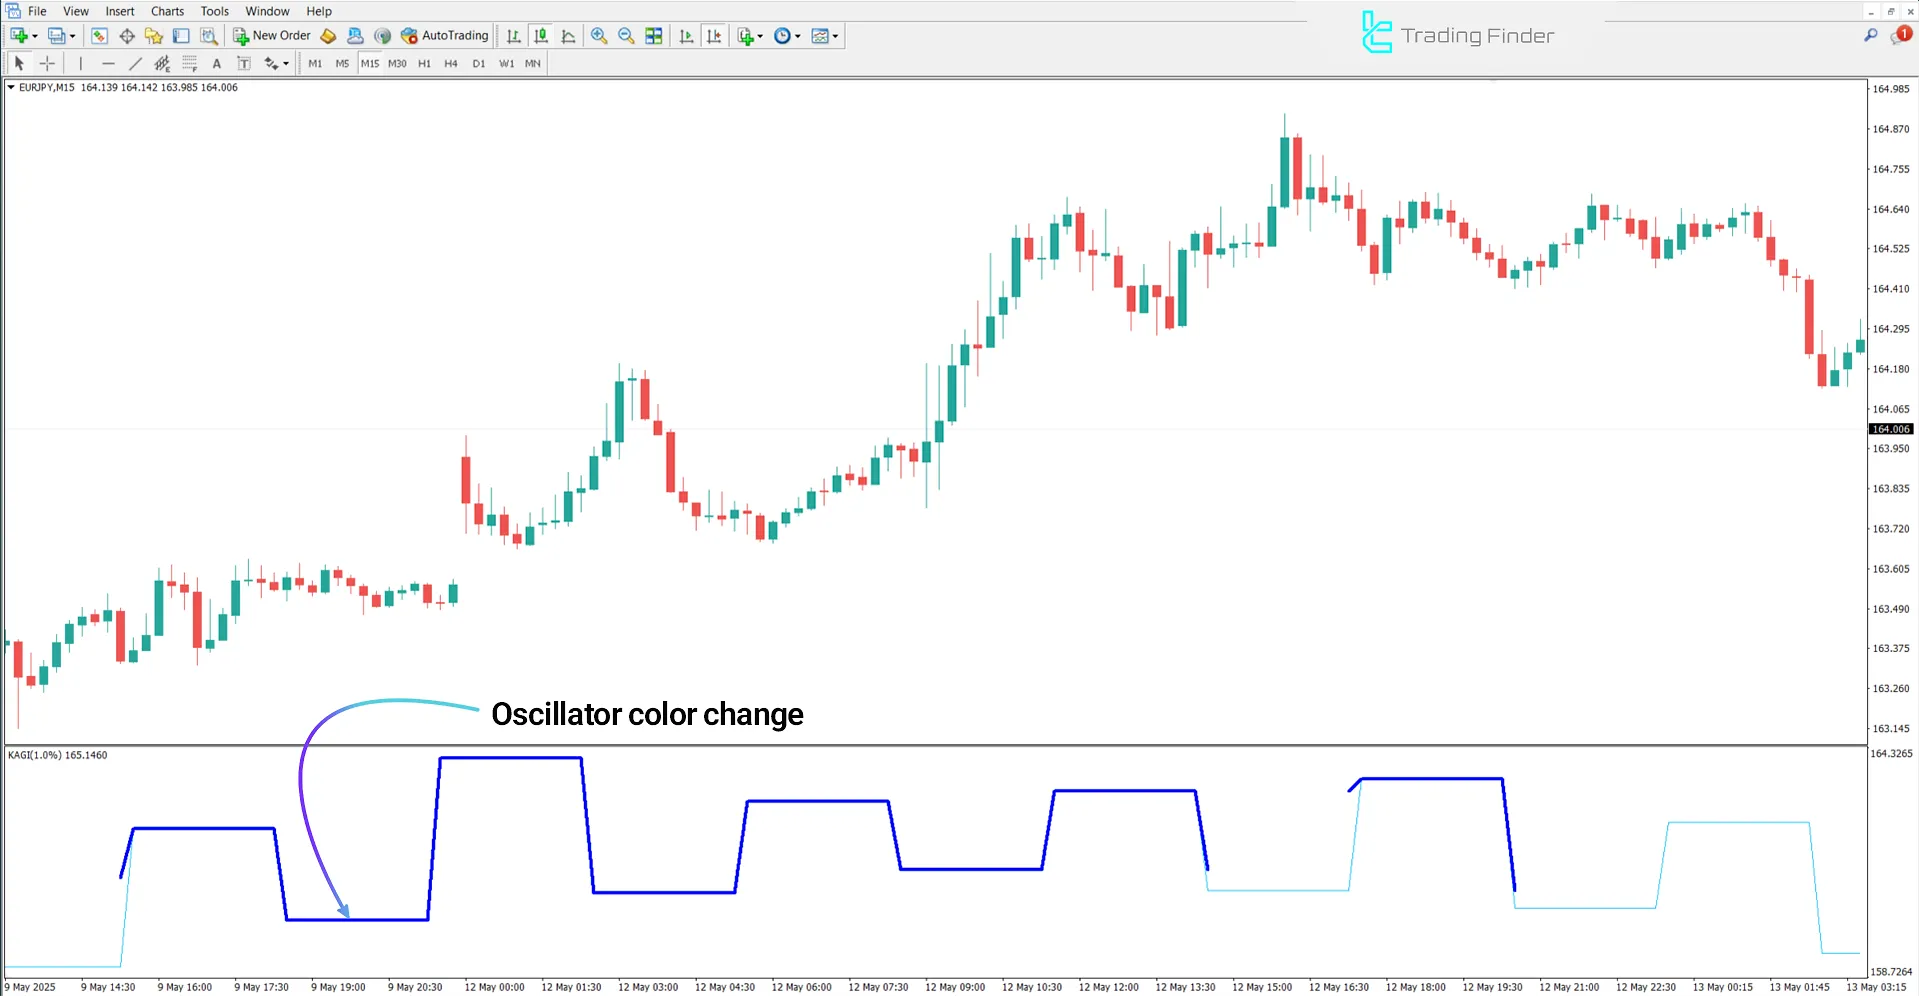
On the 15-minute chart of the EUR/JPY pair, the KAGI 1 line changes from light blue to dark blue, indicating a trend direction reversal.
This change may signal a strengthening bullish trend and provide a suitable entry opportunity for buying.

Downtrend Condition
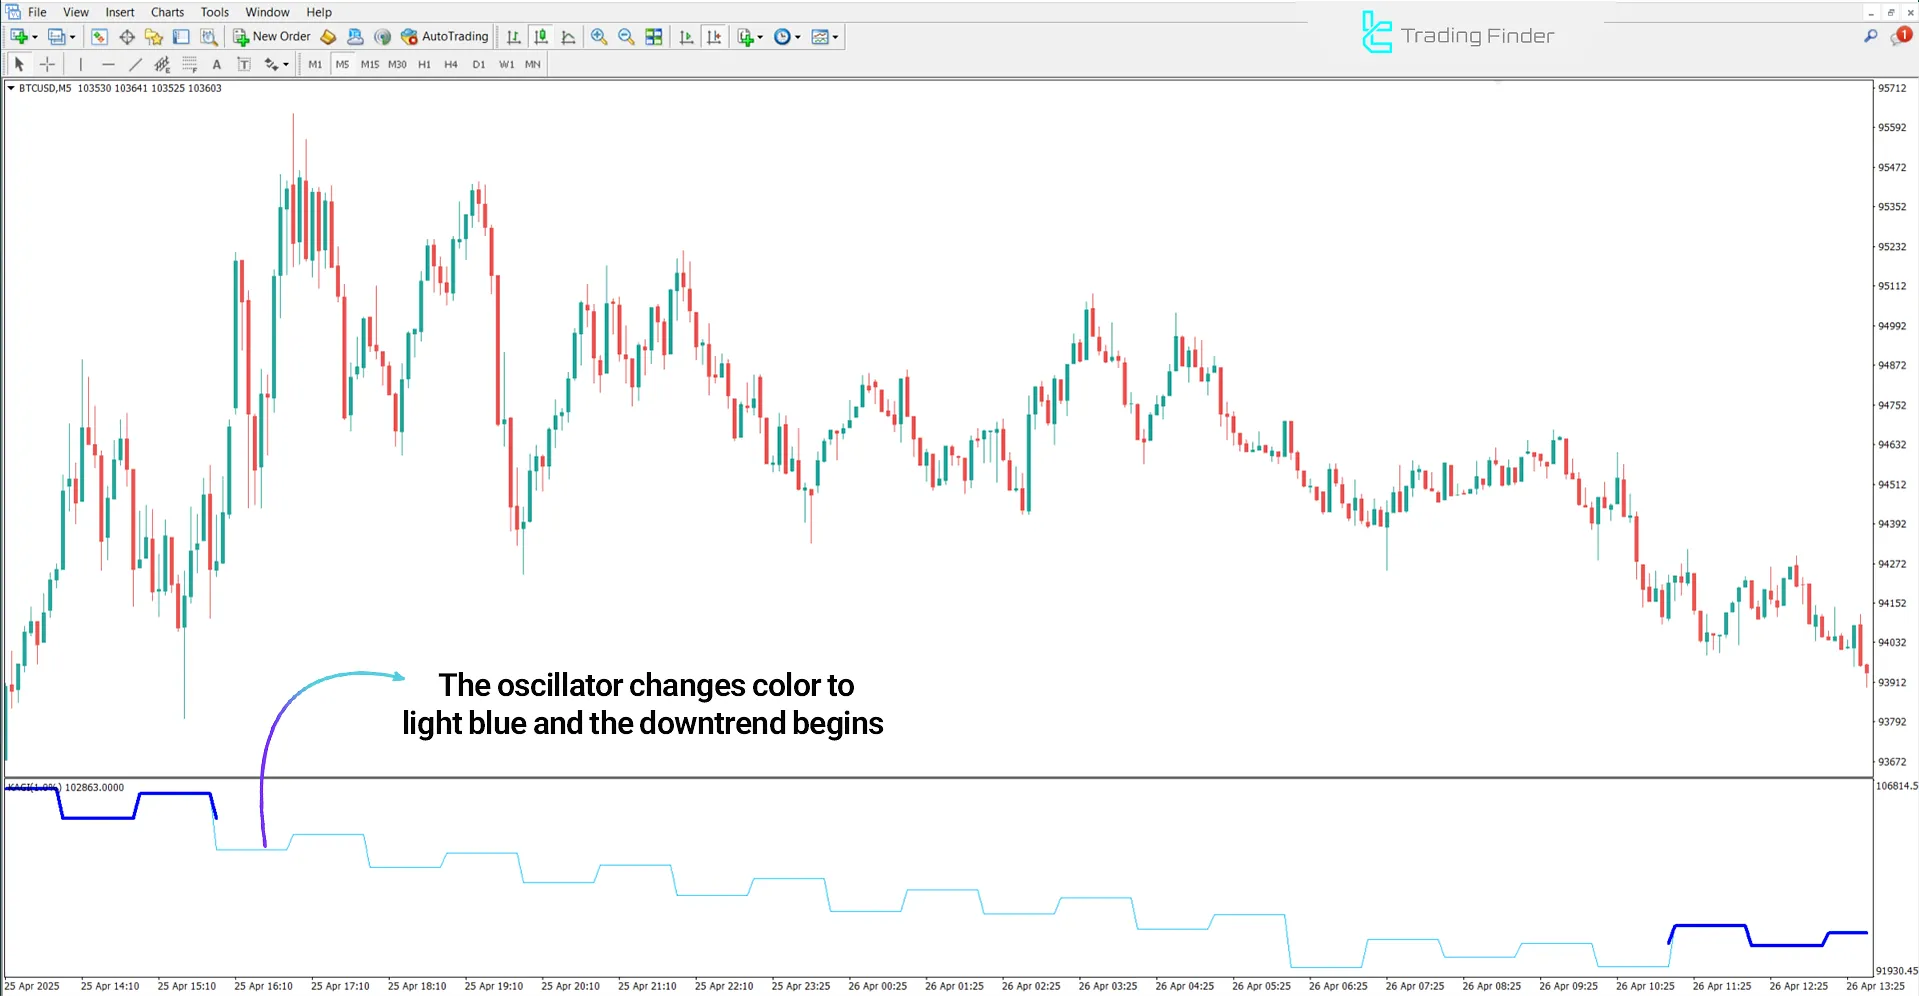
The chart below illustrates the Bitcoin Index (BTC/USD) in a 5-minute timeframe. The indicator line changes from dark blue to light blue while the oscillator simultaneously forms a lower low, aligning with the price trend.
This behavior signals a strengthening bearish trend, offering an optimal sell opportunity.

KAGI 1 Indicator Settings
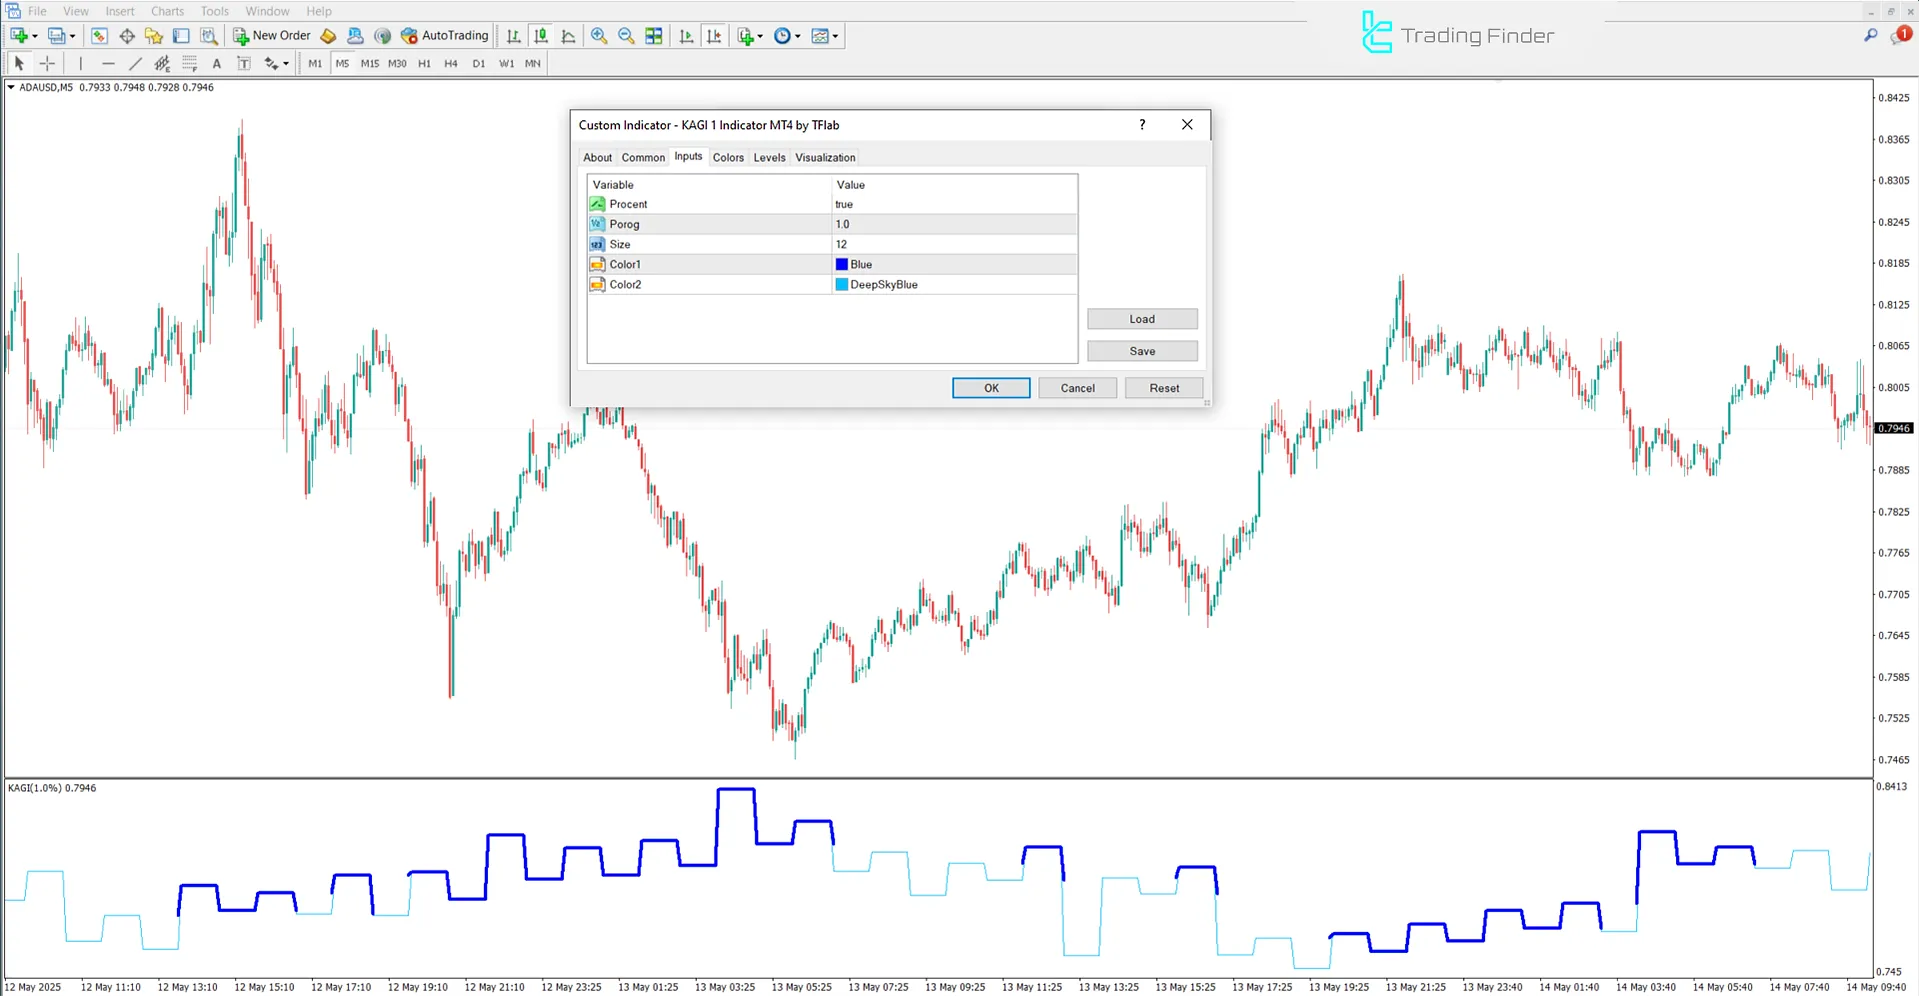
The settings panel of the KAGI 1 Indicator is shown in the image below:

- Percent: Percentage of change;
- Porog: Change threshold;
- Size: Size;
- Color1: Uptrend color;
- Color 2: Downtrend color.
Conclusion
The KAGI 1 Indicator on MetaTrader 4 provides a visual tool for trend analysis and market reversal identification through color changes.
In this technical analysis oscillator, dark blue indicates an uptrend, and light blue represents a downtrend.
This clear color differentiation offers a valuable perspective for identifying the market direction and entry zones for both buy and sell trades.
KAGI 1 MT4 PDF
KAGI 1 MT4 PDF
Click to download KAGI 1 MT4 PDFWhat is the KAGI 1 Indicator?
It is a technical analysis tool that monitors price changes regardless of the time frame.
In which markets can the KAGI 1 Indicator be used?
This indicator is applicable across all financial markets, including Forex, cryptocurrency, commodities, and stocks.


