![Kairi Indicator for MetaTrader 4 Download – Free – [TradingFinder]](https://cdn.tradingfinder.com/image/419764/13-138-en-kairi-mt4-01.webp)
![Kairi Indicator for MetaTrader 4 Download – Free – [TradingFinder] 0](https://cdn.tradingfinder.com/image/419764/13-138-en-kairi-mt4-01.webp)
![Kairi Indicator for MetaTrader 4 Download – Free – [TradingFinder] 1](https://cdn.tradingfinder.com/image/419762/13-138-en-kairi-mt4-02.webp)
![Kairi Indicator for MetaTrader 4 Download – Free – [TradingFinder] 2](https://cdn.tradingfinder.com/image/419765/13-138-en-kairi-mt4-03.webp)
![Kairi Indicator for MetaTrader 4 Download – Free – [TradingFinder] 3](https://cdn.tradingfinder.com/image/419763/13-138-en-kairi-mt4-04.webp)
The Kairi Indicator is designed to show market momentum in the MetaTrader 4 platform. This oscillator measures the deviation of the current price from the moving average (MA) and visualizes it with a blue oscillating line.
This trading tool is extremely easy to use, and traders can apply this indicator in various markets, including Forex, cryptocurrencies, stocks, and commodities.
Kairi Oscillator Specifications Table
The following table outlines the features of the Kairi Indicator:
Indicator Categories: | Oscillators MT4 Indicators Currency Strength MT4 Indicators Trading Assist MT4 Indicators |
Platforms: | MetaTrader 4 Indicators |
Trading Skills: | Elementary |
Indicator Types: | Trend MT4 Indicators Reversal MT4 Indicators |
Timeframe: | Multi-Timeframe MT4 Indicators |
Trading Style: | Day Trading MT4 Indicators Scalper MT4 Indicators Swing Trading MT4 Indicators |
Trading Instruments: | Share Stocks MT4 Indicators Indices Market MT4 Indicators Commodity Market MT4 Indicators Stock Market MT4 Indicators Cryptocurrency MT4 Indicators Forex MT4 Indicators |
Kairi Indicator at a Glance
In the Kairi Oscillator, increasing momentum values signal overbought conditions, while decreasing momentum values indicate oversold conditions.
This indicator helps identify potential trend reversal zones that traders can act upon.
Buy Signal
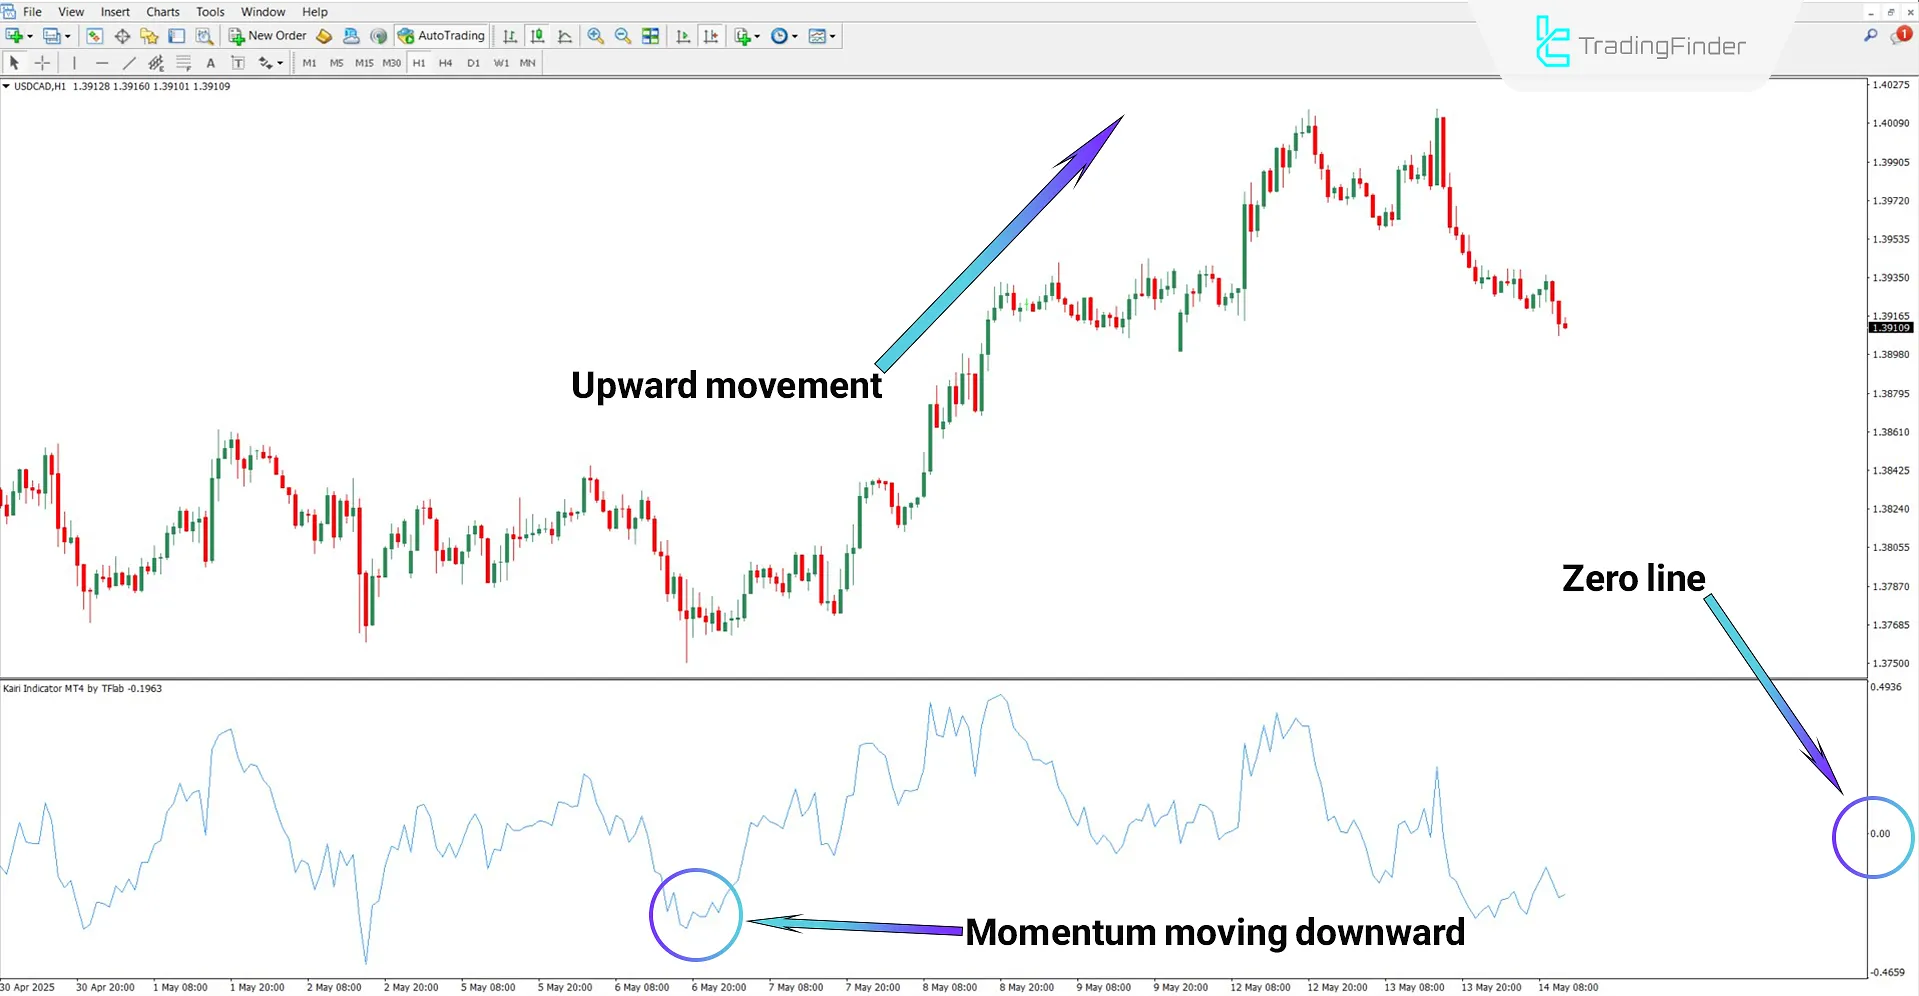
According to the 1-hour timeframe chart of the USD/CAD currency pair, a decline in momentum values falling below the zero line reflects an oversold zone.
In such scenarios, there is a high probability of market reversal from these levels.

Sell Signal
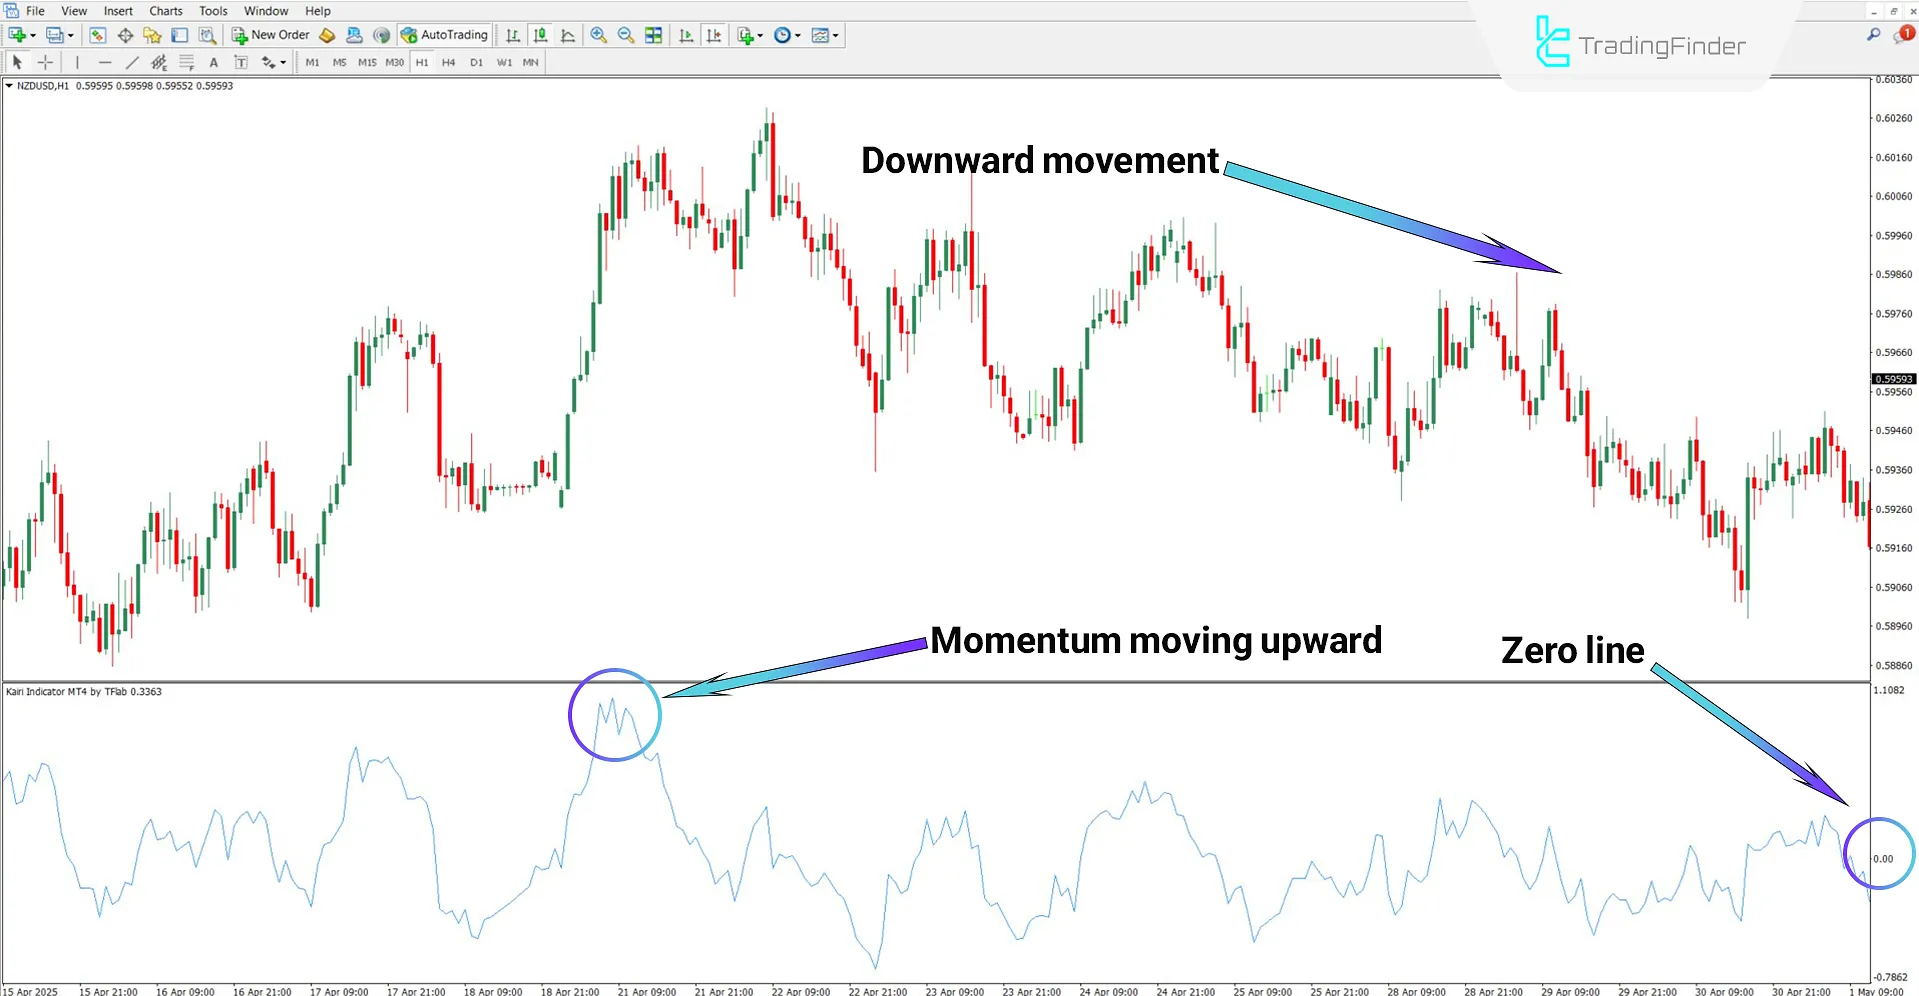
Based on the analysis of the NZD/USD currency pair chart, momentum values have significantly increased and are located above the zero line.
In this situation, the likelihood of a trend reversal is high, and traders can open short positions in line with their trading strategies.

Kairi Oscillator Settings
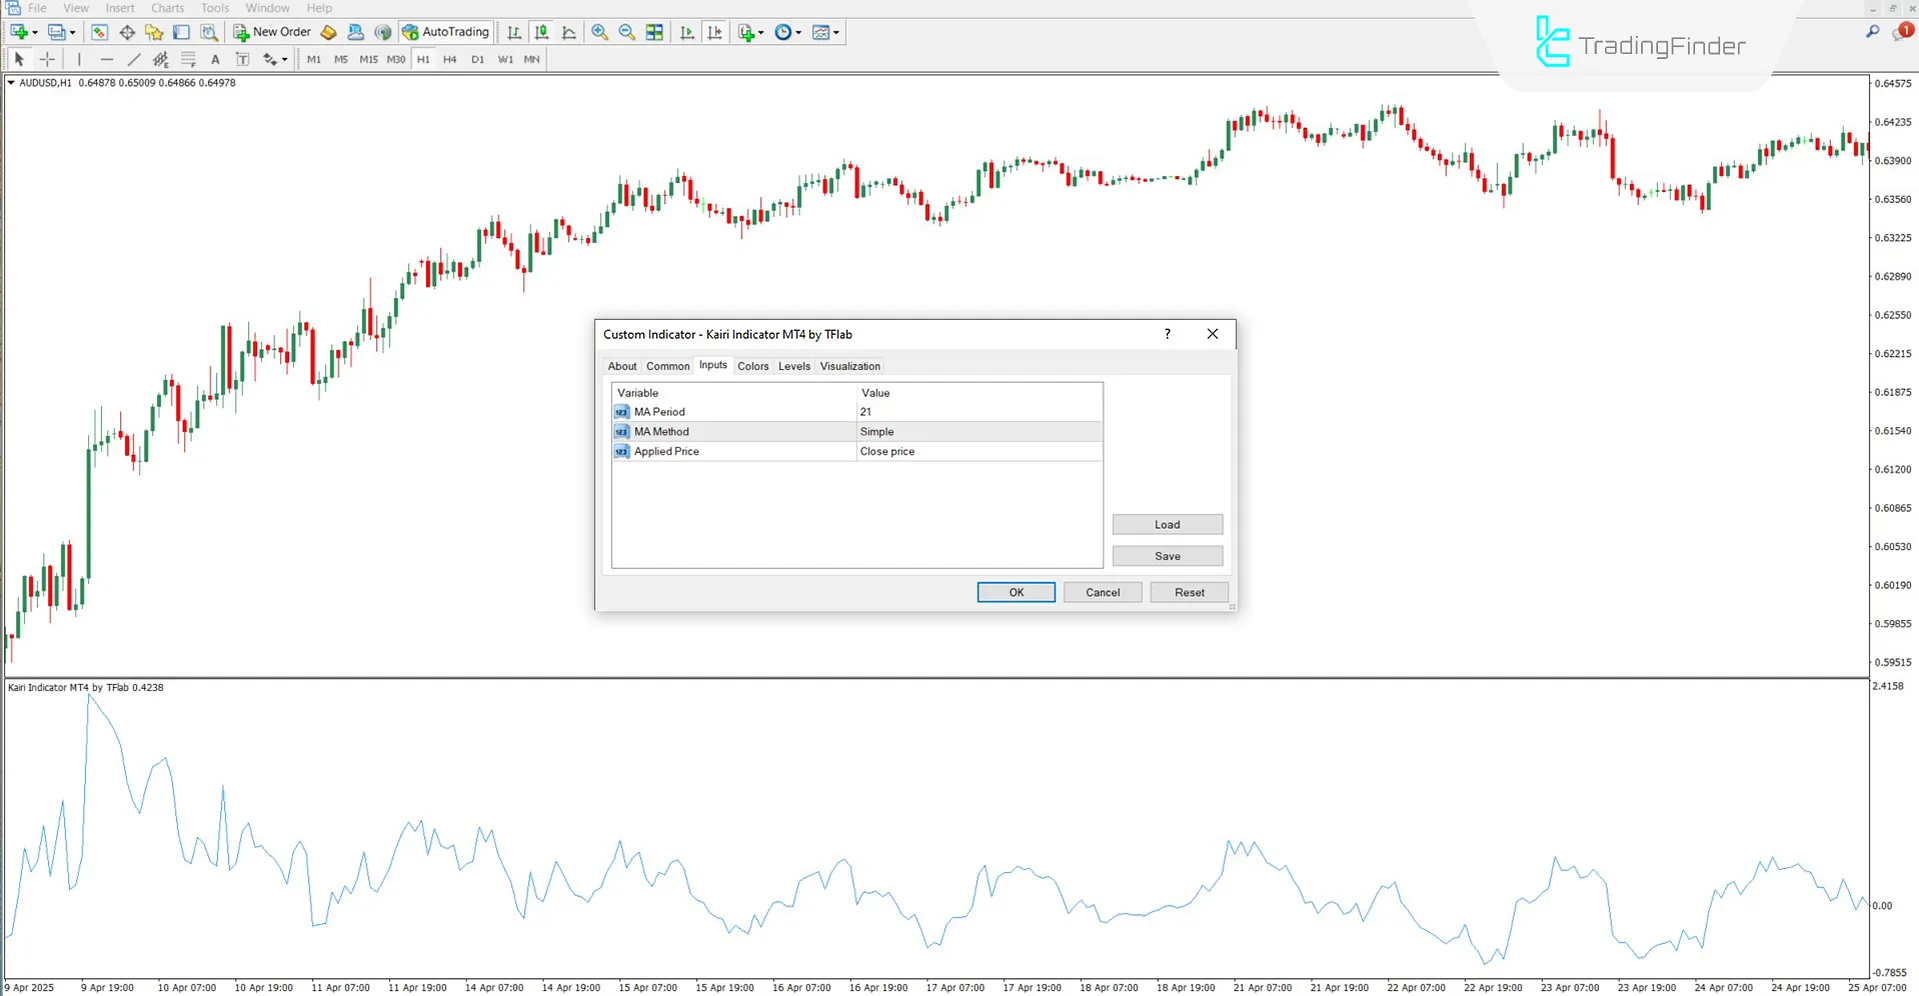
The adjustable settings in the Kairi Indicator are as follows:

- MA Period: Defines the period used for moving average calculations
- MA Method: Specifies the type of moving average
- Applied Price: Select the price type used for the indicator’s calculations
Conclusion
The Kairi Indicator, through its oscillating line, provides traders with overbought and oversoldareas.
Trading signals are generated based on the position of the oscillating line relative to the midline (zero line). Being a multi-timeframe oscillator, users can apply it across all timeframes.
What is the function of the Kairi Oscillator?
It displays market momentum and highlights overbought and oversold zones.
Can the Kairi Indicator be used in cryptocurrency markets?
Yes, this indicator can be used across all markets, including cryptocurrencies, stocks, and Forex pairs.


