![KDJ Indicator for MetaTrader 4 Download - Free - [TradingFinder]](https://cdn.tradingfinder.com/image/170501/4-29-en-kdj-indicator-mt4-1.webp)
![KDJ Indicator for MetaTrader 4 Download - Free - [TradingFinder] 0](https://cdn.tradingfinder.com/image/170501/4-29-en-kdj-indicator-mt4-1.webp)
![KDJ Indicator for MetaTrader 4 Download - Free - [TradingFinder] 1](https://cdn.tradingfinder.com/image/170470/4-29-en-kdj-indicator-mt4-2.webp)
![KDJ Indicator for MetaTrader 4 Download - Free - [TradingFinder] 2](https://cdn.tradingfinder.com/image/170476/4-29-en-kdj-indicator-mt4-3.webp)
![KDJ Indicator for MetaTrader 4 Download - Free - [TradingFinder] 3](https://cdn.tradingfinder.com/image/170469/4-29-en-kdj-indicator-mt4-4.webp)
The KDJ indicator is an advanced and optimized version of the Stochastic Oscillator. Adding the J line to the K and D lines provides a more accurate analysis of price movements.
The main purpose of this indicator is to identify overbought and oversold conditions and determine price reversal points, enabling traders to easily recognize entry and exit points.
KDJ Indicator Specifications
Indicator Categories: | Price Action MT4 Indicators Oscillators MT4 Indicators Currency Strength MT4 Indicators |
Platforms: | MetaTrader 4 Indicators |
Trading Skills: | Intermediate |
Indicator Types: | Trend MT4 Indicators Reversal MT4 Indicators |
Timeframe: | Multi-Timeframe MT4 Indicators |
Trading Style: | Day Trading MT4 Indicators |
Trading Instruments: | Share Stocks MT4 Indicators Forward Market MT4 Indicators Stock Market MT4 Indicators Cryptocurrency MT4 Indicators Forex MT4 Indicators |
Overview of the Indicator
The KDJ indicator consists of three main lines: K, D, and J, each with specific roles. The K and D lines are similar to those of the Stochastic Oscillator and are calculated based on price movements over a specific time period.
The J line, which is the key distinction of KDJ compared to the Stochastic Oscillator, displays the variations and differences between the K and D lines. This line is displayed in green in the oscillator window.
Bullish Trend in the Indicator
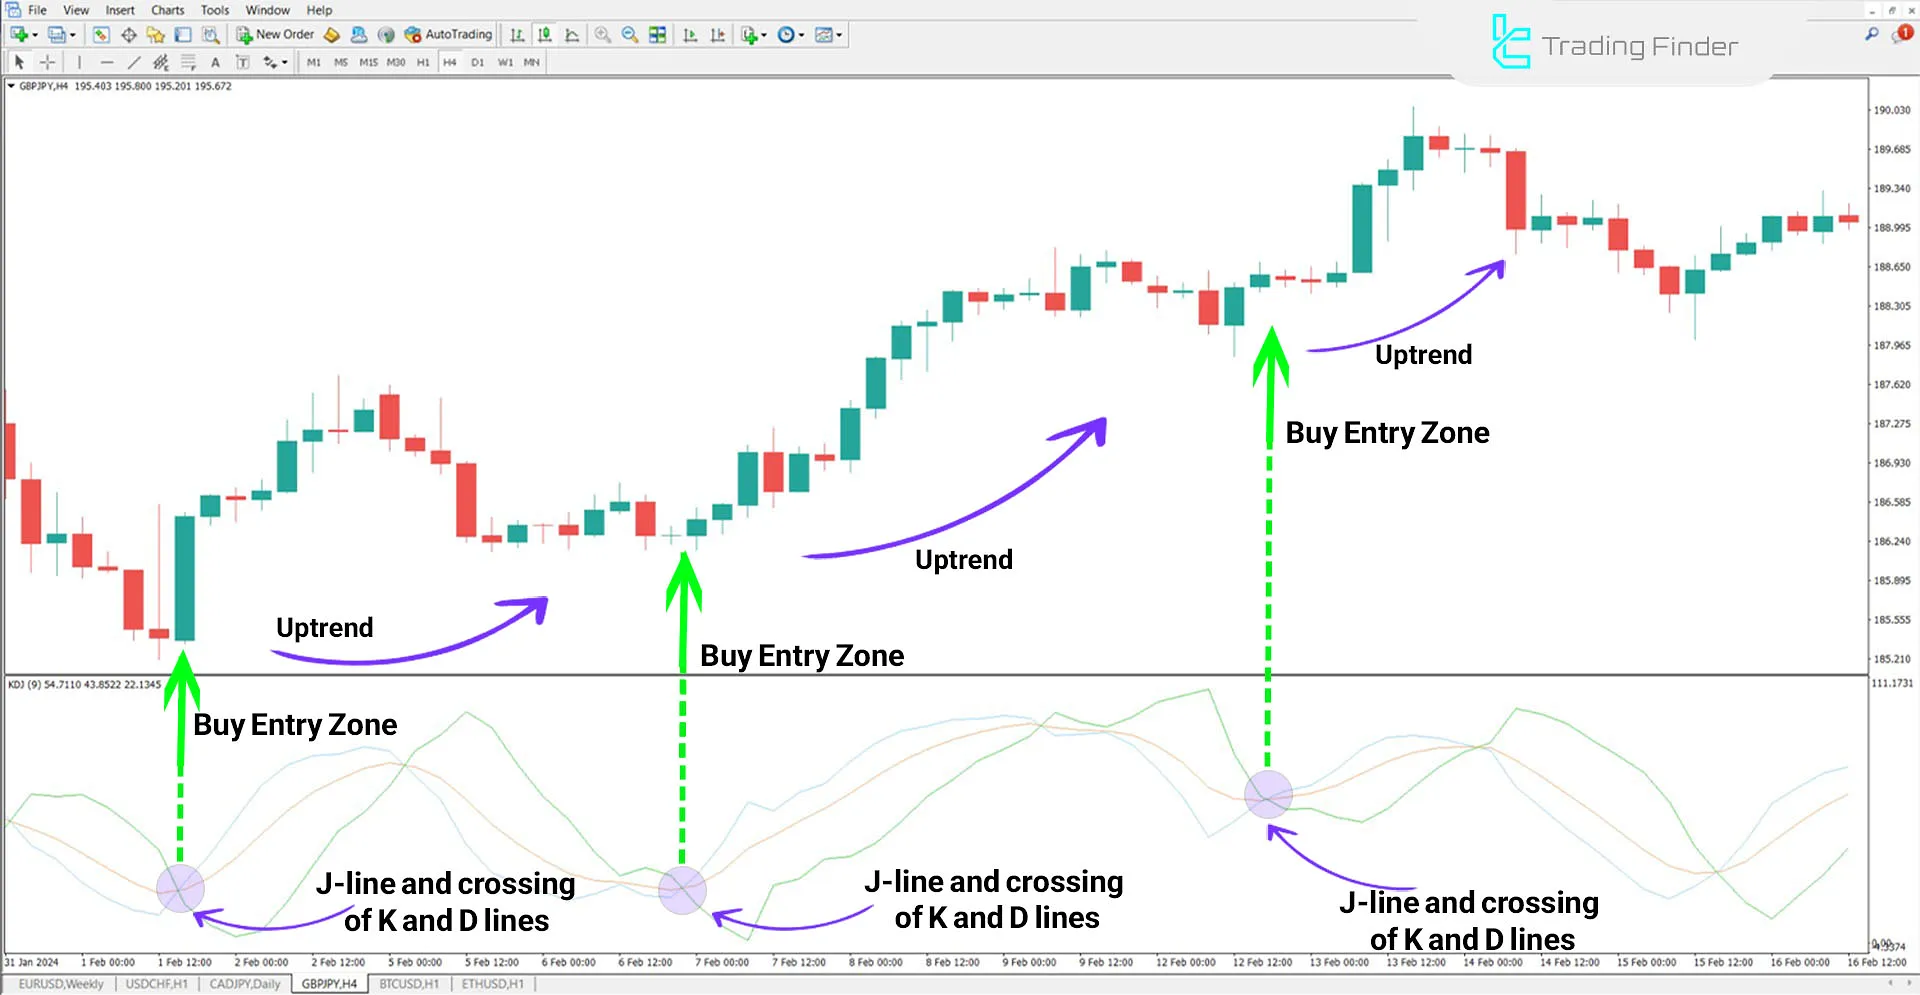
The price chart of the GBP/JPY currency pair in a 4-hour timeframe is shown. When the J line (green) crosses below the K and D lines, it indicates oversold conditions in the market.
This scenario may suggest a potential trend reversal from bearish to bullish. Traders can use the KDJ indicator and confirmation signals from the price chart to enter a Buy trade.

Bearish Trend in the Indicator
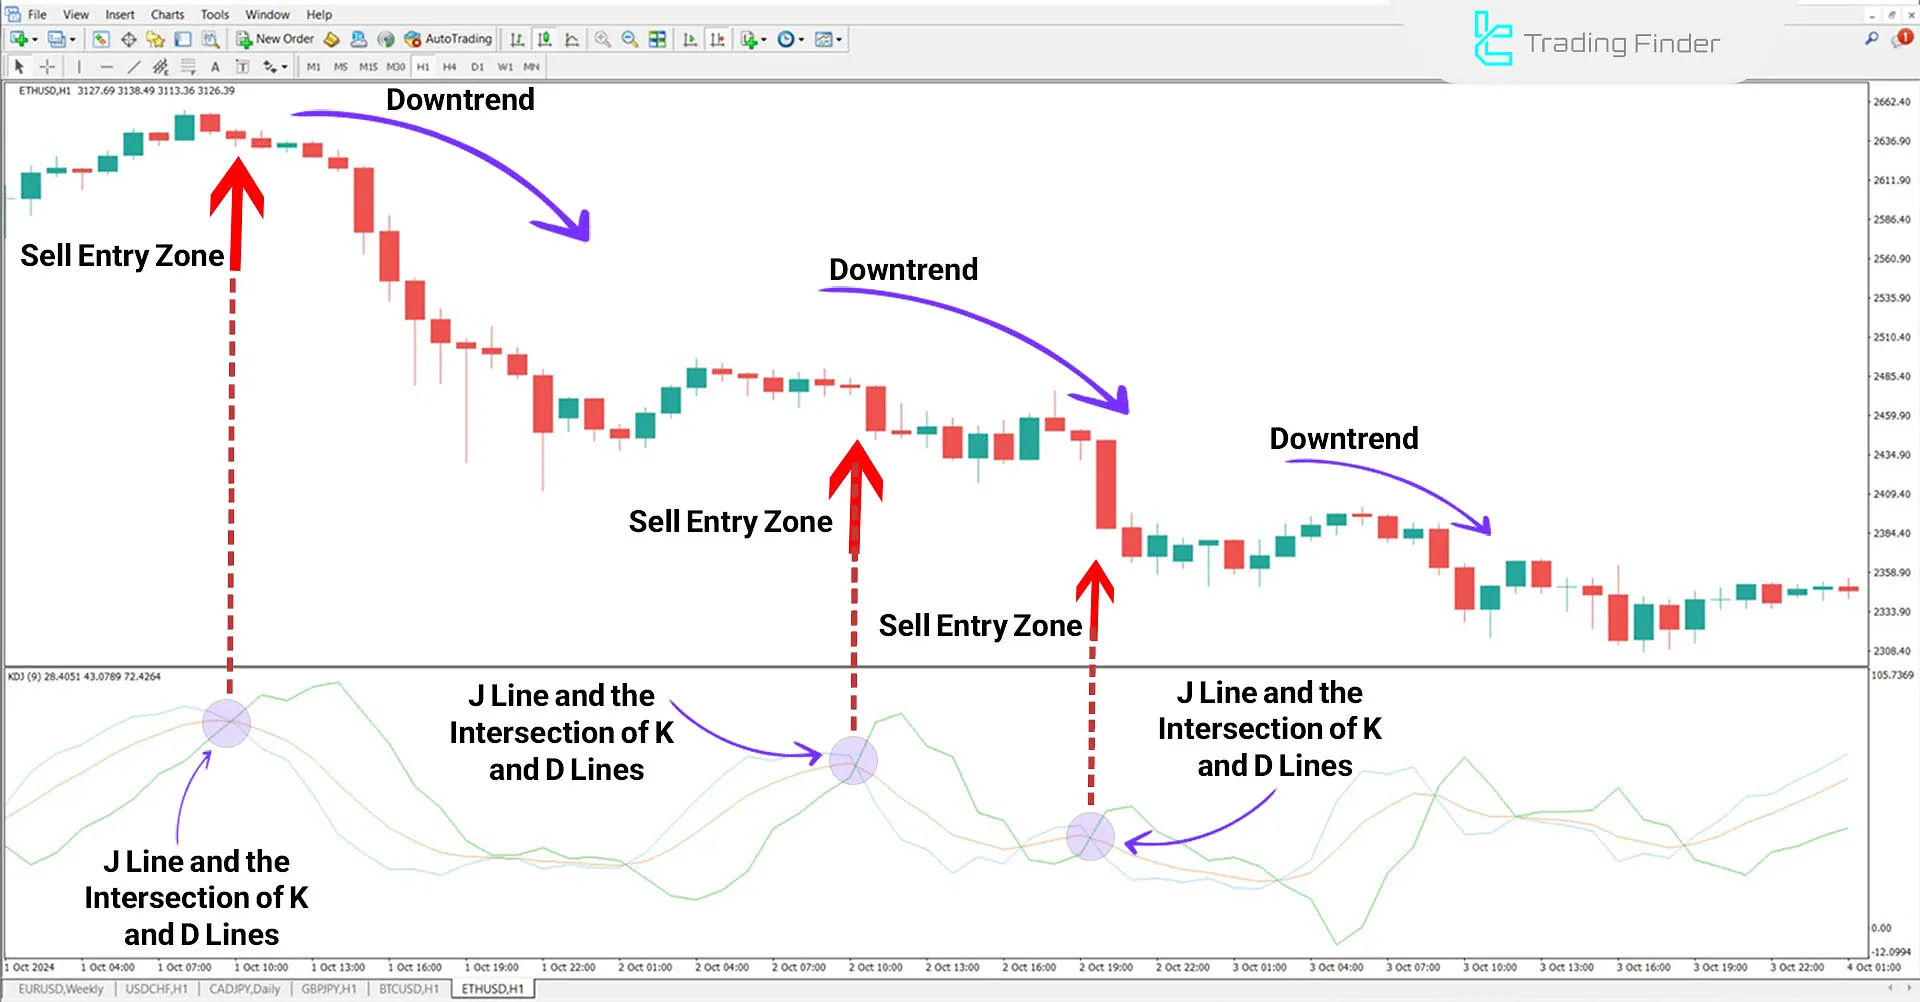
In the Ethereum (ETH) cryptocurrency chart on a 1-hour timeframe, the KDJ indicator clearly shows the market's trend change from bullish to bearish as the J line breaks above the K and D lines.
The movement of the J line above the K and D lines signifies a decline in buyer strength and the beginning of a bearish trend. Traders can enter Sell trades after observing this crossover and receiving the necessary confirmations from other MetaTrader 4 indicators.

KDJ Indicator Settings

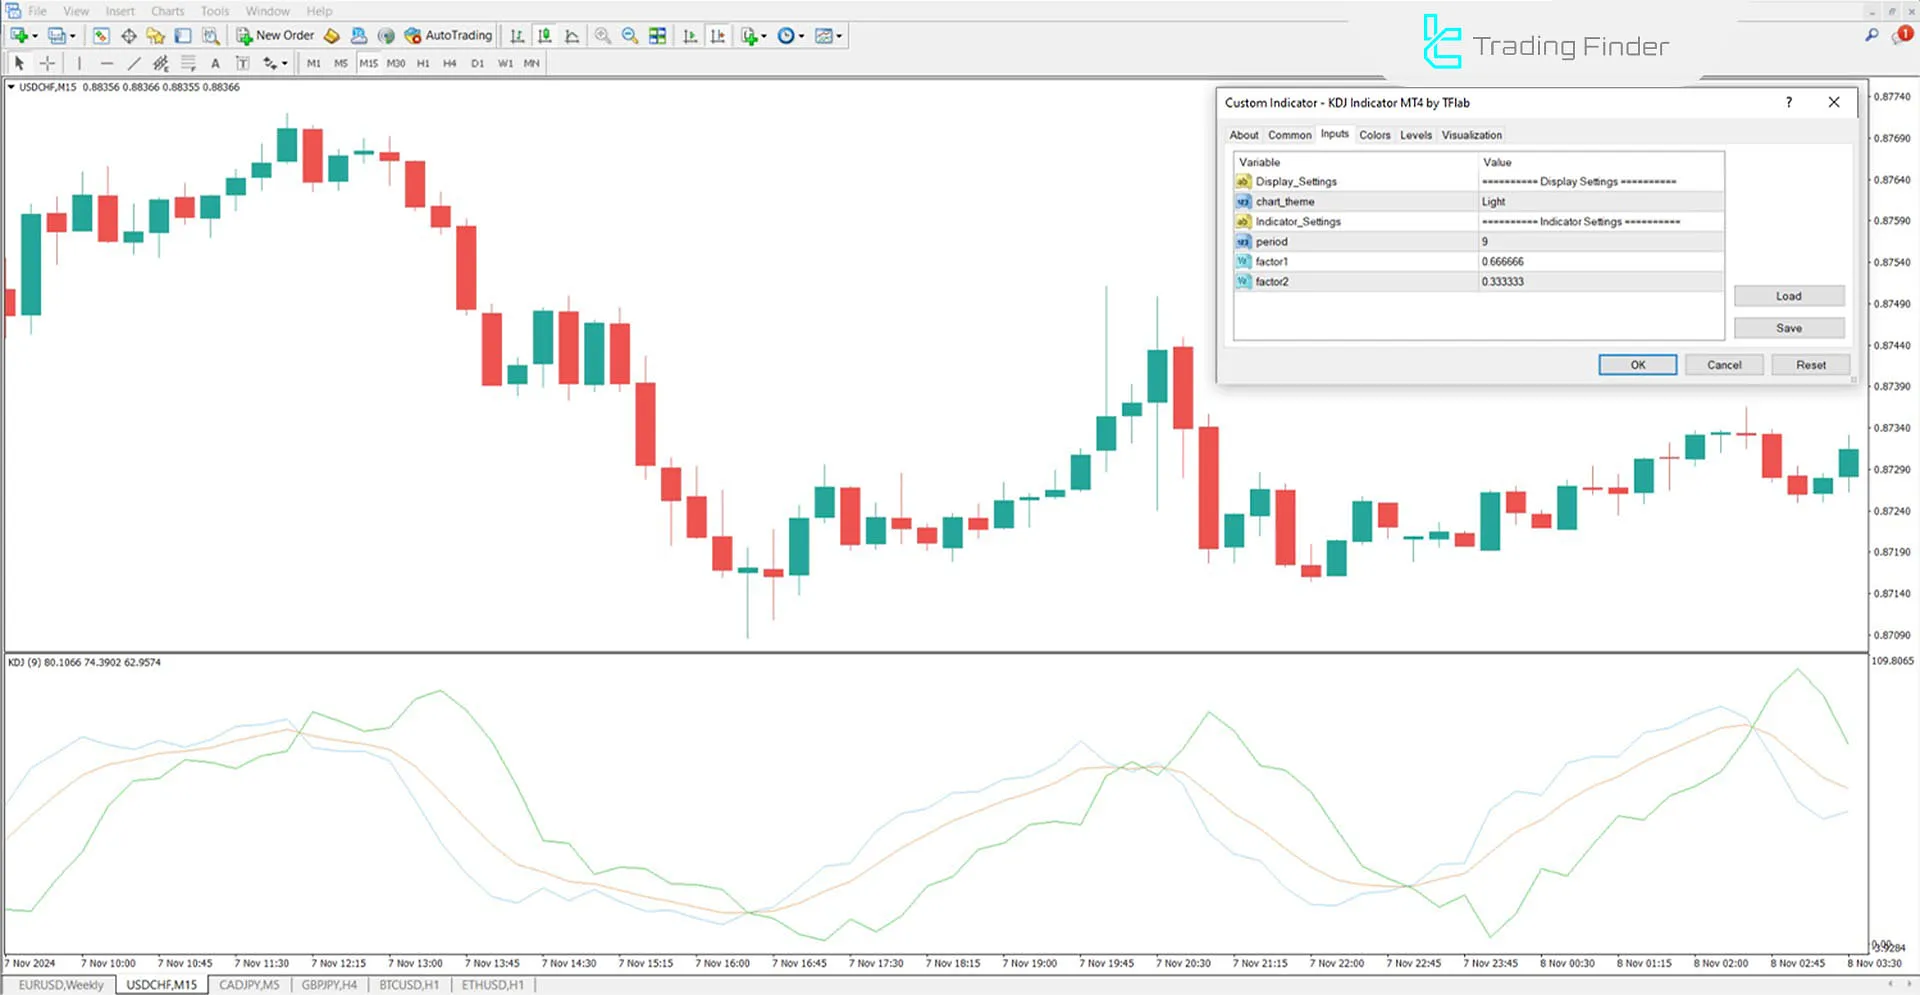
- Chart Theme: Display chart background;
- Period: Indicator calculation period (default value: 9);
- Factor1: Smoothing factor 1 for the lines (default value: 0.666666);
- Factor2: Smoothing factor 2 for the lines (default value: 0.3333333).
Conclusion
The KDJ indicator, as an advanced version of the Stochastic Oscillator, is one of the Trading Assist Indicators in MetaTrader 4 used for identifying overbought and oversold conditions as well as trend reversal points.
On the MetaTrader 4 platform, traders can enhance their trading strategies by precisely adjusting the timeframes and combining this indicator with other tools, such as moving averages or support and resistance levels.
KDJ MT4 PDF
KDJ MT4 PDF
Click to download KDJ MT4 PDFhat is the difference between the KDJ indicator and the Stochastic Oscillator?
The main difference lies in the J line, representing the variance between the K and D lines. This feature allows traders to detect trend changes and reversal points with greater sensitivity.
What is the KDJ indicator?
The KDJ indicator is an advanced technical analysis tool that is an advanced version of the Stochastic Oscillator.


