![Kolier Supertrend Indicator for MT4 - Download - [TradingFinder]](https://cdn.tradingfinder.com/image/289264/2-39-en-kolier-supertrend-mt4-1.webp)
![Kolier Supertrend Indicator for MT4 - Download - [TradingFinder] 0](https://cdn.tradingfinder.com/image/289264/2-39-en-kolier-supertrend-mt4-1.webp)
![Kolier Supertrend Indicator for MT4 - Download - [TradingFinder] 1](https://cdn.tradingfinder.com/image/289273/2-39-en-kolier-supertrend-mt4-2.webp)
![Kolier Supertrend Indicator for MT4 - Download - [TradingFinder] 2](https://cdn.tradingfinder.com/image/289277/2-39-en-kolier-supertrend-mt4-3.webp)
![Kolier Supertrend Indicator for MT4 - Download - [TradingFinder] 3](https://cdn.tradingfinder.com/image/289276/2-39-en-kolier-supertrend-mt4-4.webp)
The Kolier Supertrend Indicator on the MetaTrader 4 platform is a technical analysis tool used to identify market trends and potential reversal points. It operates based on the ATR (Average True Range) index.
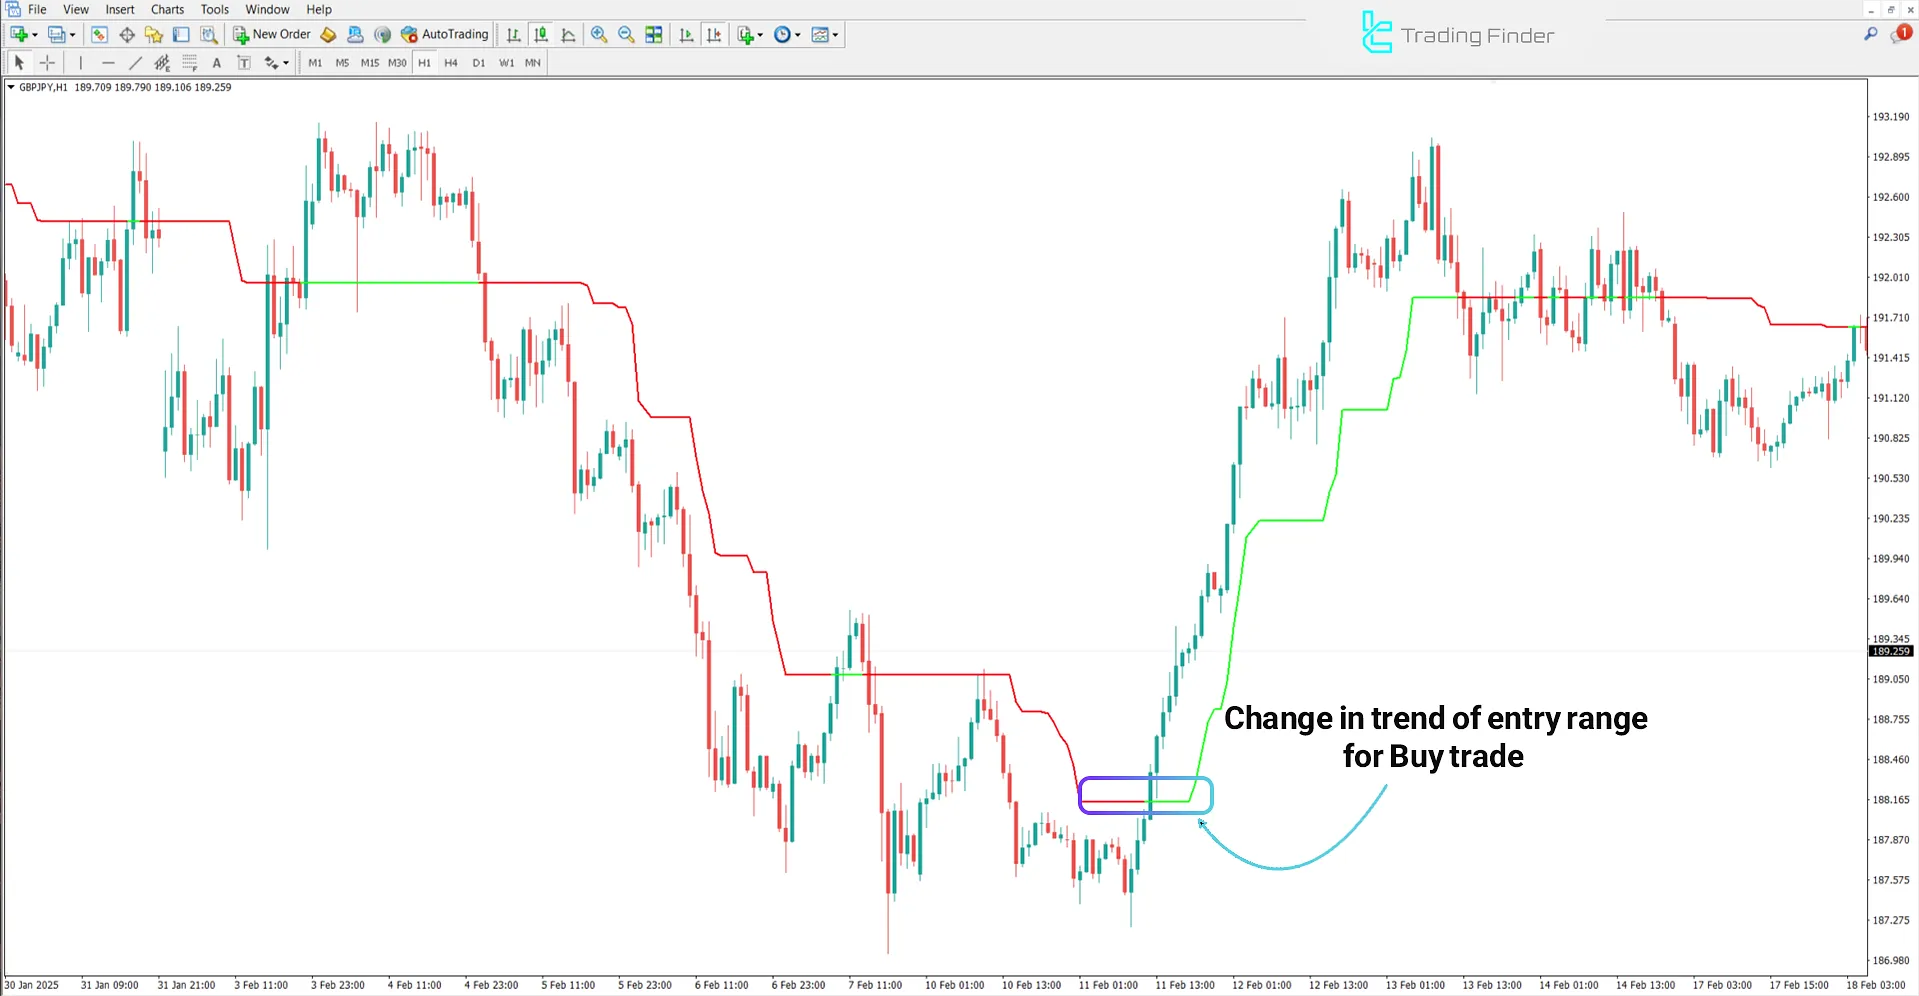
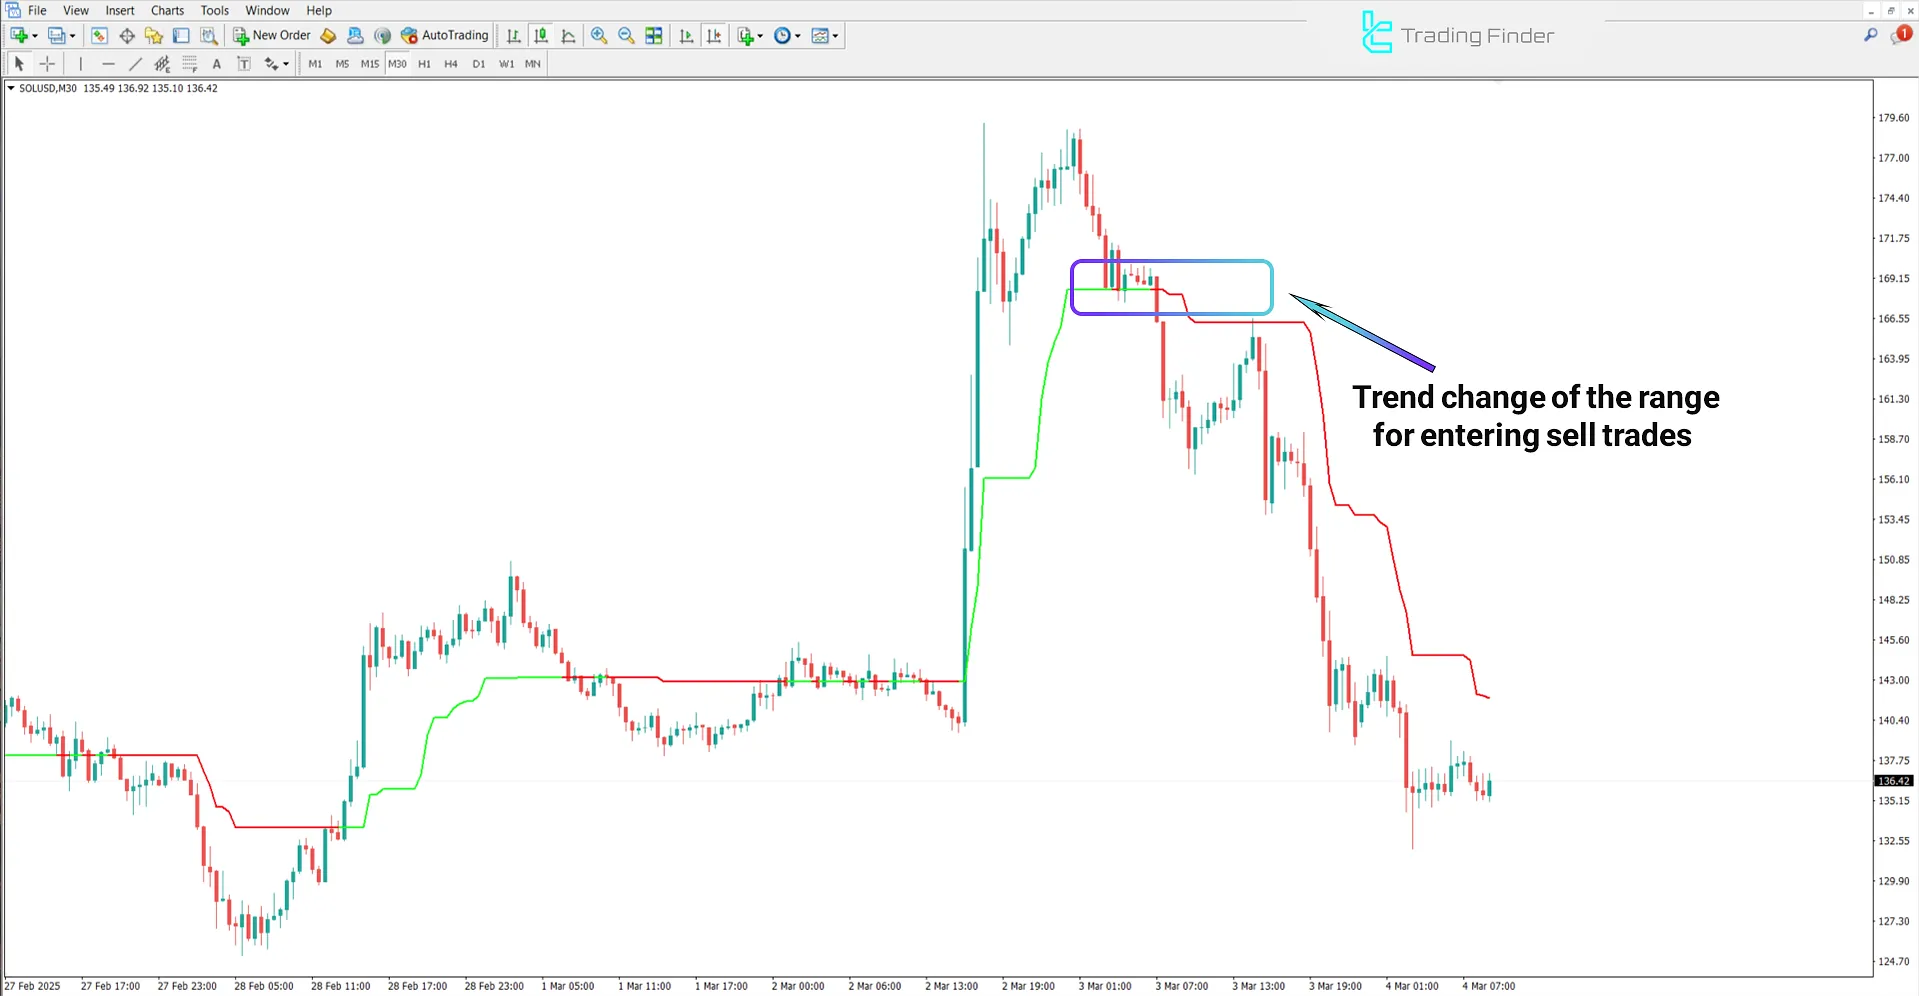
In this trading Assist, the indicator line turns green when the market trend shifts upward, and when the trend changes from upward to downward, the line turns red.
Kolier Supertrend Specifications Table
The table below outlines the general features of the Kolier Supertrend Indicator.
Indicator Categories: | Currency Strength MT4 Indicators Trading Assist MT4 Indicators Levels MT4 Indicators |
Platforms: | MetaTrader 4 Indicators |
Trading Skills: | Intermediate |
Indicator Types: | Reversal MT4 Indicators |
Timeframe: | Multi-Timeframe MT4 Indicators |
Trading Style: | Day Trading MT4 Indicators |
Trading Instruments: | Forward Market MT4 Indicators Stock Market MT4 Indicators Cryptocurrency MT4 Indicators Forex MT4 Indicators |
Indicator at a Glance
The ATR index measures the average true range of price movements. This index allows traders to assess market volatility over specific periods (e.g., 10 or 14 periods) in the Kolier Supertrend Indicator.
The indicator line's color indicates suitable entry and exit zones for trades based on the calculated volatility and the overall market trend.
Uptrend Conditions
Based on the 1-hour chart of the GBP/JPY currency pair (British Pound vs. Japanese Yen), when the price breaks the Kolier Supertrend line upward, and the color changes to green, this condition can provide a suitable confirmation for entering Buy trades.

Downtrend Conditions
According to the SOL/USD chart analysis in the 30-minute timeframe, favorable conditions for entering Sell trades are created when the price breaks the indicator line downward and the color changes to red.
This situation may indicate increased selling pressure and the likelihood of a continued downtrend in the market.

Indicator Settings
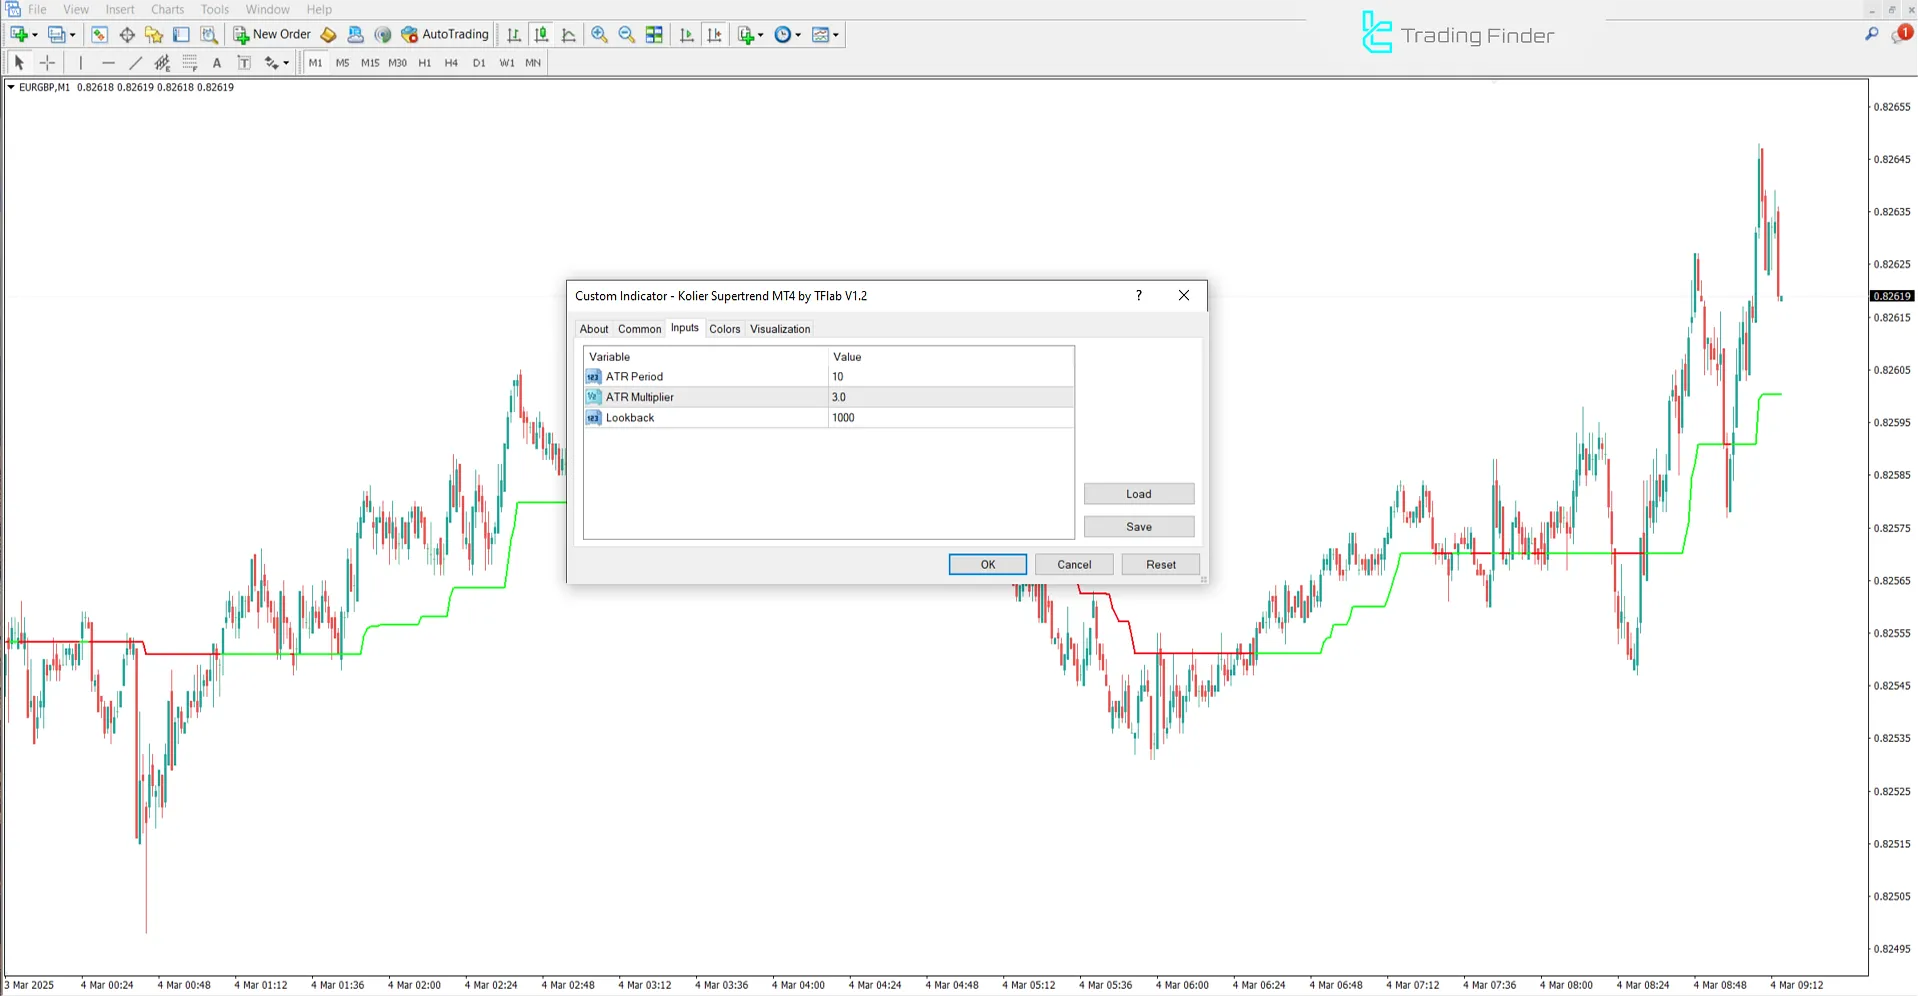
The settings of the Kolier Supertrend Indicator are displayed in the image below:

- ATR Period: Calculation length
- ATR Multiplier: Scaling factor
- Lookback: Review range
Conclusion
In the Kolier Supertrend Indicator for MetaTrader 4, adjusting the ATR multiplier value affects the accuracy of market trend identification. This allows traders to customize the indicator according to market conditions and trading strategies.
Additionally, the price breaking the MetaTrader4 indicator line and its color change can be considered suitable zones for Entry and Exit points.
Kolier Supertrend MT4 PDF
Kolier Supertrend MT4 PDF
Click to download Kolier Supertrend MT4 PDFIs this indicator only usable in the Forex market?
No, this indicator is suitable for all trading markets.
What is the appropriate timeframe for using the Kolier Supertrend Indicator?
This indicator is multi-timeframe and can be used across all timeframes.


