![Lab Trend Indicator in MetaTrader 4 Download - [TradingFinder]](https://cdn.tradingfinder.com/image/424008/2-80-en-lab-trend-mt4-1.webp)
![Lab Trend Indicator in MetaTrader 4 Download - [TradingFinder] 0](https://cdn.tradingfinder.com/image/424008/2-80-en-lab-trend-mt4-1.webp)
![Lab Trend Indicator in MetaTrader 4 Download - [TradingFinder] 1](https://cdn.tradingfinder.com/image/424010/2-80-en-lab-trend-mt4-2.webp)
![Lab Trend Indicator in MetaTrader 4 Download - [TradingFinder] 2](https://cdn.tradingfinder.com/image/424007/2-80-en-lab-trend-mt4-3.webp)
![Lab Trend Indicator in MetaTrader 4 Download - [TradingFinder] 3](https://cdn.tradingfinder.com/image/424009/2-80-en-lab-trend-mt4-4.webp)
The Lab Trend Indicator is a technical analysis tool that functions similarly to the ASC Trend Indicator on the MetaTrader 4 platform. This indicator uses advanced algorithms to identify the beginning of new trends through colored signal dots, defined as follows:
- A green dot indicates the beginning of a bullish trend and acts as a Buy signal;
- A red dot marks the start of a bearish trend and serves as a Sell signal.
Lab Trend Indicator Table
The general specifications of the Lab Trend Indicator are presented in the table below:
Indicator Categories: | Signal & Forecast MT4 Indicators Currency Strength MT4 Indicators Trading Assist MT4 Indicators |
Platforms: | MetaTrader 4 Indicators |
Trading Skills: | Elementary |
Indicator Types: | Reversal MT4 Indicators |
Timeframe: | Multi-Timeframe MT4 Indicators |
Trading Style: | Intraday MT4 Indicators |
Trading Instruments: | Share Stocks MT4 Indicators Indices Market MT4 Indicators Commodity Market MT4 Indicators Stock Market MT4 Indicators Cryptocurrency MT4 Indicators Forex MT4 Indicators |
Overview of the Lab Trend Indicator
The Lab Trend Indicator analyzes shifts in buyer and seller strength using internal algorithms and displays colored dots on the chart to suggest the likely market direction.
This trading tool performs more accurately in trending markets; however, in choppy or sideways markets, it may produce false signals.
Uptrend Conditions
The following 15-minute chart of the EUR/AUD currency pair demonstrates the indicator’s behavior:
When the price reaches a bottom after a downward trend and a green dot appears, the indicator signals the start of a bullish trend and suggests a Buy entry.

Downtrend Conditions
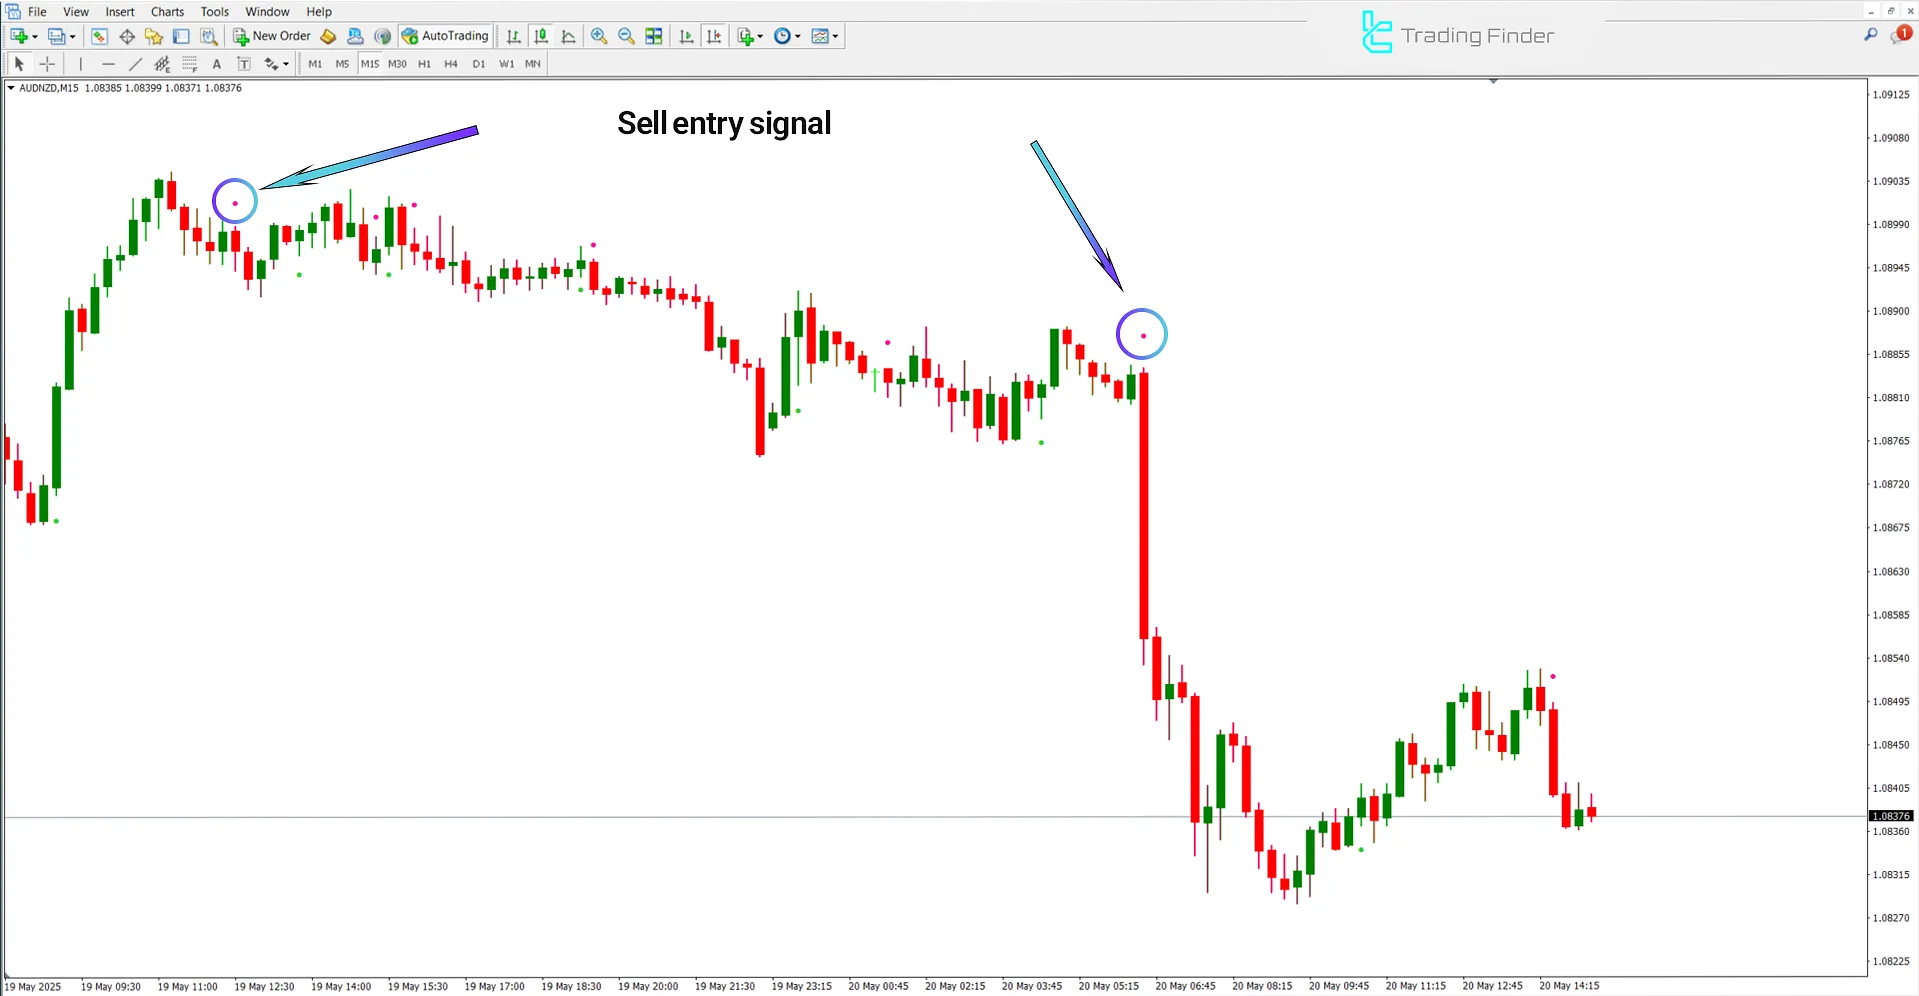
The price chart below shows the AUD/NZD currency pair in the 15-minute timeframe.
At the top of the price chart, when a red dot appears from the Lab Trend Indicator, it suggests the beginning of a bearish trend and serves as a Sell signal.

Lab Trend Indicator Settings
The settings panel of the Lab Trend Indicator is shown in the image below:

- Risk: Risk level
- Show Candles: Display candles
- Show Signals: Display signal dots
- Alerts On: General alerts enabled
- Alerts On Current: Alerts based on the current candle
- Alerts Message: Show textual alert
- Alerts Sound: Sound alert
- Alerts Email: Email notification
Conclusion
The Lab Trend trading Tools is a trend-based technical analysis tool that accurately identifies entry and exit points using colored dots. In addition to showing the market direction, it also highlights potential price reversal zones.
How does the Lab Trend Indicator detect trends?
The indicator uses colored dots (green for a bullish trend and red for a bearish trend) to signal the beginning of a new trend.
Are Lab Trend signals reliable in choppy markets?
No; this indicator may generate false signals in sideways or ranging market conditions.


