![Laguerre RSI Indicator in MT4 Download - Free - [TradingFinder]](https://cdn.tradingfinder.com/image/127026/4-13-en-laguerre-rsi-mt4-1.webp)
![Laguerre RSI Indicator in MT4 Download - Free - [TradingFinder] 0](https://cdn.tradingfinder.com/image/127026/4-13-en-laguerre-rsi-mt4-1.webp)
![Laguerre RSI Indicator in MT4 Download - Free - [TradingFinder] 1](https://cdn.tradingfinder.com/image/126996/4-13-en-laguerre-rsi-mt4-3.webp)
![Laguerre RSI Indicator in MT4 Download - Free - [TradingFinder] 2](https://cdn.tradingfinder.com/image/126994/4-13-en-laguerre-rsi-mt4-4.webp)
![Laguerre RSI Indicator in MT4 Download - Free - [TradingFinder] 3](https://cdn.tradingfinder.com/image/126993/4-13-en-laguerre-rsi-mt4-2.webp)
The Laguerre RSI indicator in MetaTrader 4 incicators is an advanced and improved version of the classic RSI displayed as an oscillator. This indicator reduces volatility, displaying oscillator values more accurately and examining price trends more precisely than the classic RSI.
The highlighted areas by this indicator mark significant points for identifying overbought (Buy) and oversold (Sell) zones in the market. Traders can adjust the coefficient to increase the number of signals according to their strategy.
Indicator Table
Indicator Categories: | ICT MT4 Indicators Smart Money MT4 Indicators Oscillators MT4 Indicators |
Platforms: | MetaTrader 4 Indicators |
Trading Skills: | Intermediate |
Indicator Types: | Lagging MT4 Indicators |
Timeframe: | Multi-Timeframe MT4 Indicators |
Trading Style: | Day Trading MT4 Indicators |
Trading Instruments: | Share Stocks MT4 Indicators Forward Market MT4 Indicators Stock Market MT4 Indicators Cryptocurrency MT4 Indicators Forex MT4 Indicators |
Indicator at a Glance
This indicator, with specific settings including coefficient adjustment, allows for more precise trend identification. Traders can install this indicator for free and use it across all time frames for improved trading. It plots values in a separate window in blue, with a range between 0 and 1.
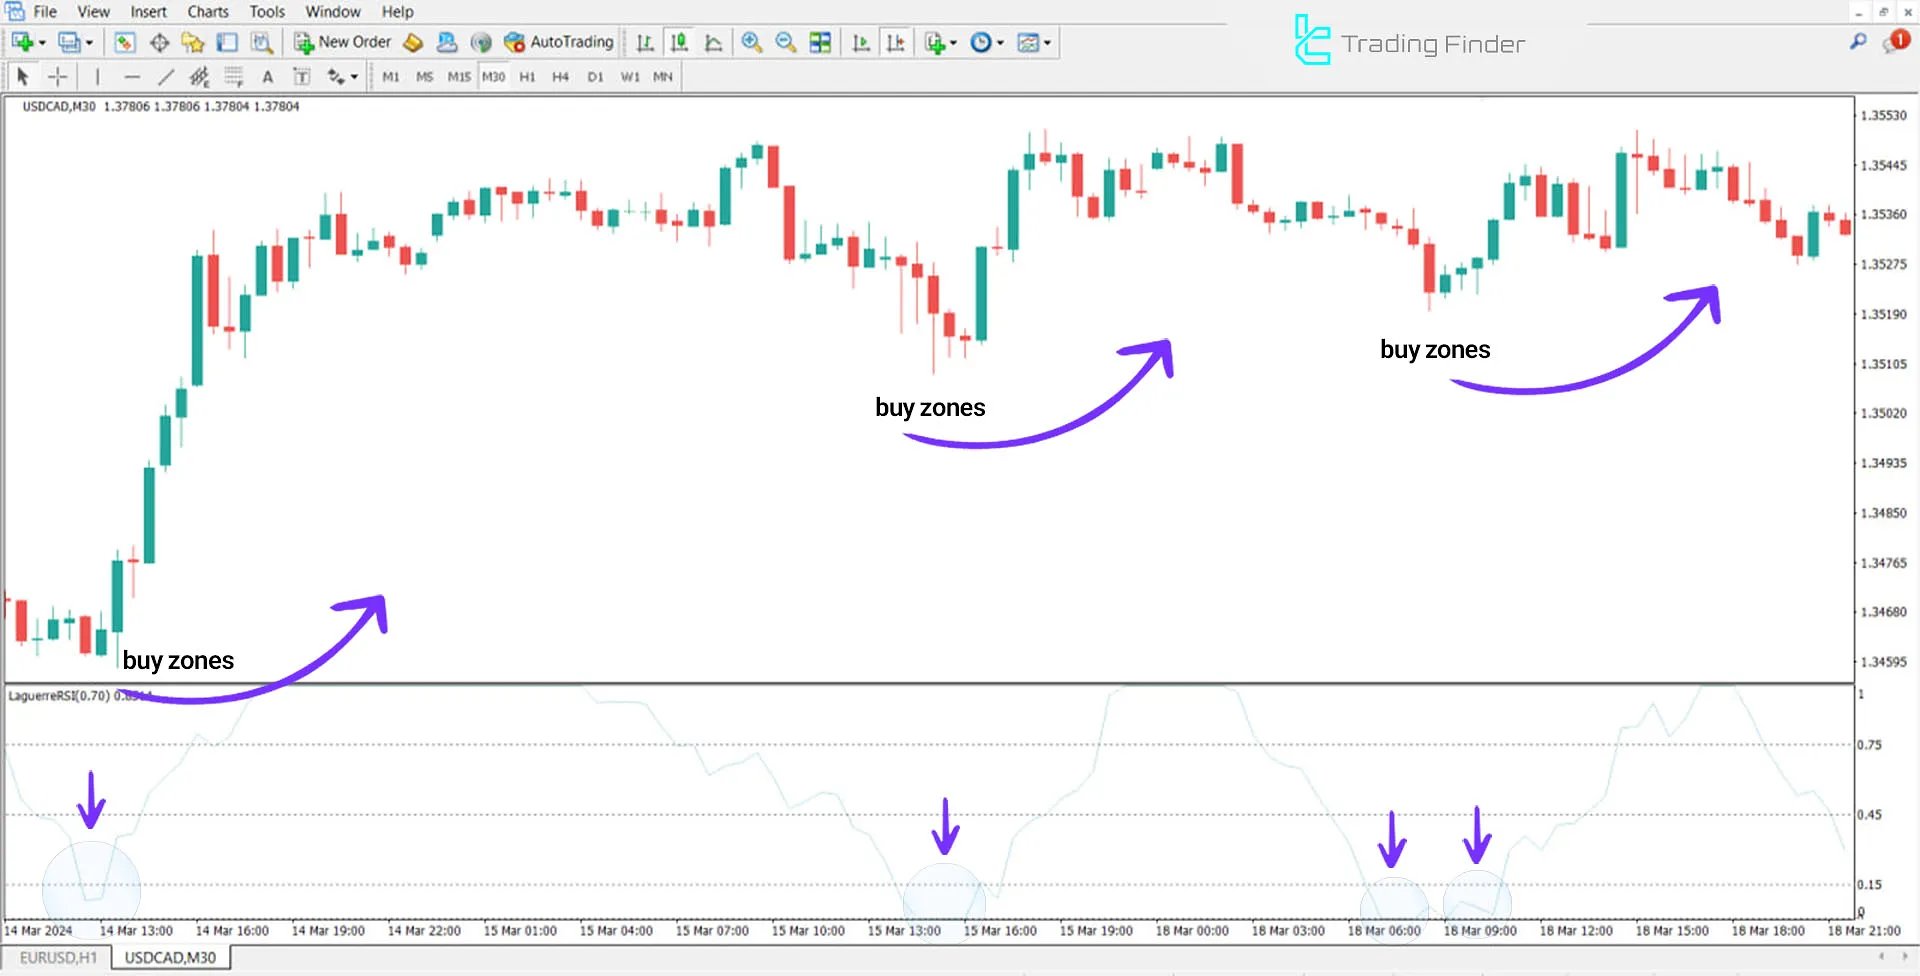
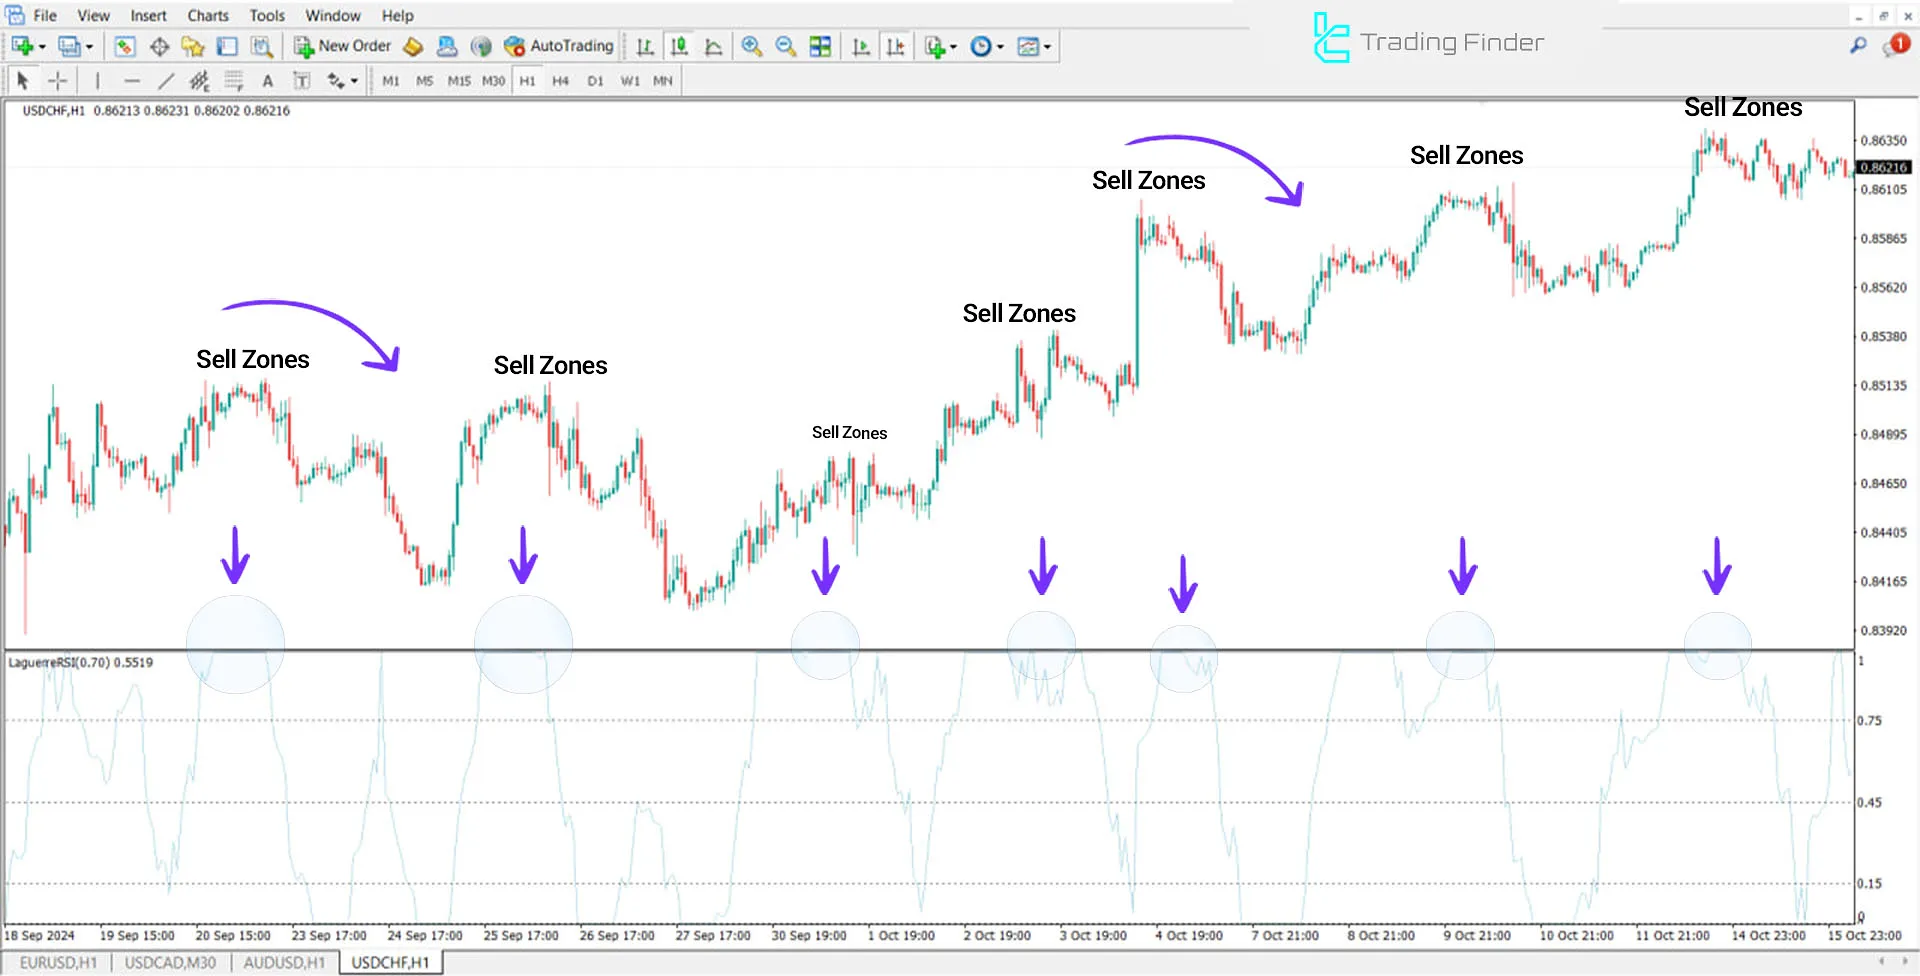
Values below the 0.15 dashed line indicate an uptrend, while values above the 0.75 dashed line indicate a downtrend.
Uptrend Conditions in the Laguerre RSI Indicator
The GBPUSD price chart in the 30-minute time frame displays the Laguerre RSI indicator acting as an oscillator. When the oscillator drops below the 0.15 dashed line, it signals the start of an uptrend, offering a buying opportunity for traders.

Downtrend Conditions in the Laguerre RSI Indicator
On the one-hour chart of the USD/CHF pair, when the oscillator values rise above the 0.75 dashed line, it indicates the beginning of a downtrend. Financial market traders open a sell position with a stop loss above the last peak.

Indicator Settings

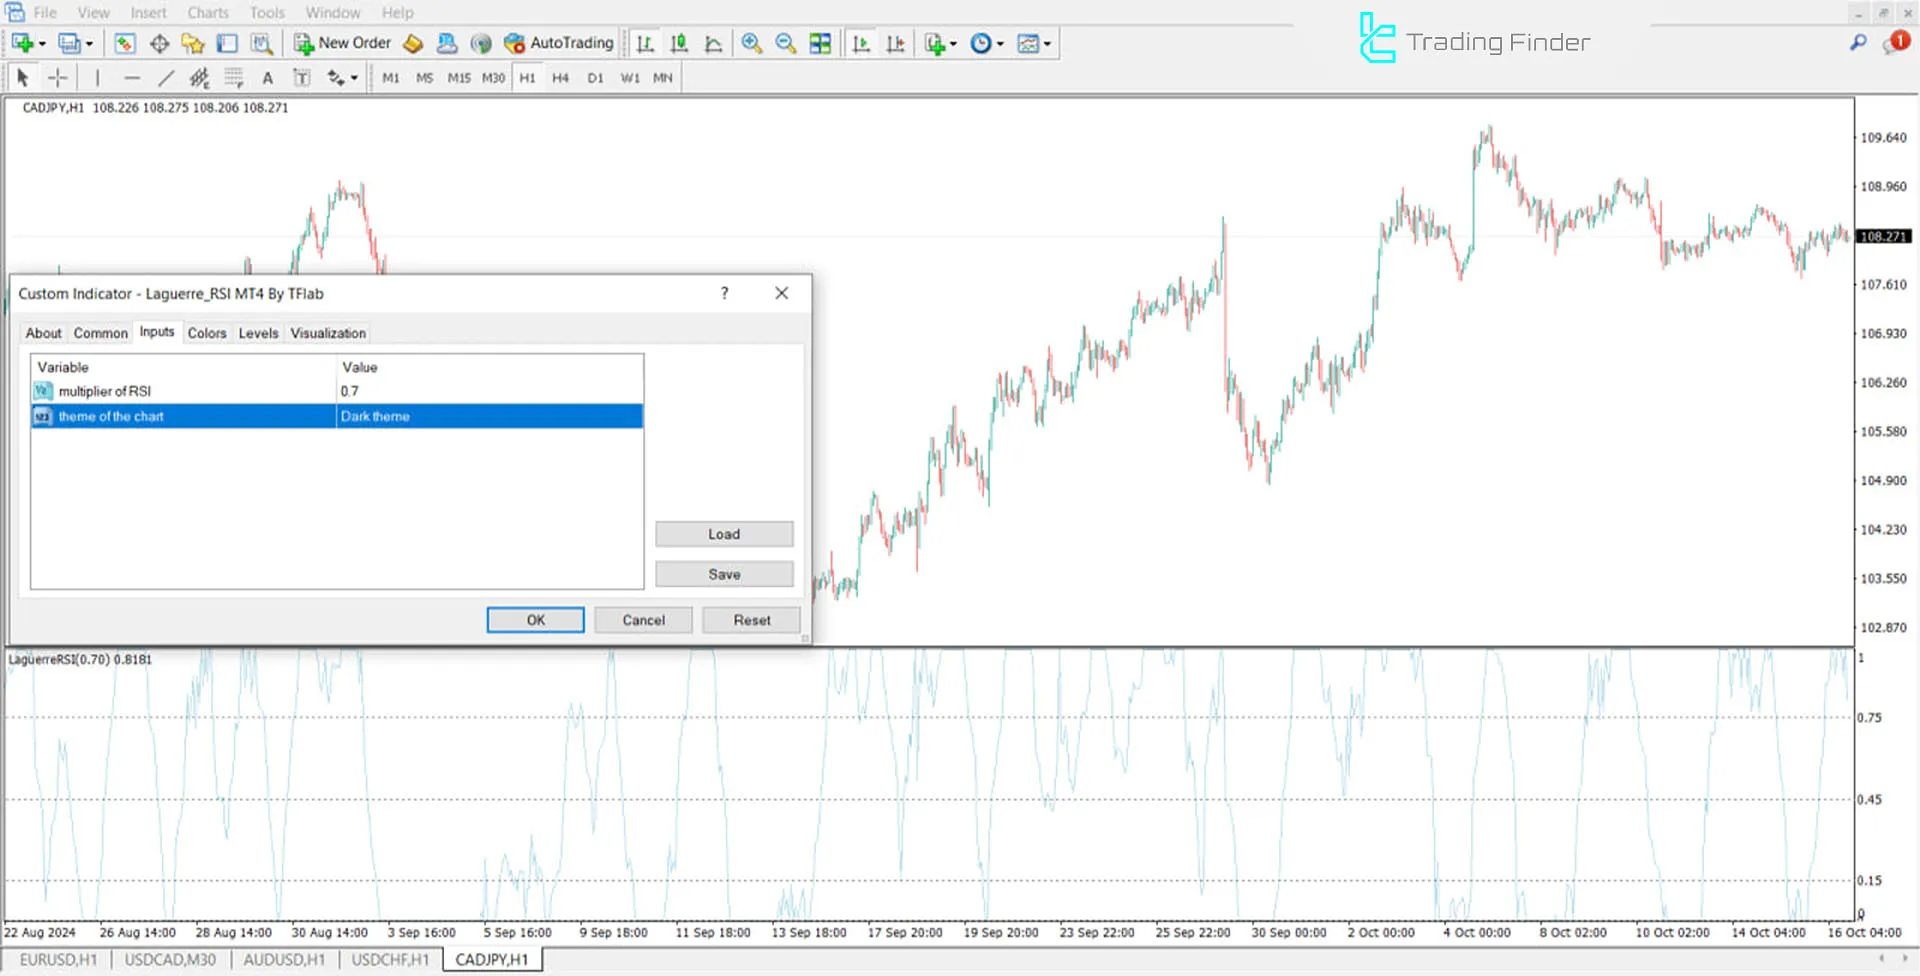
- Multiplier of RSI: Coefficient adjustment;
- Theme of the chart: Background color of the chart.
Conclusion
The Laguerre RSI indicator, among the MetaTrader 4 oscillators, is one of the best options for RSI traders. Forex market traders can find better trading signals using this indicator. With adjustable gamma and the ability to plot values in a separate window, traders can confidently participate in financial markets.
Laguerre RSI MT4 PDF
Laguerre RSI MT4 PDF
Click to download Laguerre RSI MT4 PDFWhat do values below 0.15 and above 0.75 mean?
Values below 0.15 indicate the start of an uptrend, and values above 0.75 indicate the start of a downtrend.
Which time frames are suitable for using this indicator?
This indicator can be used for all time frames.


