![Legacy of Gann Indicator for MT4 Download - [TradingFinder]](https://cdn.tradingfinder.com/image/490661/2-119-en-legacy-of-gann-mt4-1.webp)
![Legacy of Gann Indicator for MT4 Download - [TradingFinder] 0](https://cdn.tradingfinder.com/image/490661/2-119-en-legacy-of-gann-mt4-1.webp)
![Legacy of Gann Indicator for MT4 Download - [TradingFinder] 1](https://cdn.tradingfinder.com/image/490646/2-119-en-legacy-of-gann-mt4-2.webp)
![Legacy of Gann Indicator for MT4 Download - [TradingFinder] 2](https://cdn.tradingfinder.com/image/490657/2-119-en-legacy-of-gann-mt4-3.webp)
![Legacy of Gann Indicator for MT4 Download - [TradingFinder] 3](https://cdn.tradingfinder.com/image/490679/2-119-en-legacy-of-gann-mt4-4.webp)
The Legacy of Gann Indicator is based on the technical principles of William Delbert Gann and utilizes a combination of price and time concepts to forecast potential market reversal points.
Its functionality relies on the manual drawing of a triangle by the trader, using three valid price points (pivots or significant swings).
Legacy of Gann Indicator Table
Table below presents the general features of the Legacy of Gann indicator.
Indicator Categories: | Signal & Forecast MT4 Indicators Trading Assist MT4 Indicators Levels MT4 Indicators |
Platforms: | MetaTrader 4 Indicators |
Trading Skills: | Intermediate |
Indicator Types: | Reversal MT4 Indicators |
Timeframe: | Multi-Timeframe MT4 Indicators |
Trading Style: | Intraday MT4 Indicators |
Trading Instruments: | Share Stocks MT4 Indicators Indices Market MT4 Indicators Commodity Market MT4 Indicators Stock Market MT4 Indicators Cryptocurrency MT4 Indicators Forex MT4 Indicators |
Overview of Legacy of Gann Indicator
After the triangle is drawn, the indicator automatically calculates price and time levels based on the triangle’s structure and Gann logic, and displays them graphically on the chart.
These levels include:
- Bullish and bearish price targets
- Potential Reversal Zones (PRZ)
- Key periods likely to trigger market reaction
This trading tool also generates buy or sell entry signals accompanied by audio and visual alerts based on factors such as time of arrival, triangle structure, and candlestick confirmation.
Bullish Scenario
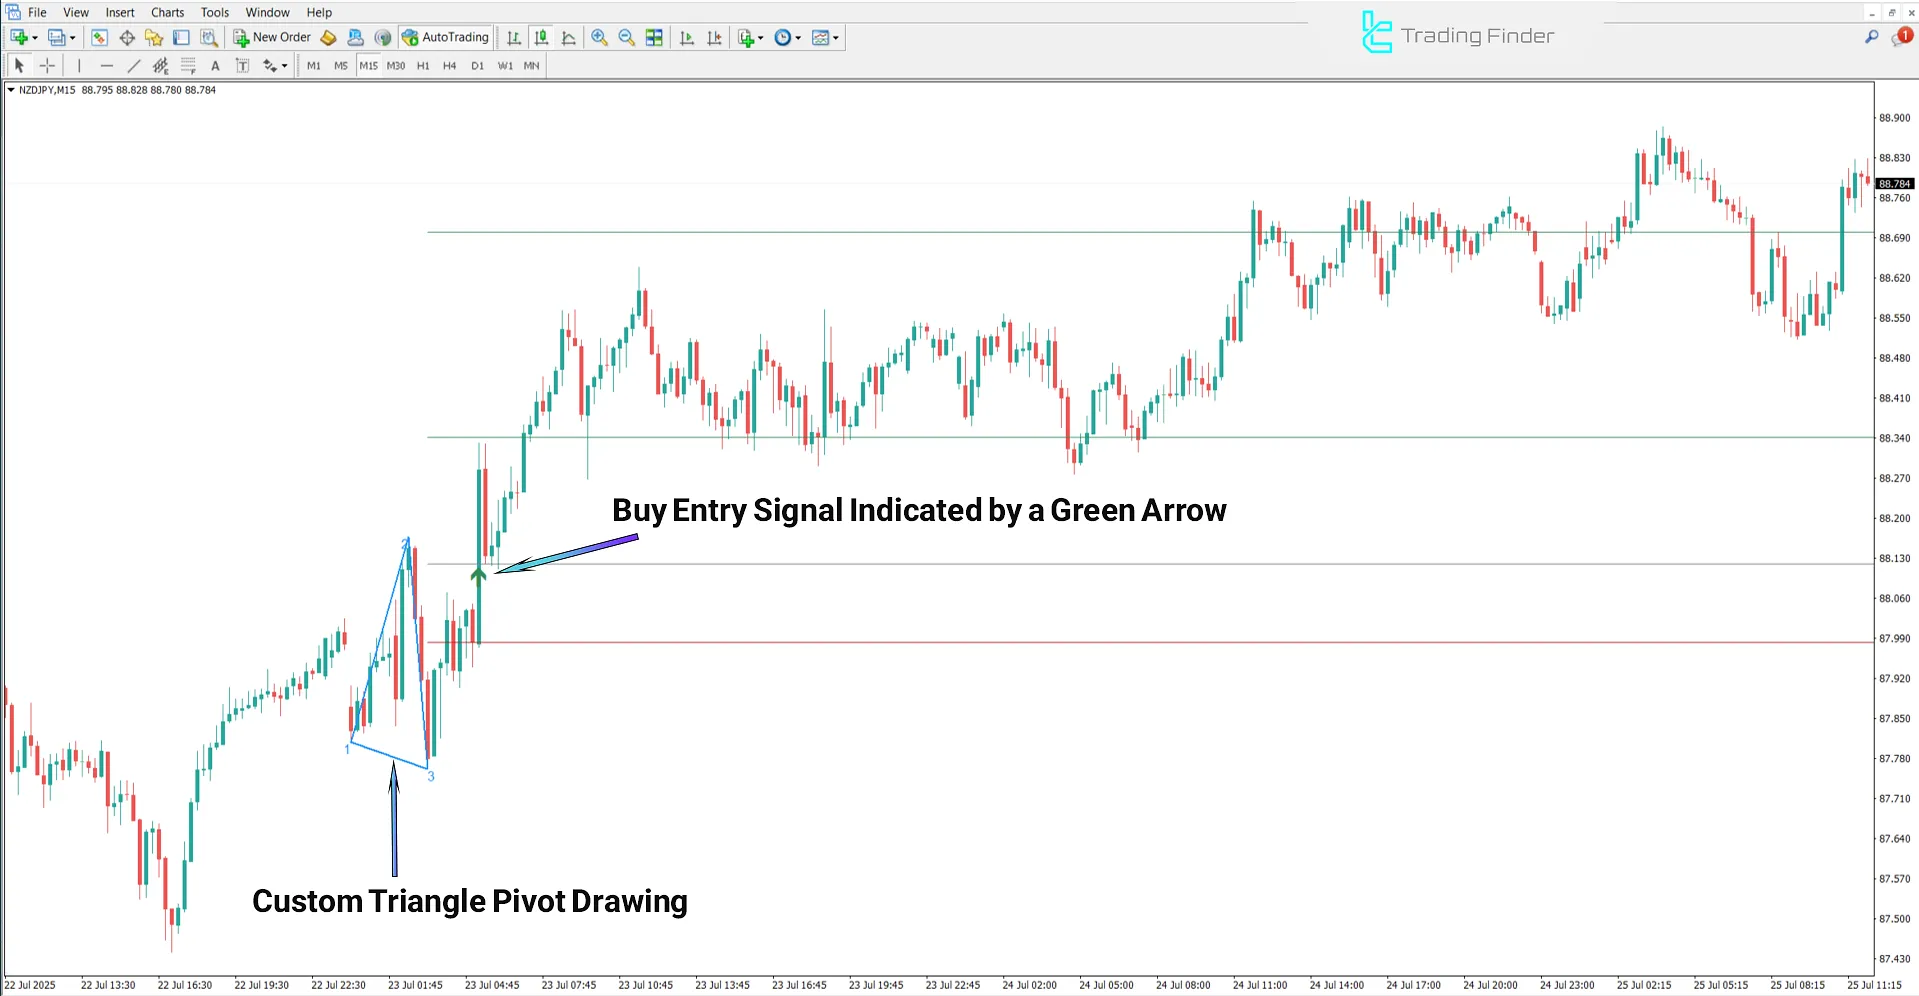
The price chart below shows the NZD/JPY pair on the 5-minute timeframe. In bullish conditions, the formation of a triangle in a corrective zone or near the price bottom, combined with price approaching critical indicator levels and confirmations like a bullish candlestick or resistance breakout, can signal a potential buy entry.
In this case, the higher levels are considered as price targets, and the analysis is validated if the price reaches these zones within the expected time range.

Bearish Scenario
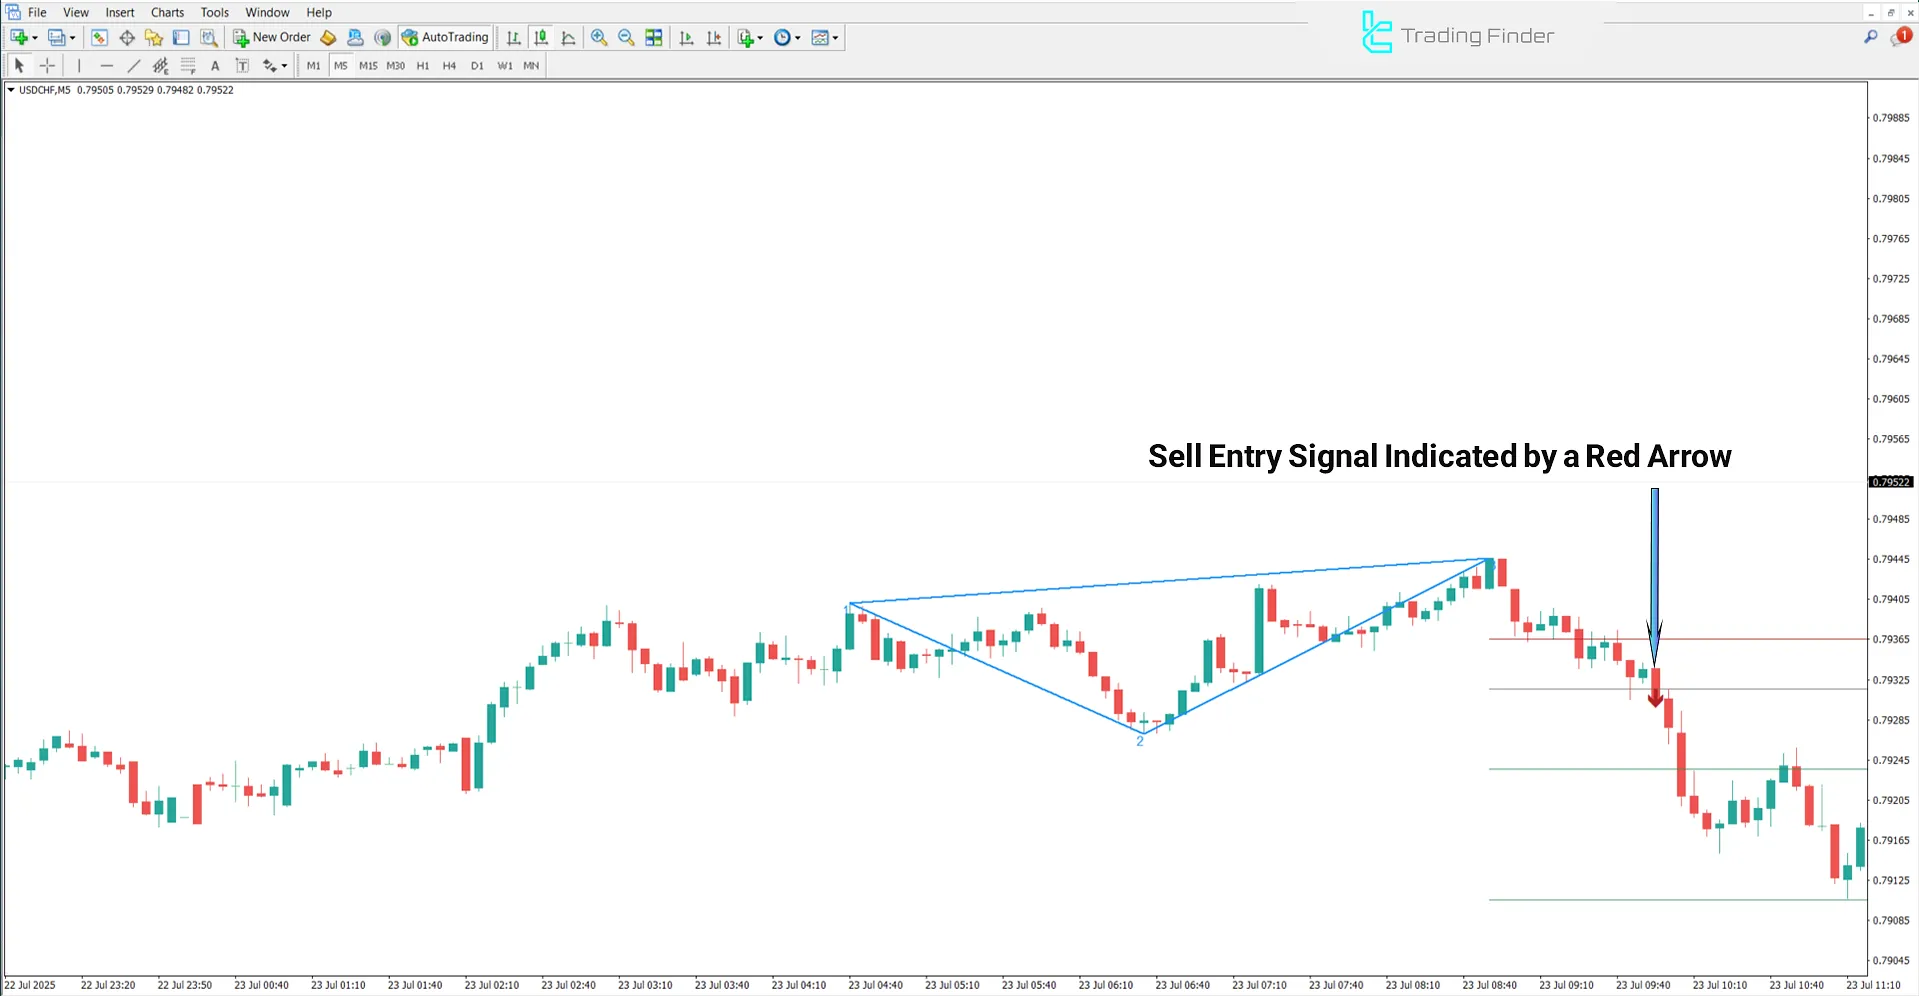
The following chart displays the USD/CHF pair on the 5-minute timeframe. In a bearish trend, a triangle formation near the price top or after an upward correction, alongside the price nearing primary resistance levels, indicates potential for reversal.
If signs like a bearish engulfing candlestick or negative divergence are observed, the indicator issues a sell signal.

Legacy of Gann Indicator Settings
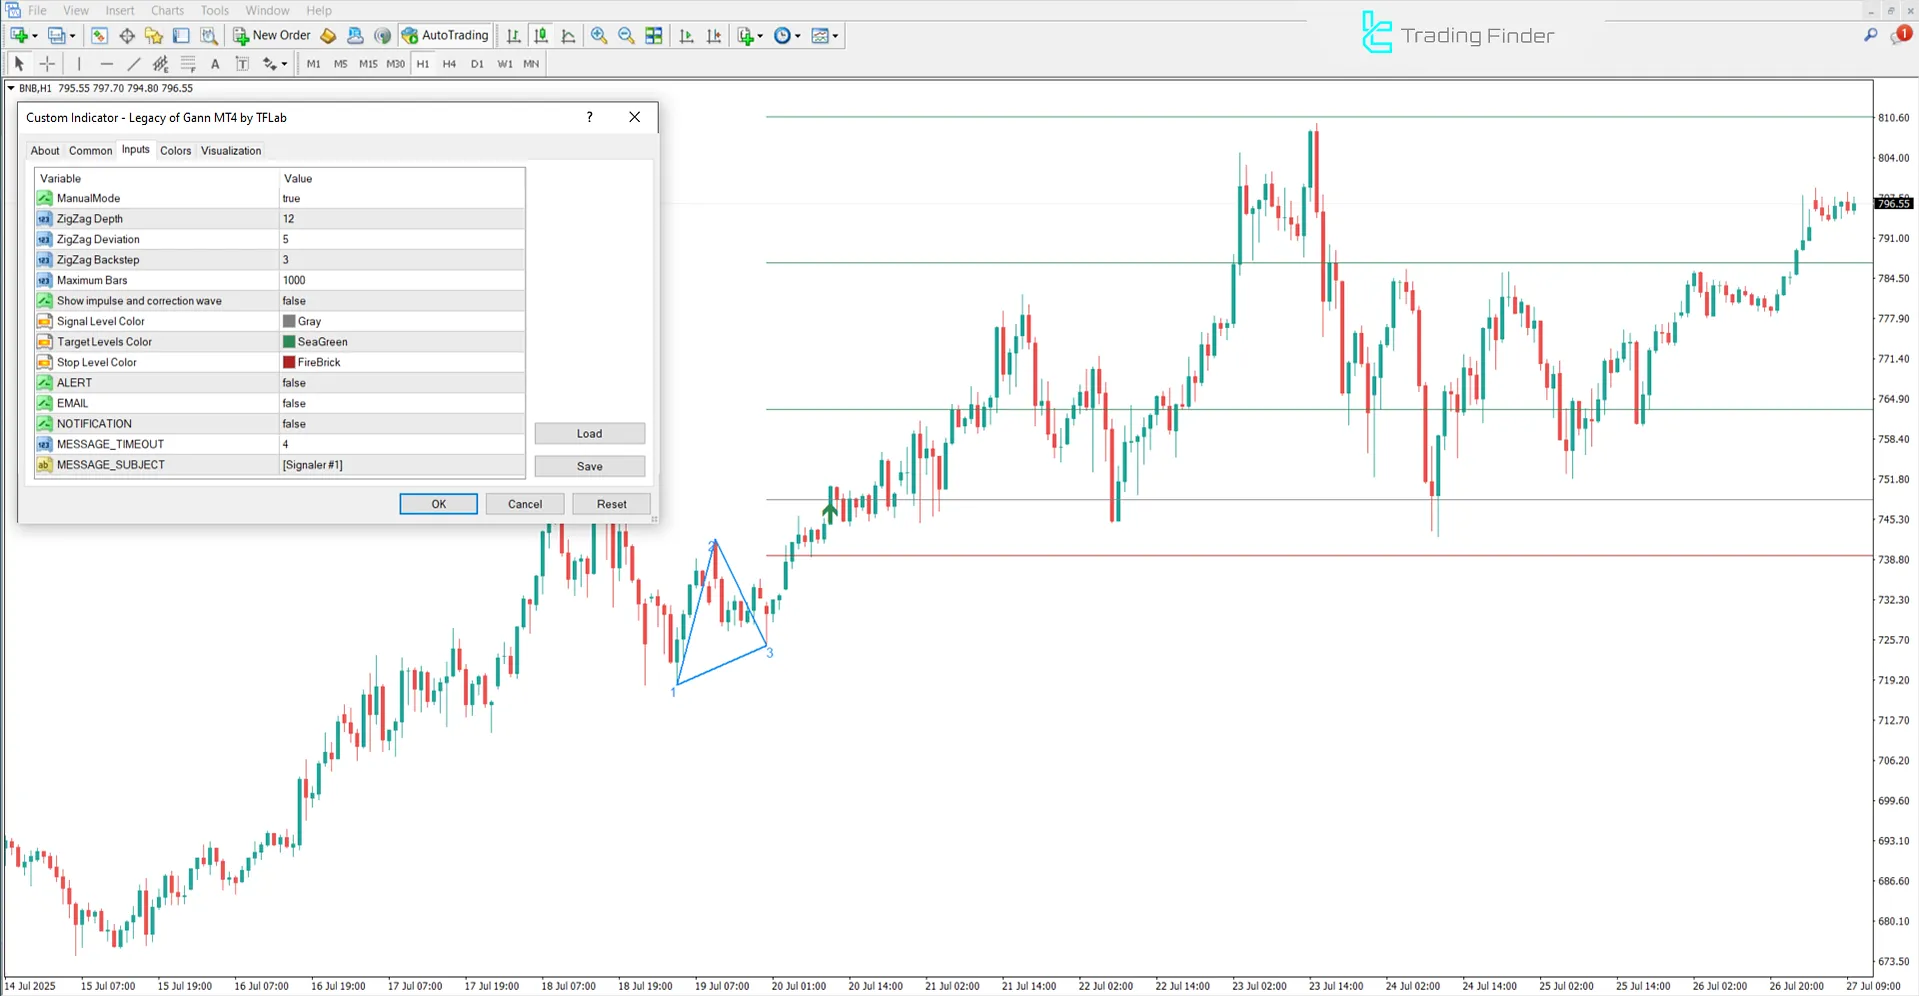
The image below shows the settings panel of the Legacy of Gann indicator in MetaTrader 4:

- Manual Mode: Enables Manual Mode;
- ZigZag Depth: ZigZag depth;
- ZigZag Deviation: ZigZag deviation;
- ZigZag Backstep: Minimum distance between swing points;
- Maximum Bars: Maximum number of candles analyzed on the chart;
- Show Impulse and Correction Wave: Displays impulse and correction waves;
- Signal Level Color: Color of signal levels;
- Target Levels Color: Color of target levels;
- Stop Level Color: Color of stop levels;
- ALERT: Audio alert;
- EMAIL: Email notification;
- NOTIFICATION: Mobile push notification;
- MESSAGE TIMEOUT: Time interval between alerts;
- MESSAGE SUBJECT: Custom alert/message subject.
Conclusion
The Legacy of Gann Indicator integrates time and price analysis to provide an advanced tool for identifying key reversal zones in markets such as Forex and cryptocurrencies.
By combining triangular structures with intelligent algorithms, it offers precise buy and sell signals.
Target zones are visually highlighted, and their reliability is assessed based on price reaction within specific time ranges.
Legacy of Gann Indicator MT4 PDF
Legacy of Gann Indicator MT4 PDF
Click to download Legacy of Gann Indicator MT4 PDFHow does the Legacy of Gann Indicator work?
The indicator allows manual drawing of a triangle using three price points. Then, using Gann-based algorithms, it predicts potential time and price reversal levels.
What conditions trigger a buy or sell signal in the Legacy of Gann Indicator?
A signal is triggered only when the drawn triangle has a valid structure, and price behavior along with clear price action patterns aligns with key levels within the designated timeframe.
Шикарный индикатор!


