![Download Legacy Trader Indicator (Professional Trader) MetaTrader 4 – [TradingFinder]](https://cdn.tradingfinder.com/image/452968/13-159-en-legacy-trader-mt4-01.webp)
![Download Legacy Trader Indicator (Professional Trader) MetaTrader 4 – [TradingFinder] 0](https://cdn.tradingfinder.com/image/452968/13-159-en-legacy-trader-mt4-01.webp)
![Download Legacy Trader Indicator (Professional Trader) MetaTrader 4 – [TradingFinder] 1](https://cdn.tradingfinder.com/image/452971/13-159-en-legacy-trader-mt4-02.webp)
![Download Legacy Trader Indicator (Professional Trader) MetaTrader 4 – [TradingFinder] 2](https://cdn.tradingfinder.com/image/452969/13-159-en-legacy-trader-mt4-03.webp)
![Download Legacy Trader Indicator (Professional Trader) MetaTrader 4 – [TradingFinder] 3](https://cdn.tradingfinder.com/image/452970/13-159-en-legacy-trader-mt4-04.webp)
On July 6, 2025, in version 2, alert/notification and signal functionality was added to this indicator
The Legacy Trader indicator is designed to identify trend direction and market momentum in the MetaTrader 4 platform. This indicator uses a dynamic line, colored dots, and a text display in the chart corner to indicate the current market trend.
Using this indicator, optimal entry and exit points can be identified. It also acts as a trailing stop, with the areas behind the dynamic lines serving as ideal zones for placing stop loss levels.
Legacy Trader Indicator Specifications Table
The following table describes the specifications of the Legacy Trader indicator:
Indicator Categories: | Signal & Forecast MT4 Indicators Volatility MT4 Indicators Trading Assist MT4 Indicators |
Platforms: | MetaTrader 4 Indicators |
Trading Skills: | Elementary |
Indicator Types: | Reversal MT4 Indicators |
Timeframe: | Multi-Timeframe MT4 Indicators |
Trading Style: | Day Trading MT4 Indicators Scalper MT4 Indicators Swing Trading MT4 Indicators |
Trading Instruments: | Share Stocks MT4 Indicators Indices Market MT4 Indicators Commodity Market MT4 Indicators Stock Market MT4 Indicators Cryptocurrency MT4 Indicators Forex MT4 Indicators |
Indicator Overview
The trailing stop lines and dots in the Legacy Trader indicator are drawn in two colors: light blue and purple.
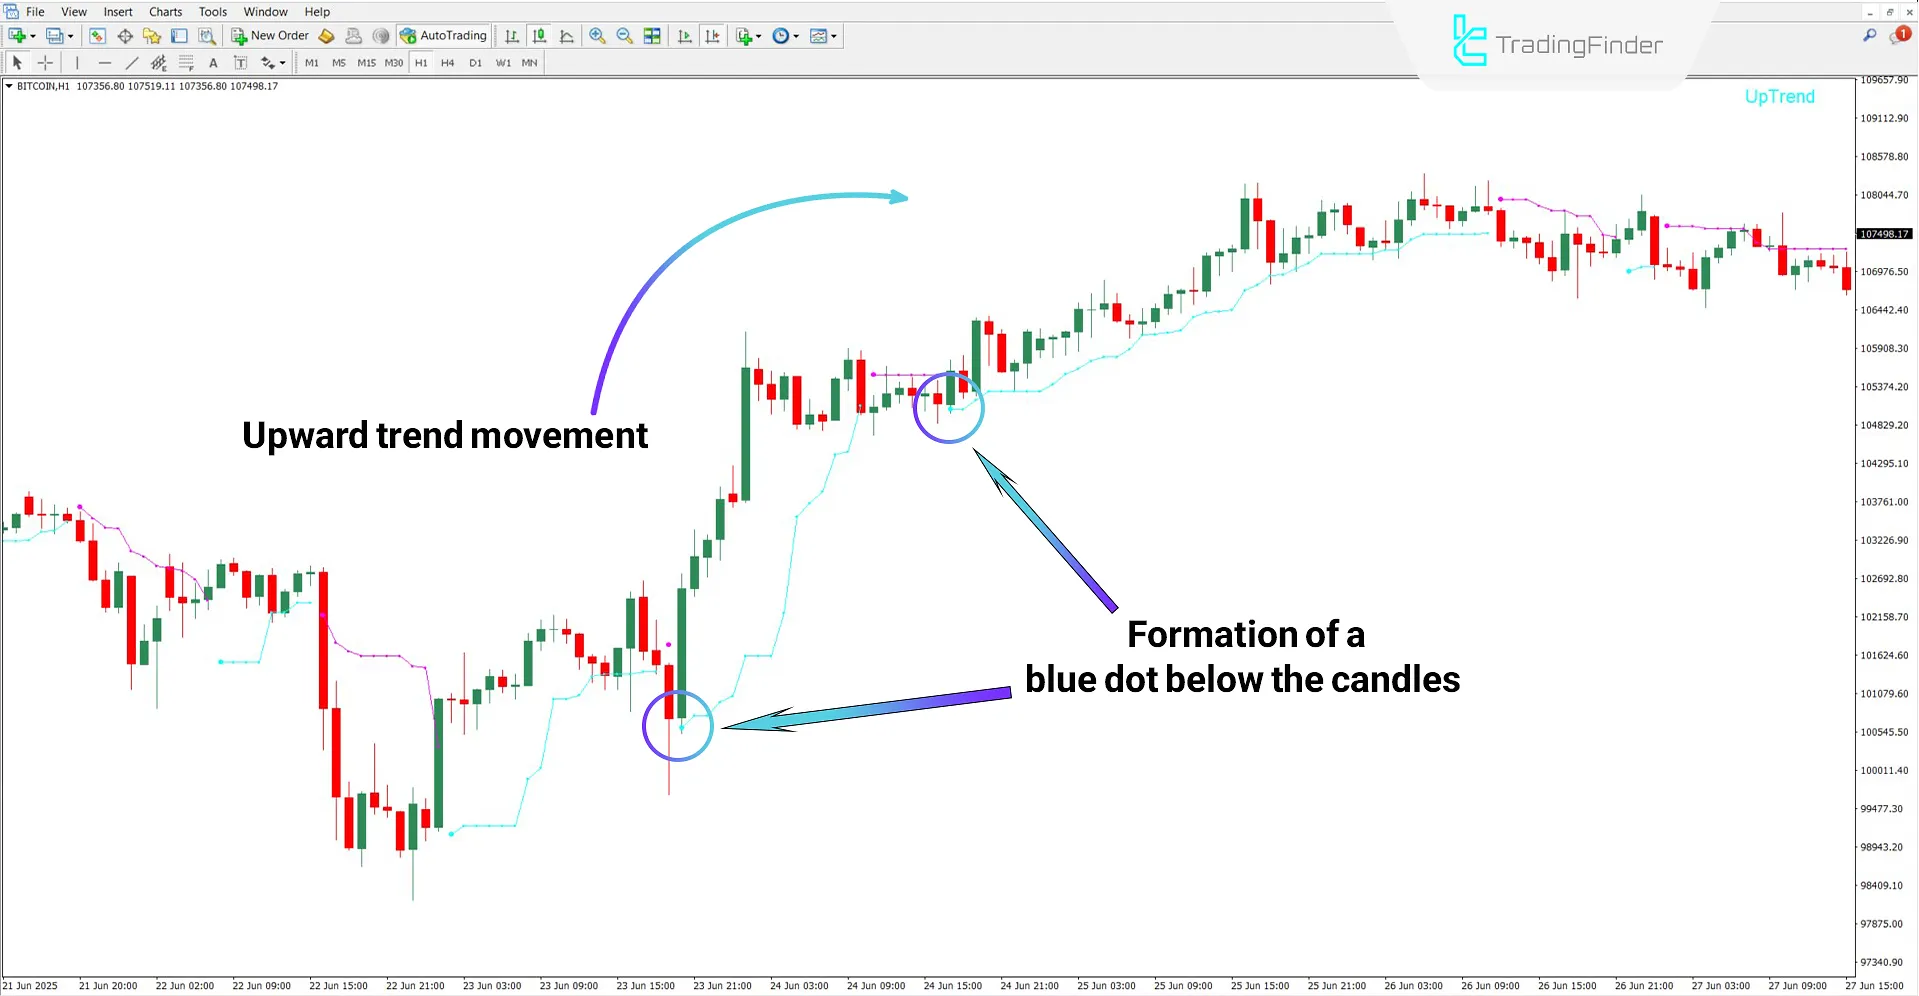
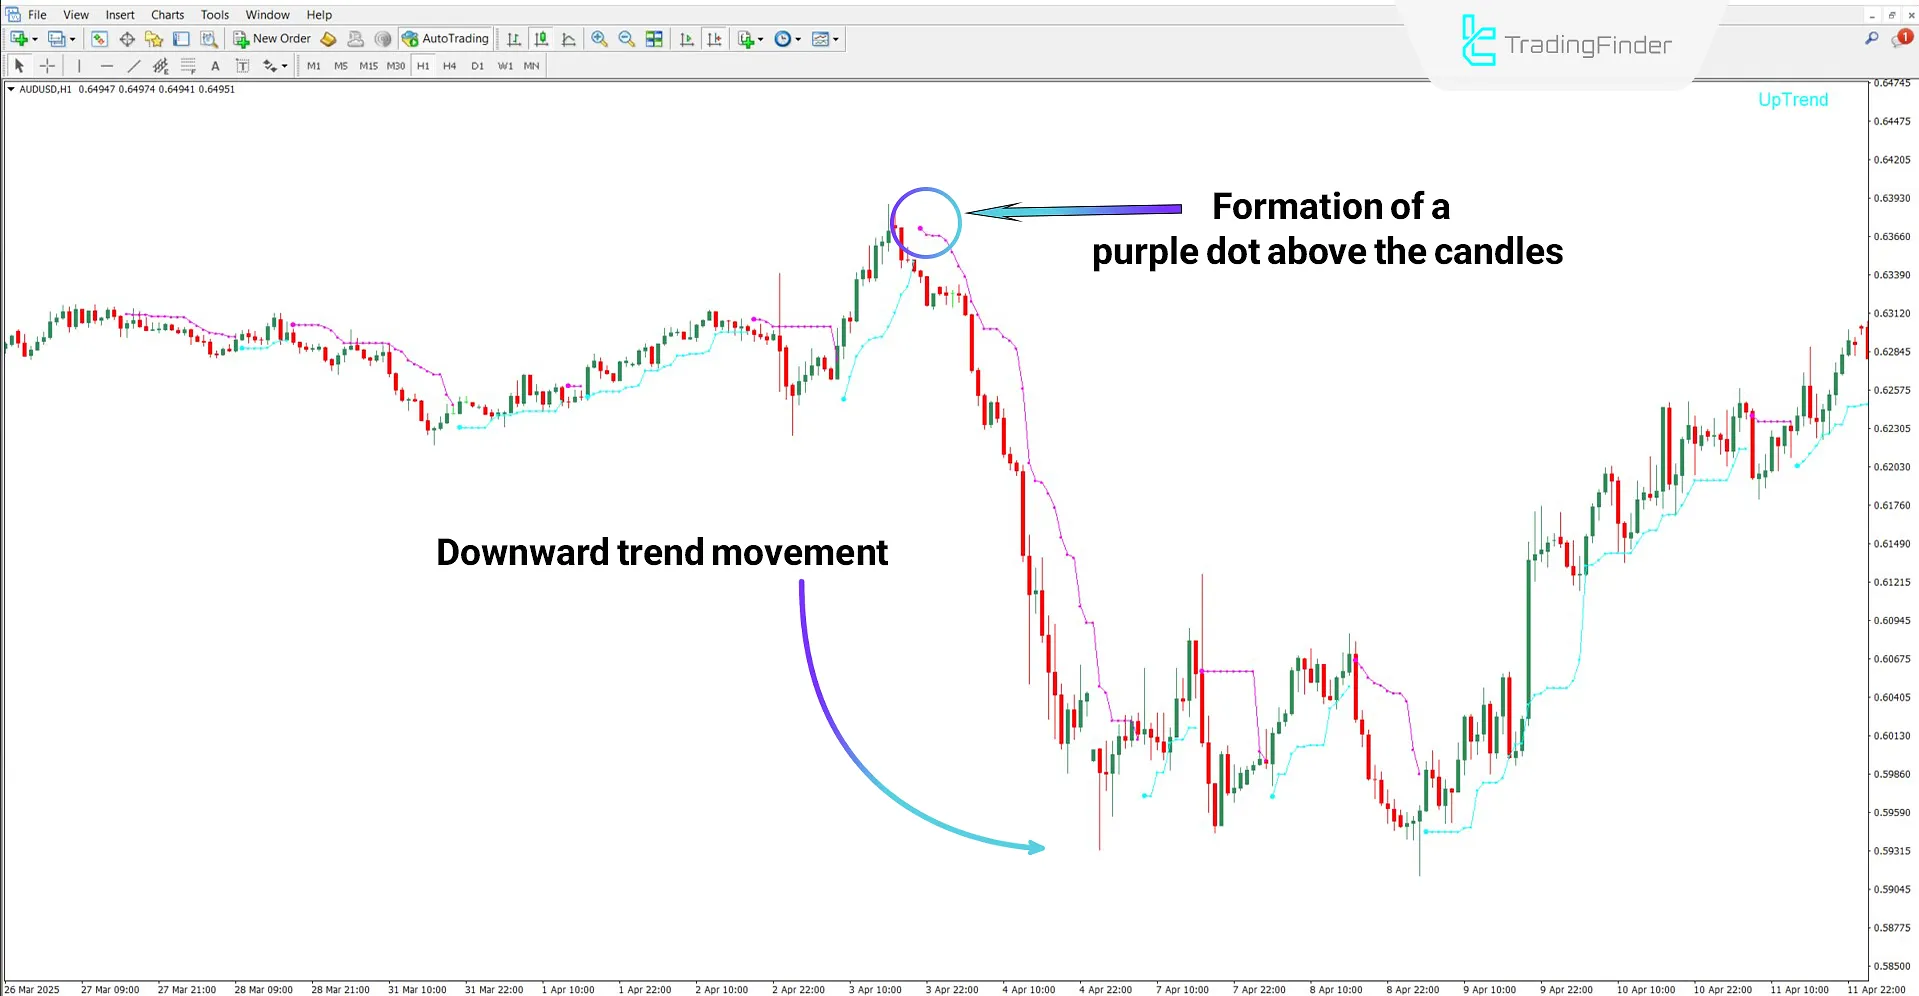
The blue line indicates an uptrend, while the purple line represents a downtrend. Notably, the starting point of each line can serve as a potential entry point for trades.
Uptrend
According to the 1-hour chart of the cryptocurrency Bitcoin (BTC), trailing stop starting points have formed below the candles at two marked areas.
In such a scenario, the blue dot can be considered a buy entry point, with the stop-loss placed below the trailing stop line.

Downtrend
Based on the 1-hour AUD/USD chart, a purple dot appears above the candles, accompanied by a trailing stop line that moves with the downtrend.
In this setup, the marked area can be considered a suitable entry point for a sell position.

Legacy Trader Indicator Settings
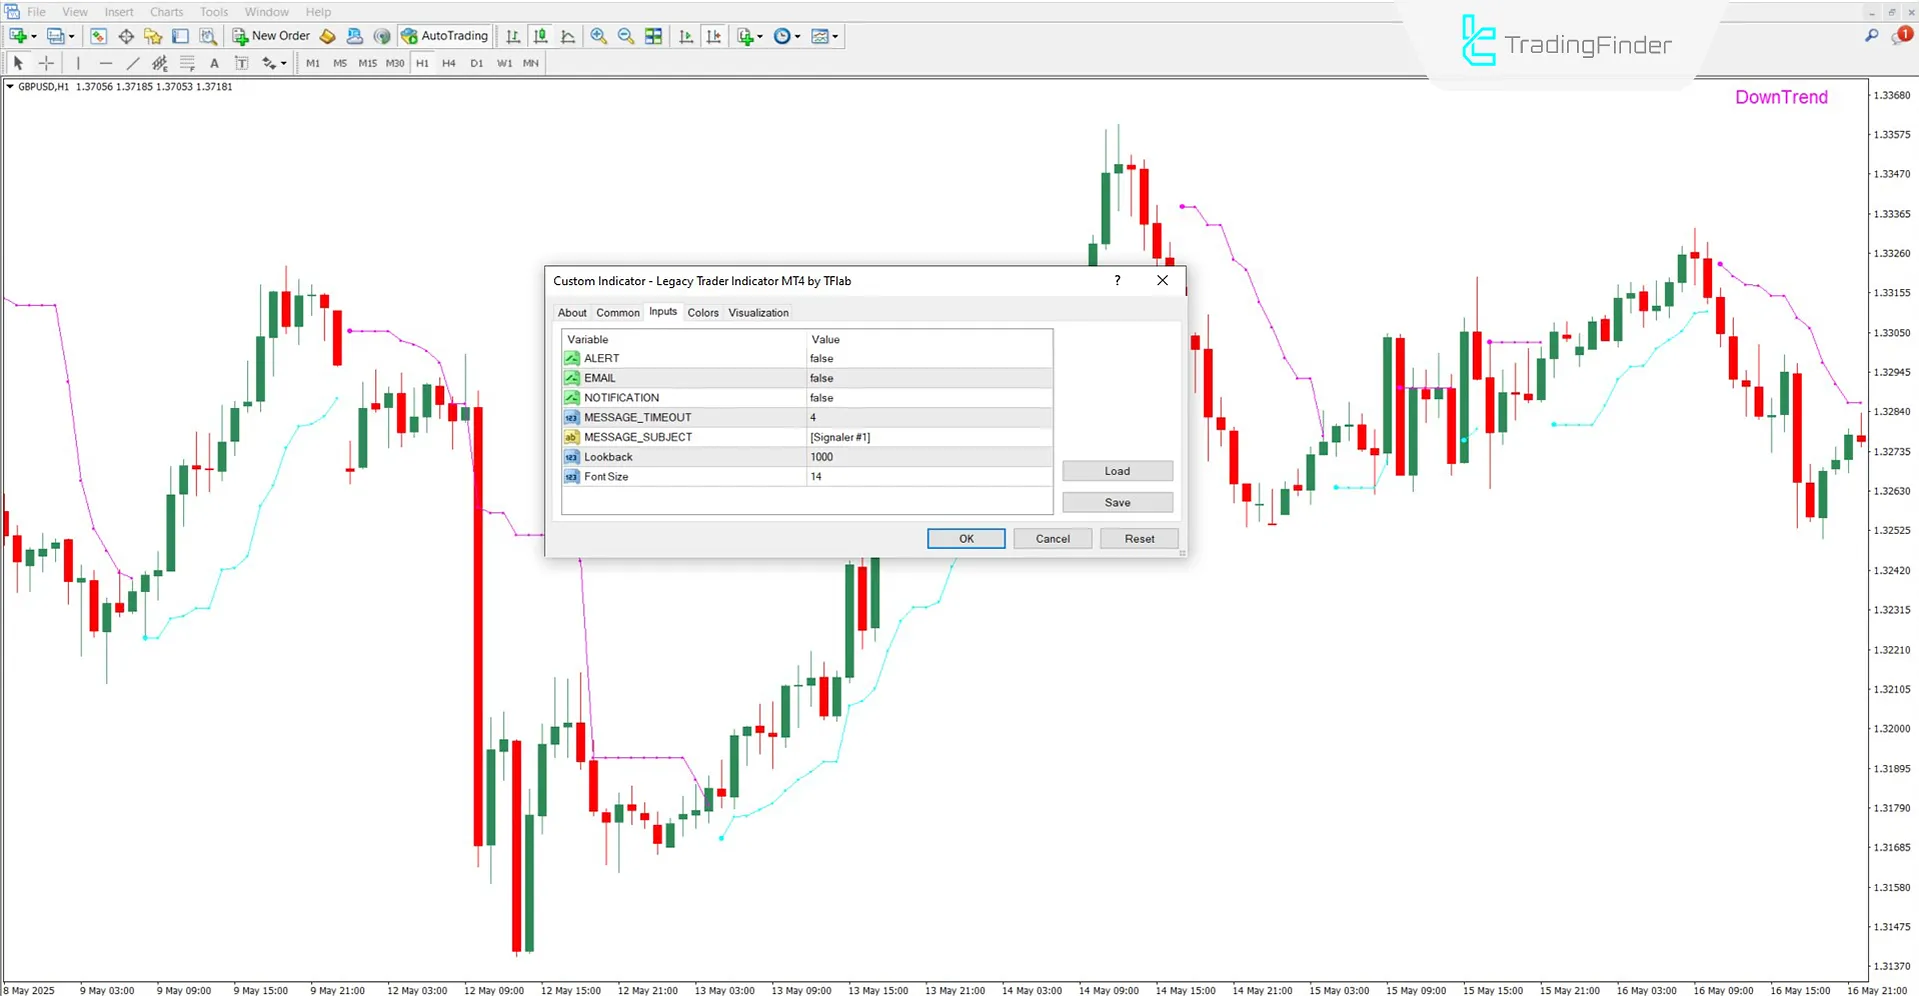
The image below shows the settings panel for the Legacy Trader indicator:

- ALERT: Enable or disable alert on signal issuance
- EMAIL: Enable or disable email alerts when signals occur
- NOTIFICATION: Activate or deactivate push notifications
- MESSAGE_TIMEOUT: Duration the alert message remains on screen (in seconds)
- MESSAGE_SUBJECT: Alert title for categorizing signals
- Lookback: Number of past candles used for indicator calculations
- Font Size: The font size of the text displayed in the chart corner
Conclusion
The Legacy Trader indicator uses colored dots and text displays to represent the market trend direction. Sky blue dots indicate an uptrend, while purple dots signify a downtrend.
Additionally, the on screen text reflects the strength of the current candle. The combination of both dots and text allows for the reliable generation of trade entry signals.
Legacy Trader Professional Trader MT4 PDF
Legacy Trader Professional Trader MT4 PDF
Click to download Legacy Trader Professional Trader MT4 PDFCan the Legacy Trader indicator be used on higher time frames?
Yes, it is a multi-time frame indicator and works on all time frames.
Is the Legacy Trader indicator only suitable for professionals?
No, users of all skill levels can use this trading tool.


