![Linear Regression Channel Indicator Download for Meta Trader 4 - Free - [Trading Finder]](https://cdn.tradingfinder.com/image/105404/10-11-en-linear_regression-mt4.webp)
![Linear Regression Channel Indicator Download for Meta Trader 4 - Free - [Trading Finder] 0](https://cdn.tradingfinder.com/image/105404/10-11-en-linear_regression-mt4.webp)
![Linear Regression Channel Indicator Download for Meta Trader 4 - Free - [Trading Finder] 1](https://cdn.tradingfinder.com/image/30378/10-11-en-linear-regression-channel-mt4-02.avif)
![Linear Regression Channel Indicator Download for Meta Trader 4 - Free - [Trading Finder] 2](https://cdn.tradingfinder.com/image/30382/10-11-en-linear-regression-channel-mt4-03.avif)
![Linear Regression Channel Indicator Download for Meta Trader 4 - Free - [Trading Finder] 3](https://cdn.tradingfinder.com/image/30384/10-11-en-linear-regression-channel-mt4-04.avif)
The Linear Regression Channel Indicator is one of the Meta Trader 4 indicators that automatically draws regression channels on the price chart, allowing for the identification of Bullish-Bearish Trends based on the channel's slope.
In bullish trends, the channel slope is upward (positive), and in bearish trends, it is downward (negative). The level 2 lines of the channel (upper and lower lines) provide buy and sell signals to traders. Additionally, channel lines can serve as areas of Oversold, Overbought, Support-Resistance, and potential Reversal Points.
Indicator Table
Indicator Categories: | Signal & Forecast MT4 Indicators Bands & Channels MT4 Indicators Levels MT4 Indicators |
Platforms: | MetaTrader 4 Indicators |
Trading Skills: | Intermediate |
Indicator Types: | Reversal MT4 Indicators |
Timeframe: | Multi-Timeframe MT4 Indicators |
Trading Style: | Day Trading MT4 Indicators Scalper MT4 Indicators Swing Trading MT4 Indicators |
Trading Instruments: | Share Stocks MT4 Indicators Forward Market MT4 Indicators Stock Market MT4 Indicators Cryptocurrency MT4 Indicators Forex MT4 Indicators |
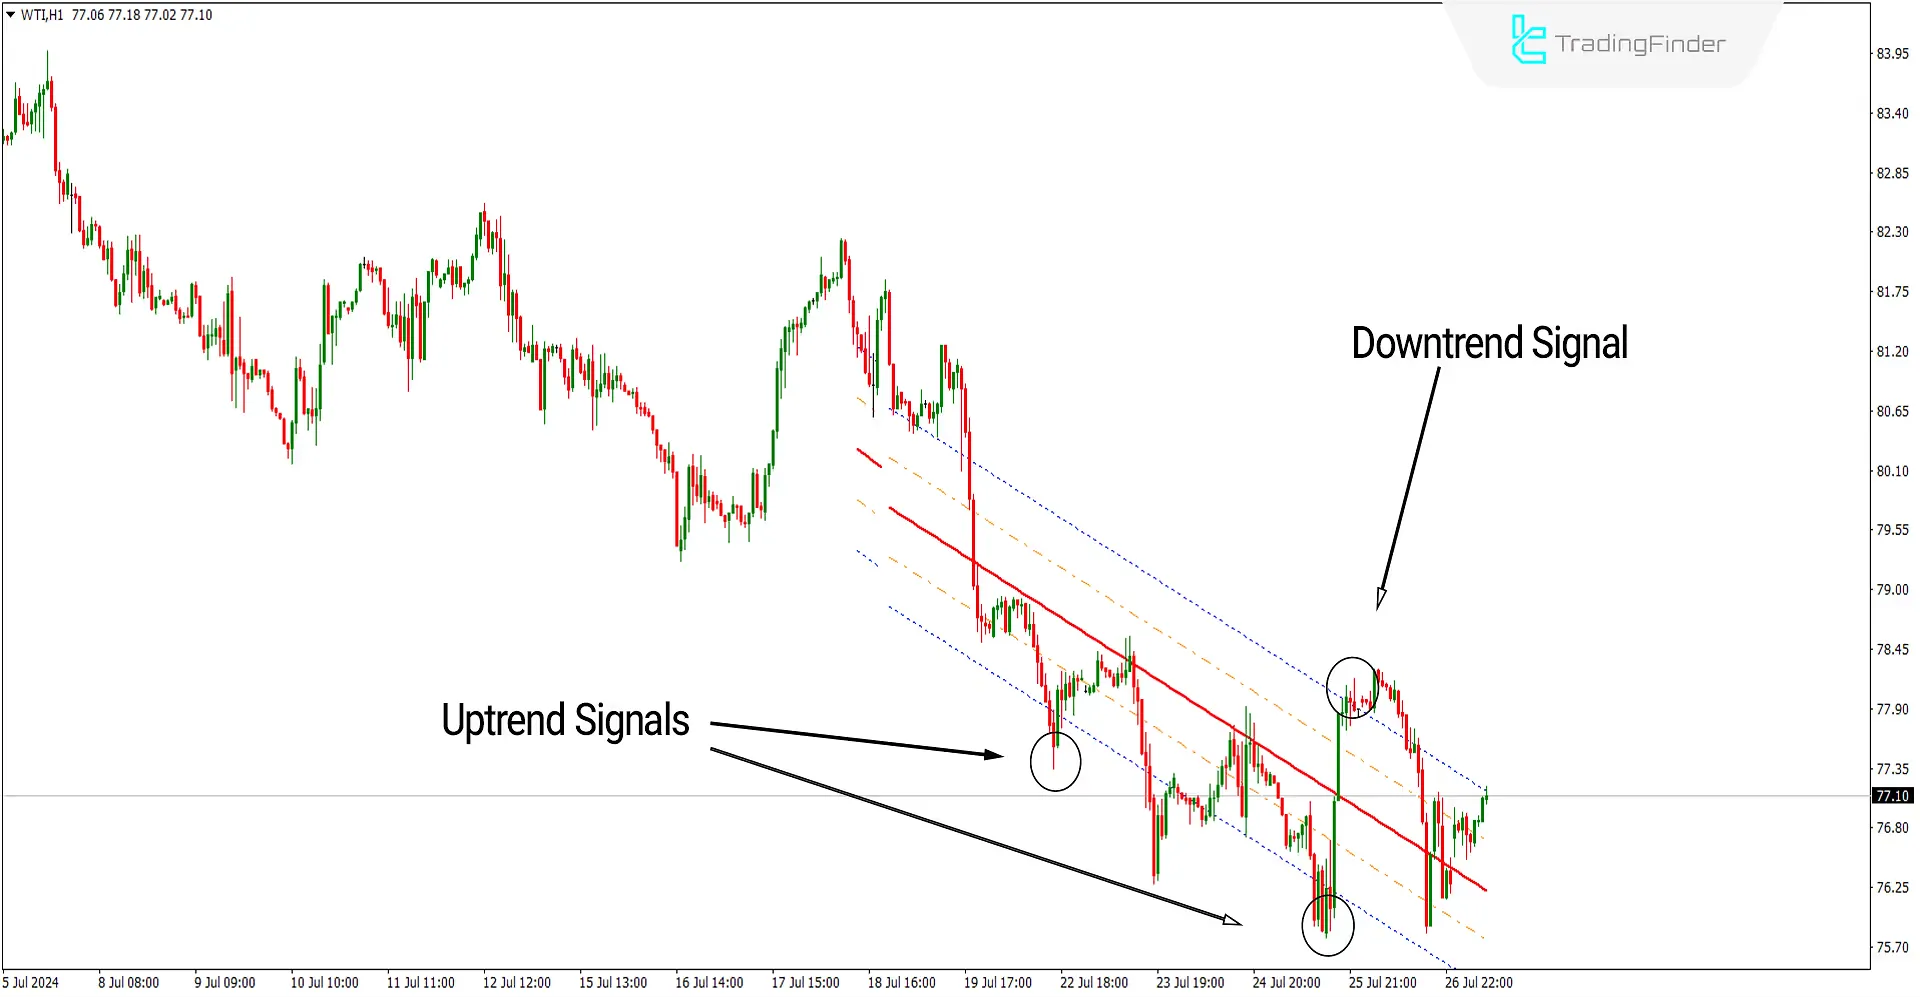
The image below shows a chart of the Texas oil price with the symbol [WTI] in a one-hour timeframe. The linear regression channel indicator, as shown in the image, consists of a middle line (red), two level 1 lines (orange), and two level 2 lines (blue).
When the price hits the upper channel line, sell signals are issued at the channel's top, and when the price hits the lower channel line, buy signals are issued at the channel's bottom.

Overview
The linear regression channel indicator is a technical analysis tool for identifying trends and support and resistance levels in financial markets like Forex.
Given the importance of recognizing trend direction and trading in line with it, this indicator uses statistical techniques and averages from the start to the end of trends to draw a suitable channel for identifying trend direction. Traders can use the slope of the linear regression channel to predict future price movements.
Buy Signal Conditions Indicator (Buy Position)
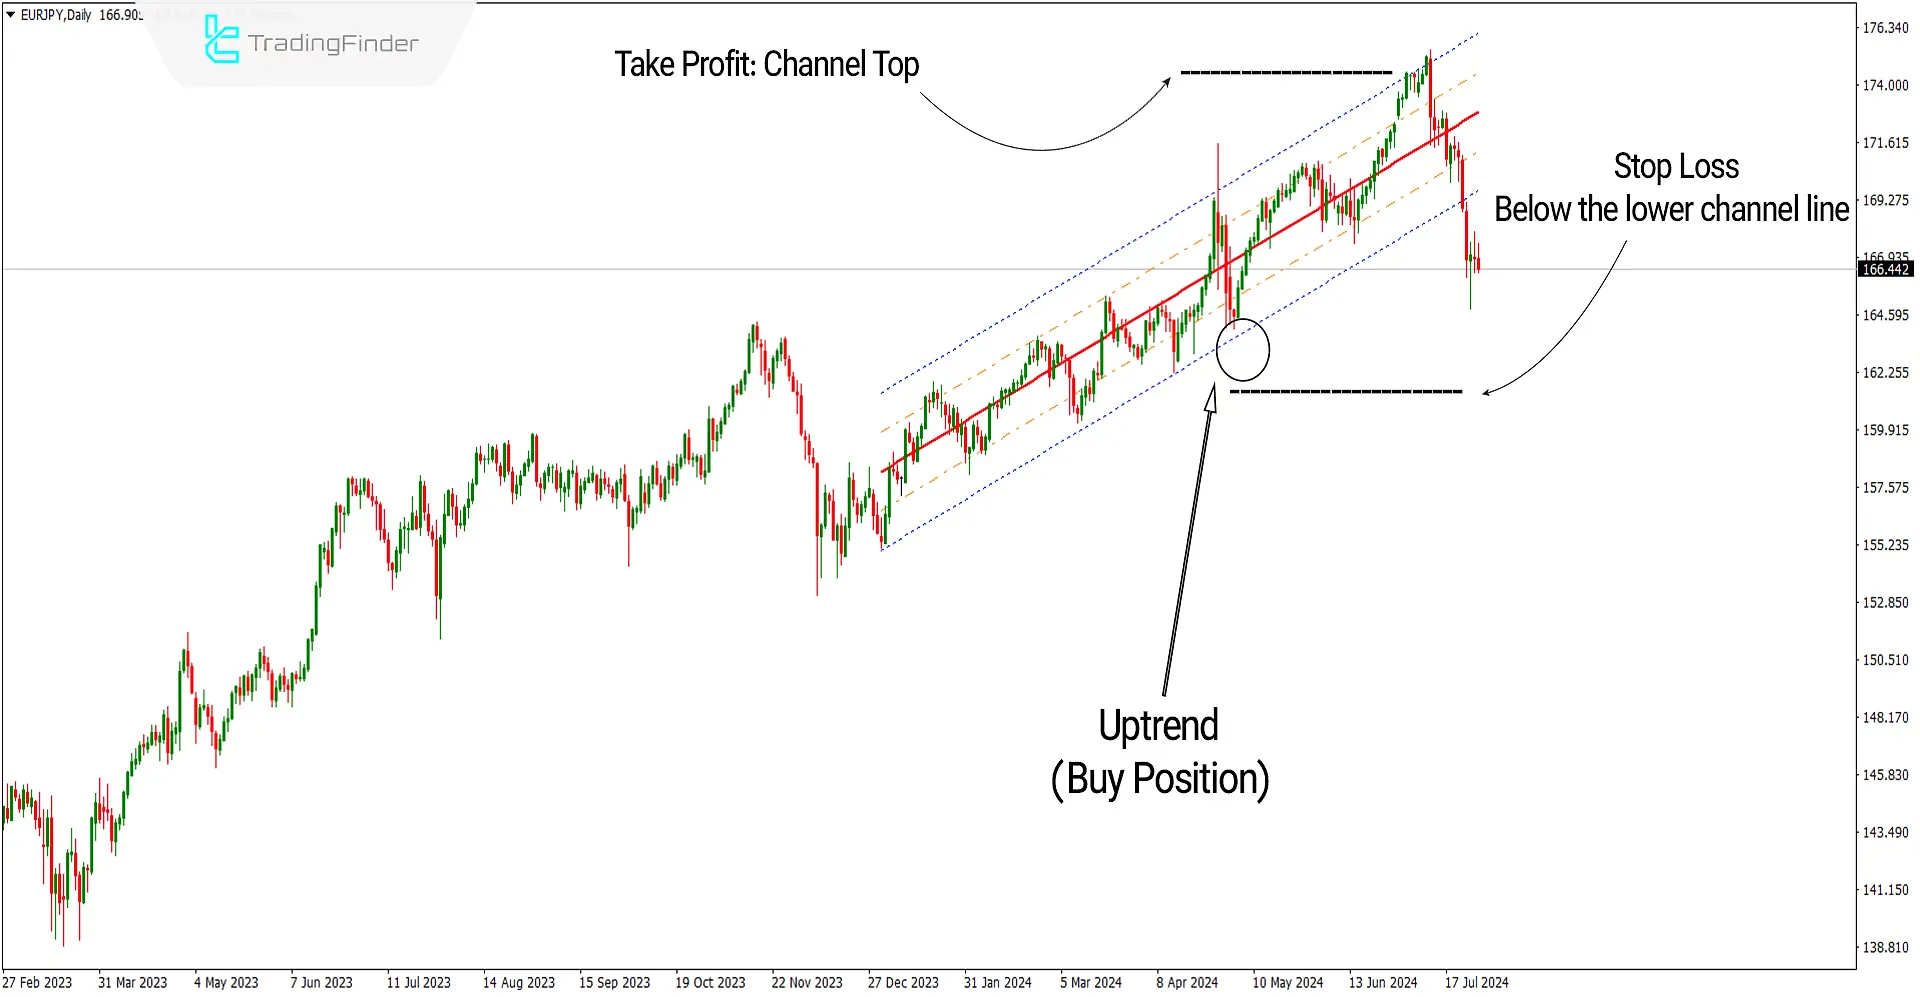
The image below shows the chart of the EUR/JPY currency pair on a daily timeframe. The price in the circle shows the channel's bottom line, which causes the channel to play its support role and start an uptrend. Under these conditions, one can look for buying opportunities.
Take Profit and Stop Loss for Buy Signal
For setting a stop loss, consider a few pips below the lower channel line, and for profit, put it at the upper channel line.

Sell Signal Conditions Indicator (Sell Positions)
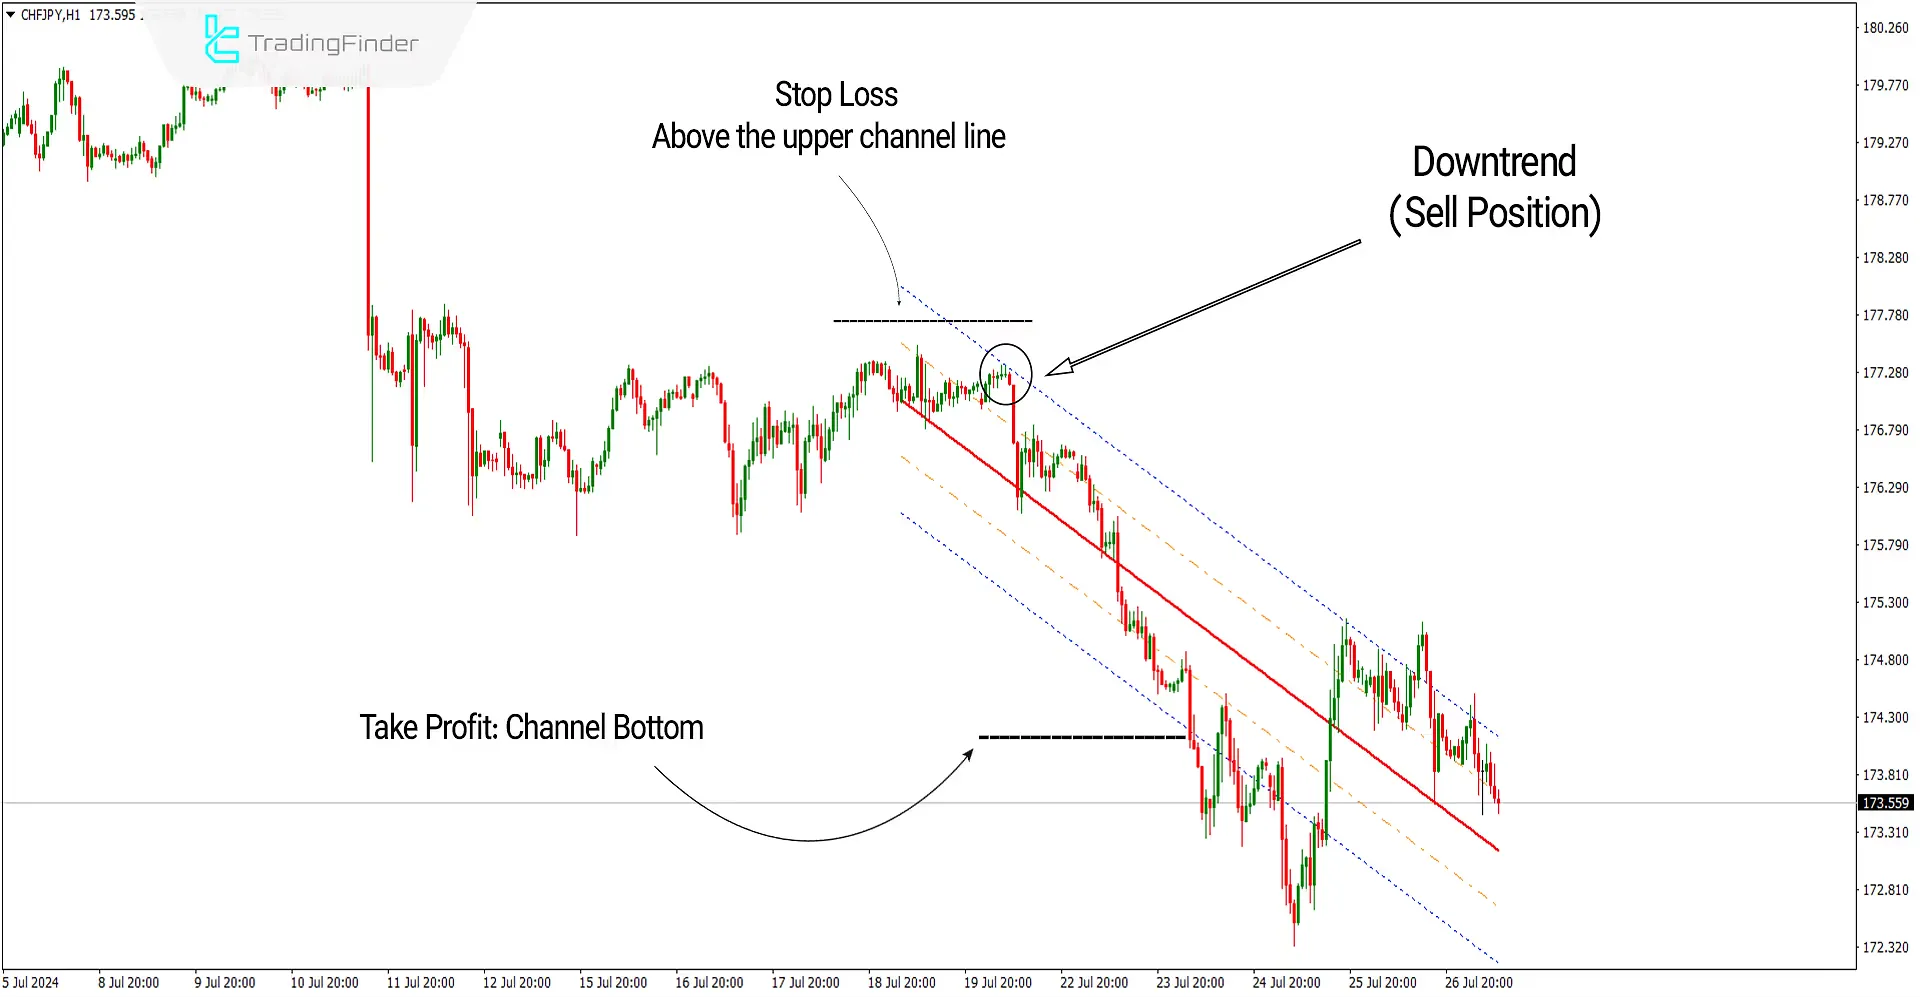
The image below shows the chart of the Swiss Franc to Japanese Yen currency pair [CHFJPY] in a one-hour timeframe. The price in the circle hits the upper channel line, which acts as resistance, starting a downtrend. Under these conditions, one can look for selling opportunities.
Take Profit and Stop Loss for Sell Signal
For setting a stop loss, consider a few pips above the upper channel line, and for profit, put it at the lower channel line.

Settings of the Linear Regression Channel Indicator

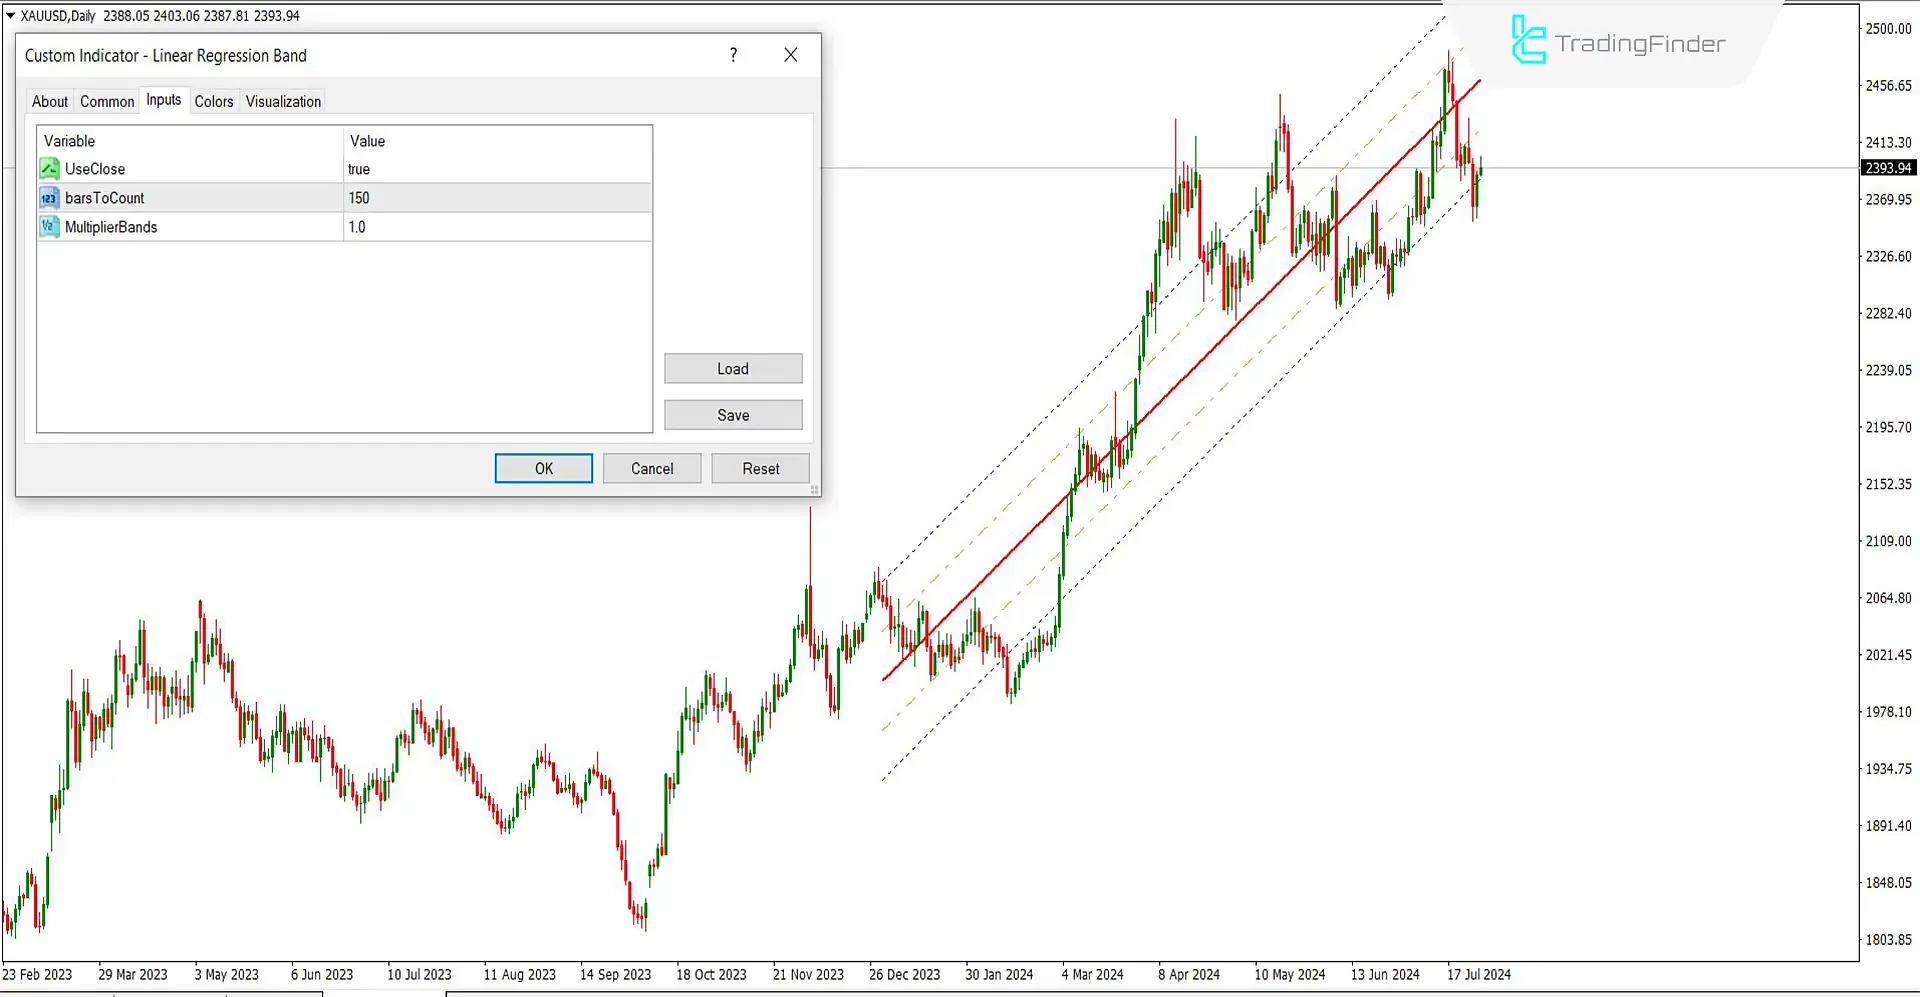
- Use Close: The calculation criterion should be accurate based on the closing price.
- Bars To Count: The number of candles used for calculation is 150.
- Multiplier Bands: The multiplier distance of level 1 and 2 lines from the middle line is 1.
Note: In the colors section, you can select the colors for each line according to your background color preference.
Summary
The linear regression channel indicator aids in identifying trends and price fluctuations and can be an effective tool in risk management and trading decisions. However, to avoid common mistakes, this Band and channel indicator should be used in conjunction with other technical analysis tools and attention to overall market conditions.
Linear Regression Channel Meta MT4 PDF
Linear Regression Channel Meta MT4 PDF
Click to download Linear Regression Channel Meta MT4 PDFWhat is the difference between the Indicator and a moving average?
The linear regression channel indicator predicts the expected price position based on a regression line rather than calculating the average of past prices, which allows for a quicker response to price changes.
How is the Linear Regression Channel Indicator calculated?
Using statistical techniques, the Linear Regression Channel Indicator automatically calculates the overall price path over a specific timeframe. Parallel lines are also placed at a defined distance above and below this line to form the channel.


