![Moving Average Rainbow Indicator MT4 Download – Free – [TradingFinder]](https://cdn.tradingfinder.com/image/476233/13-177-en-ma-rainbow-mt4-01.webp)
![Moving Average Rainbow Indicator MT4 Download – Free – [TradingFinder] 0](https://cdn.tradingfinder.com/image/476233/13-177-en-ma-rainbow-mt4-01.webp)
![Moving Average Rainbow Indicator MT4 Download – Free – [TradingFinder] 1](https://cdn.tradingfinder.com/image/476232/13-177-en-ma-rainbow-mt4-02.webp)
![Moving Average Rainbow Indicator MT4 Download – Free – [TradingFinder] 2](https://cdn.tradingfinder.com/image/476236/13-177-en-ma-rainbow-mt4-03.webp)
![Moving Average Rainbow Indicator MT4 Download – Free – [TradingFinder] 3](https://cdn.tradingfinder.com/image/476235/13-177-en-ma-rainbow-mt4-04.webp)
The Rainbow Moving Average Indicator (MA Rainbow) is a set of eight moving averages that indicate upward and downward price trends, as well as trend reversals.
The price's position relative to this set of moving averages (MA) can highlight potential buy and sell trade opportunities.
Specification Table of Rainbow Moving Average Indicator
The following table describes the specifications of the MA Rainbow Indicator.
Indicator Categories: | Trading Assist MT4 Indicators Bands & Channels MT4 Indicators |
Platforms: | MetaTrader 4 Indicators |
Trading Skills: | Intermediate |
Indicator Types: | Overbought and Oversold MT4 Indicators Reversal MT4 Indicators |
Timeframe: | Multi-Timeframe MT4 Indicators |
Trading Style: | Day Trading MT4 Indicators Scalper MT4 Indicators Swing Trading MT4 Indicators |
Trading Instruments: | Stock Market MT4 Indicators Cryptocurrency MT4 Indicators Forex MT4 Indicators |
Rainbow MA Indicator at a Glance
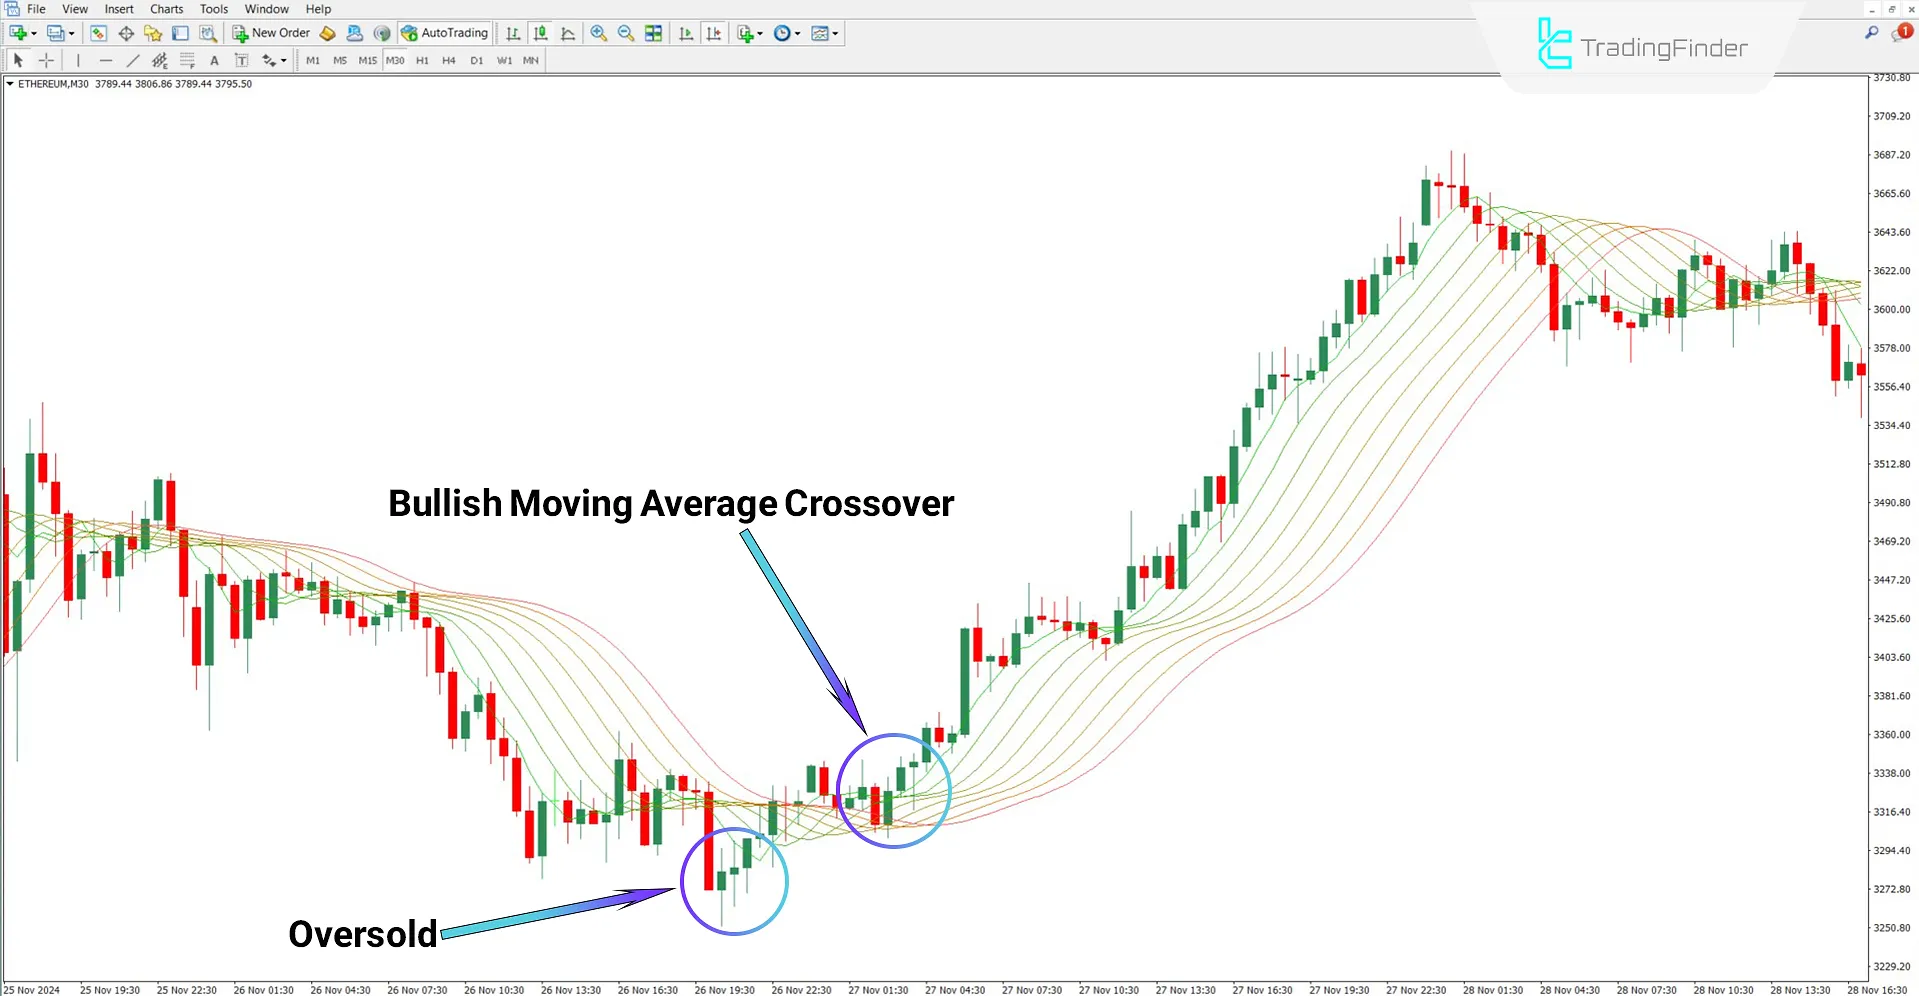
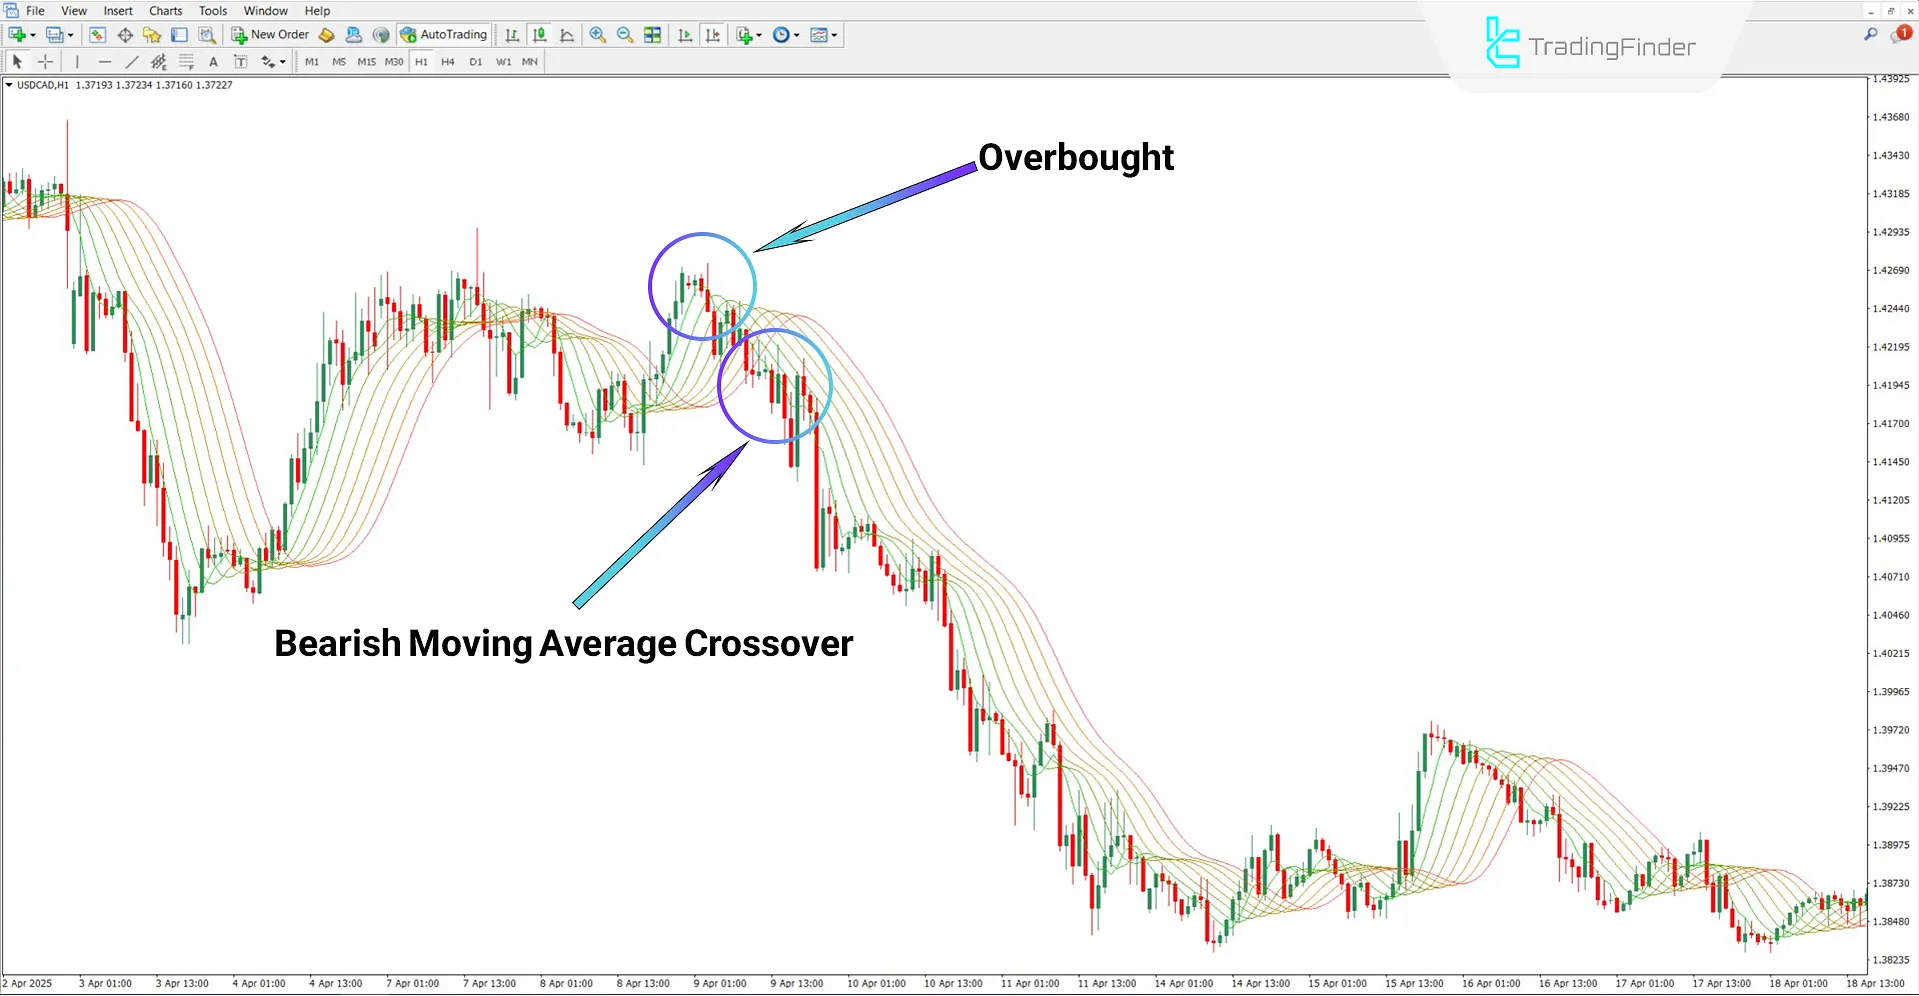
The Rainbow Moving Average Indicator, in addition to identifying bullish and bearish trends, also plays an important role in detecting overbought and oversold zones.
Given this feature, one can anticipate trend reversals in these zones and consider entering counter-trend trades.
Buy Trade Setup
According to the Ethereum (ETH) chart in the 30-minute timeframe, the price reaches the last moving average line (green line), which signals the maximum level or an oversold zone.
A price reversal and upward crossover of the moving averages can be considered a buy entry opportunity.

Sell Trade Setup
Based on the USD/CAD chart in the 1-hour timeframe, the price reaches the overbought zone, then reverses and breaks below the moving averages.
In this case, the dominant scenario is bearish, and each touch of the moving averages can be considered a sell trade opportunity.

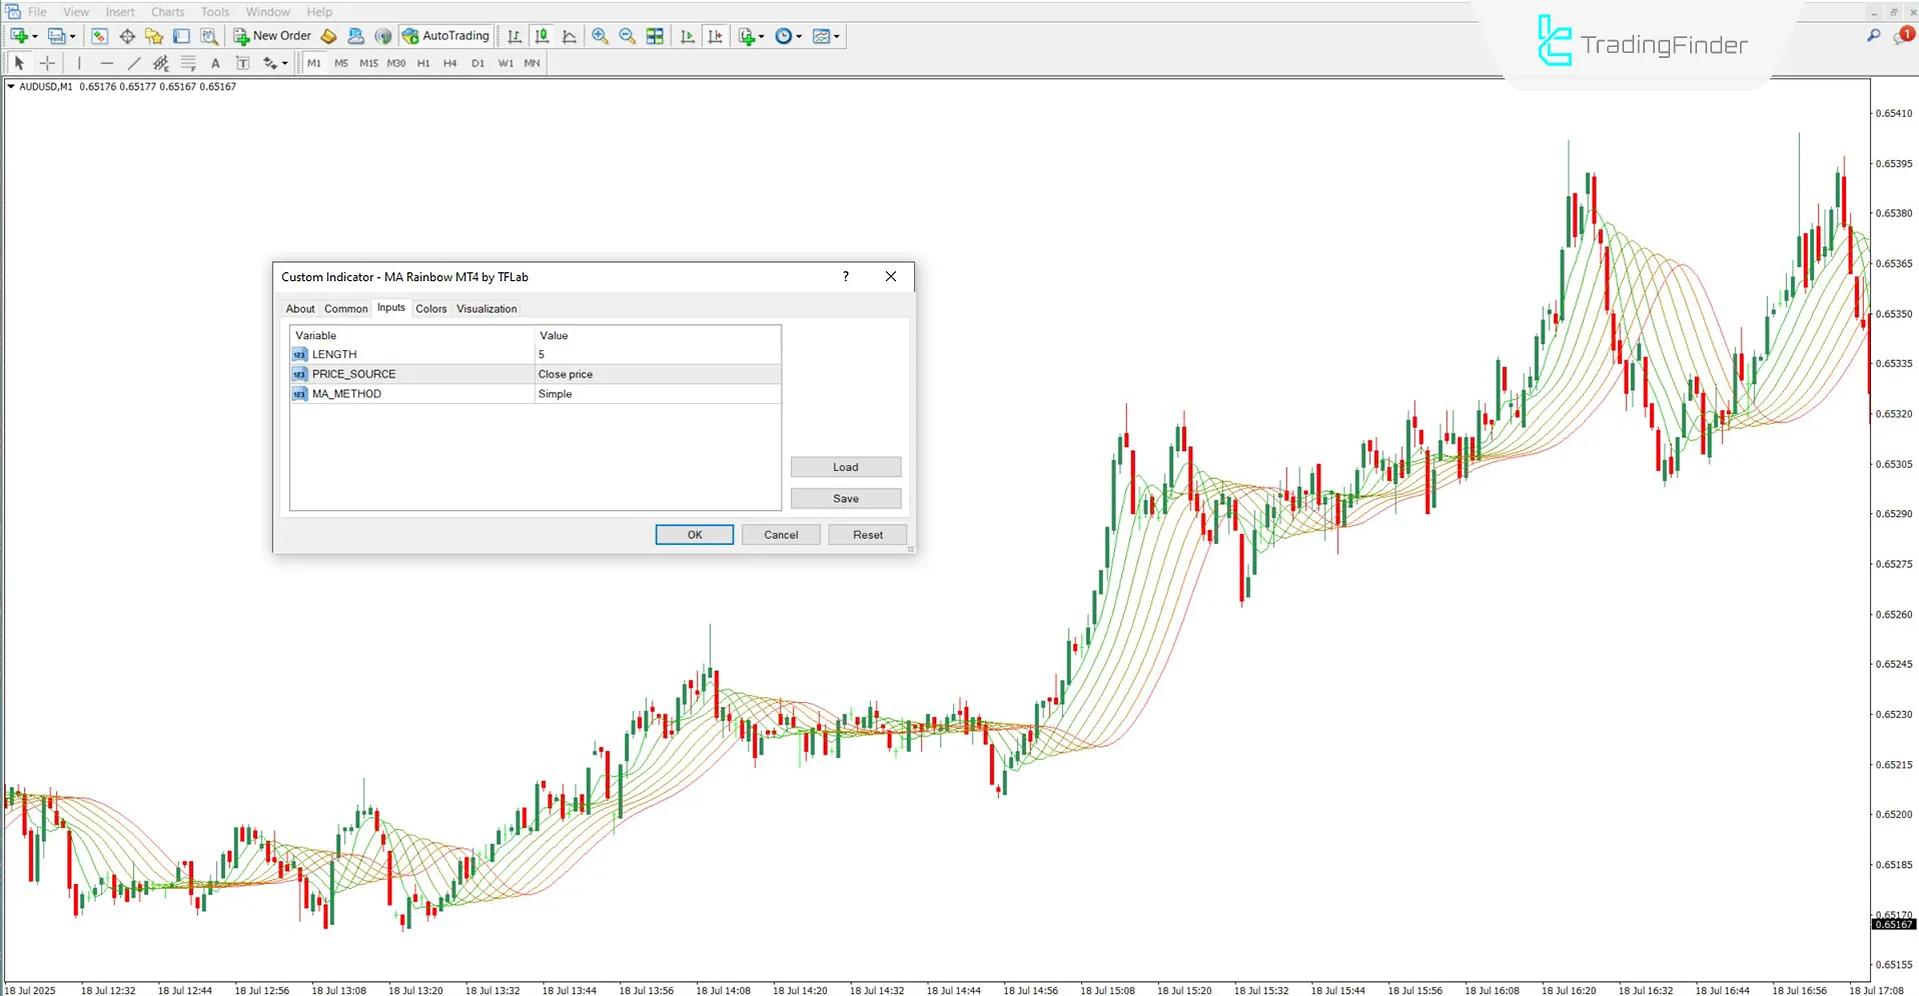
Rainbow MA Indicator Settings
Settings of the Rainbow Moving Average Indicator are as follows:

- LENGTH: Number of candles used to calculate the moving average
- PRICE_SOURCE: Defines which part of the candle to use for calculation
- MA_METHOD: Selection of moving average type
Conclusion
The Rainbow Moving Average Indicator is designed to display directional trend changes in the MetaTrader 4 platform. Besides showing trend direction, it also highlights overbought and oversold areas that can serve as good entry points for trades.
In normal market conditions, the price crossing above or below the moving averages is used as a signal to enter a trade in the direction of the trend.
Moving Average Rainbow Indicator MT4 PDF
Moving Average Rainbow Indicator MT4 PDF
Click to download Moving Average Rainbow Indicator MT4 PDFWhen is the market considered overbought?
When the price reaches and crosses above the uppermost moving average lines (typically green or light yellow).
Is this indicator suitable for all timeframes?
Yes, the Rainbow Moving Average Indicator can be used on all timeframes.


