![MACD 2 Color Histogram Indicator MT4 Download – Free – [TradingFinder]](https://cdn.tradingfinder.com/image/505691/13-191-en-macd-2-color-histogram-mt4-01.webp)
![MACD 2 Color Histogram Indicator MT4 Download – Free – [TradingFinder] 0](https://cdn.tradingfinder.com/image/505691/13-191-en-macd-2-color-histogram-mt4-01.webp)
![MACD 2 Color Histogram Indicator MT4 Download – Free – [TradingFinder] 1](https://cdn.tradingfinder.com/image/505687/13-191-en-macd-2-color-histogram-mt4-02.webp)
![MACD 2 Color Histogram Indicator MT4 Download – Free – [TradingFinder] 2](https://cdn.tradingfinder.com/image/505688/13-191-en-macd-2-color-histogram-mt4-03.webp)
![MACD 2 Color Histogram Indicator MT4 Download – Free – [TradingFinder] 3](https://cdn.tradingfinder.com/image/505690/13-191-en-macd-2-color-histogram-mt4-04.webp)
The MACD 2 Color Histogram indicator is developed for analyzing market momentum and displaying suitable entry points for trades.
This trading tool displays histograms in two colors; green histograms indicate bullish momentum, while red histograms indicate bearish momentum.
MACD 2 Color Histogram Oscillator Specifications Table
The table below shows the specifications of the MACD 2 Color Histogram indicator.
Indicator Categories: | Oscillators MT4 Indicators Signal & Forecast MT4 Indicators Currency Strength MT4 Indicators |
Platforms: | MetaTrader 4 Indicators |
Trading Skills: | Elementary |
Indicator Types: | Reversal MT4 Indicators |
Timeframe: | Multi-Timeframe MT4 Indicators |
Trading Style: | Day Trading MT4 Indicators Scalper MT4 Indicators Swing Trading MT4 Indicators |
Trading Instruments: | Stock Market MT4 Indicators Cryptocurrency MT4 Indicators Forex MT4 Indicators |
MACD 2 Color Histogram Indicator at a Glance
Trading signals in the MACD 2 Color Histogram oscillator are determined based on the crossover of the MACD line with the signal line.
If the crossover is upward, it indicates a buy trading opportunity, and conversely, a downward crossover indicates a sell opportunity.
Buy Trade
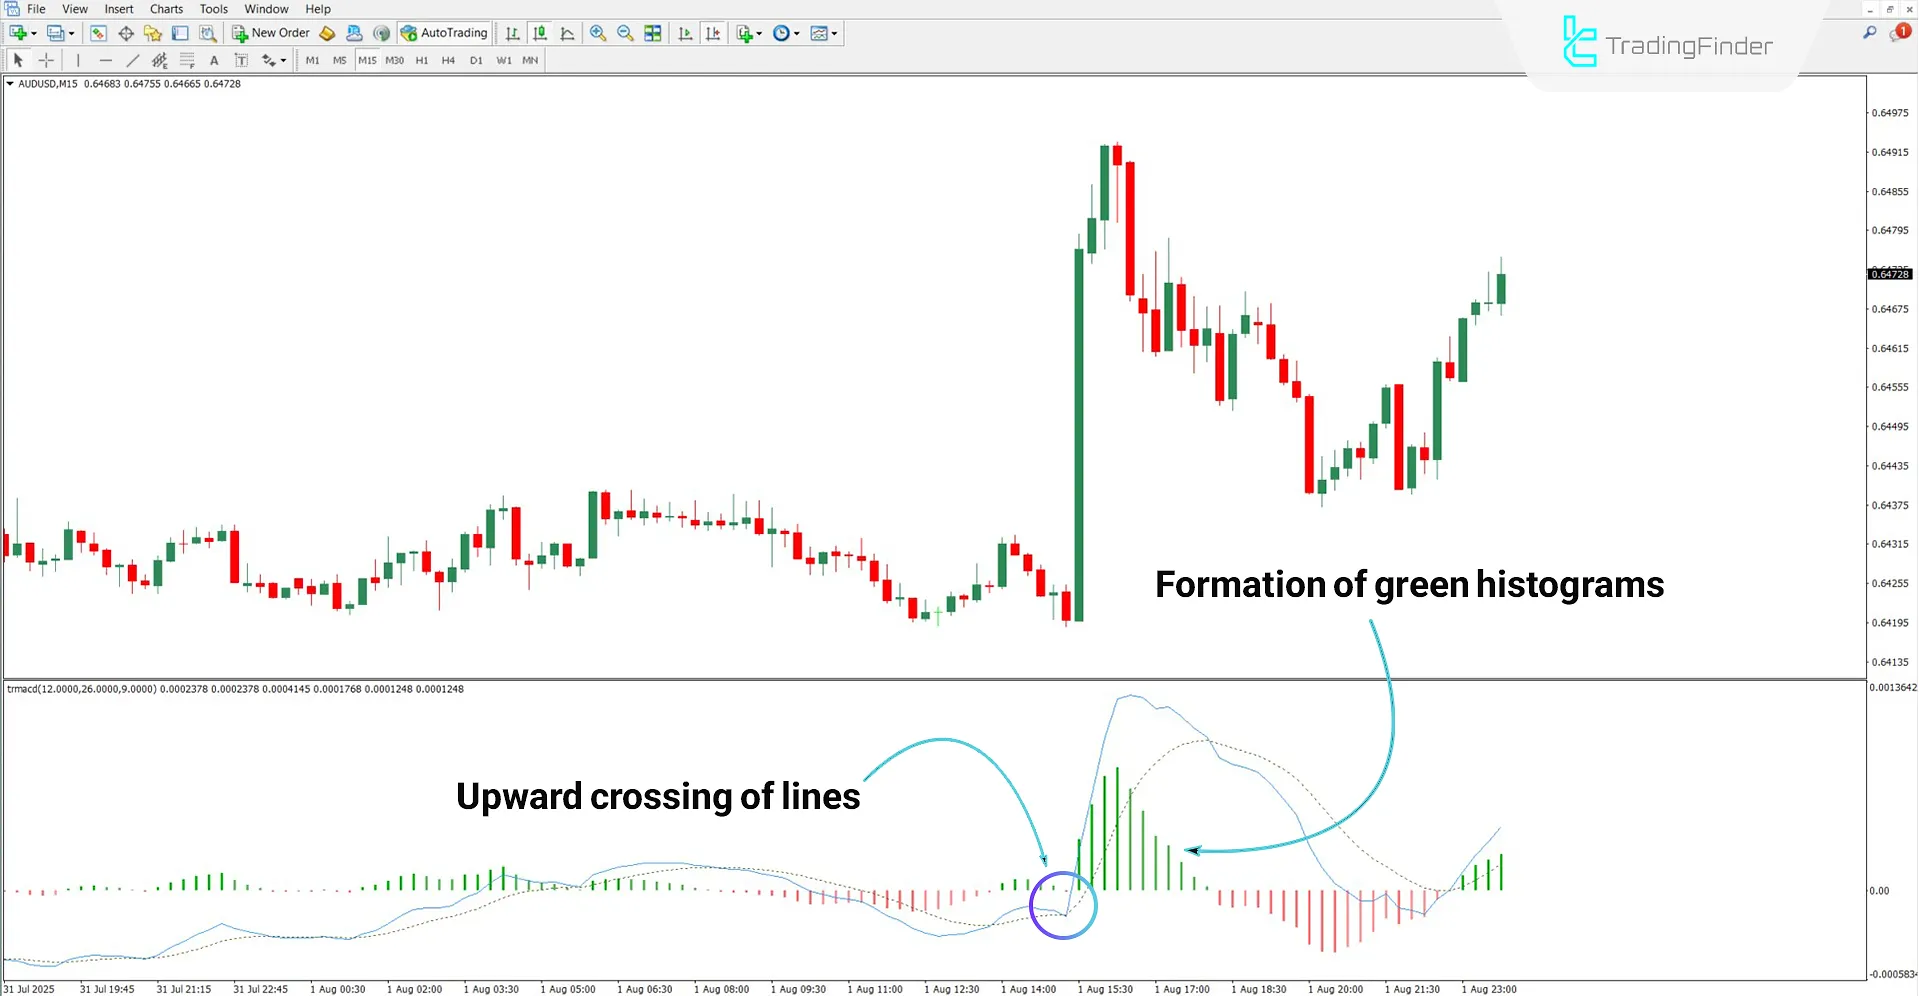
In the example of the 15-minute chart for the Australian Dollar to US Dollar (AUD/USD), the upward crossover of the MACD line with the signal line represents a suitable entry point for buy trades.
Additionally, the formation of green histograms confirms the strength of bullish momentum.

Sell Trade
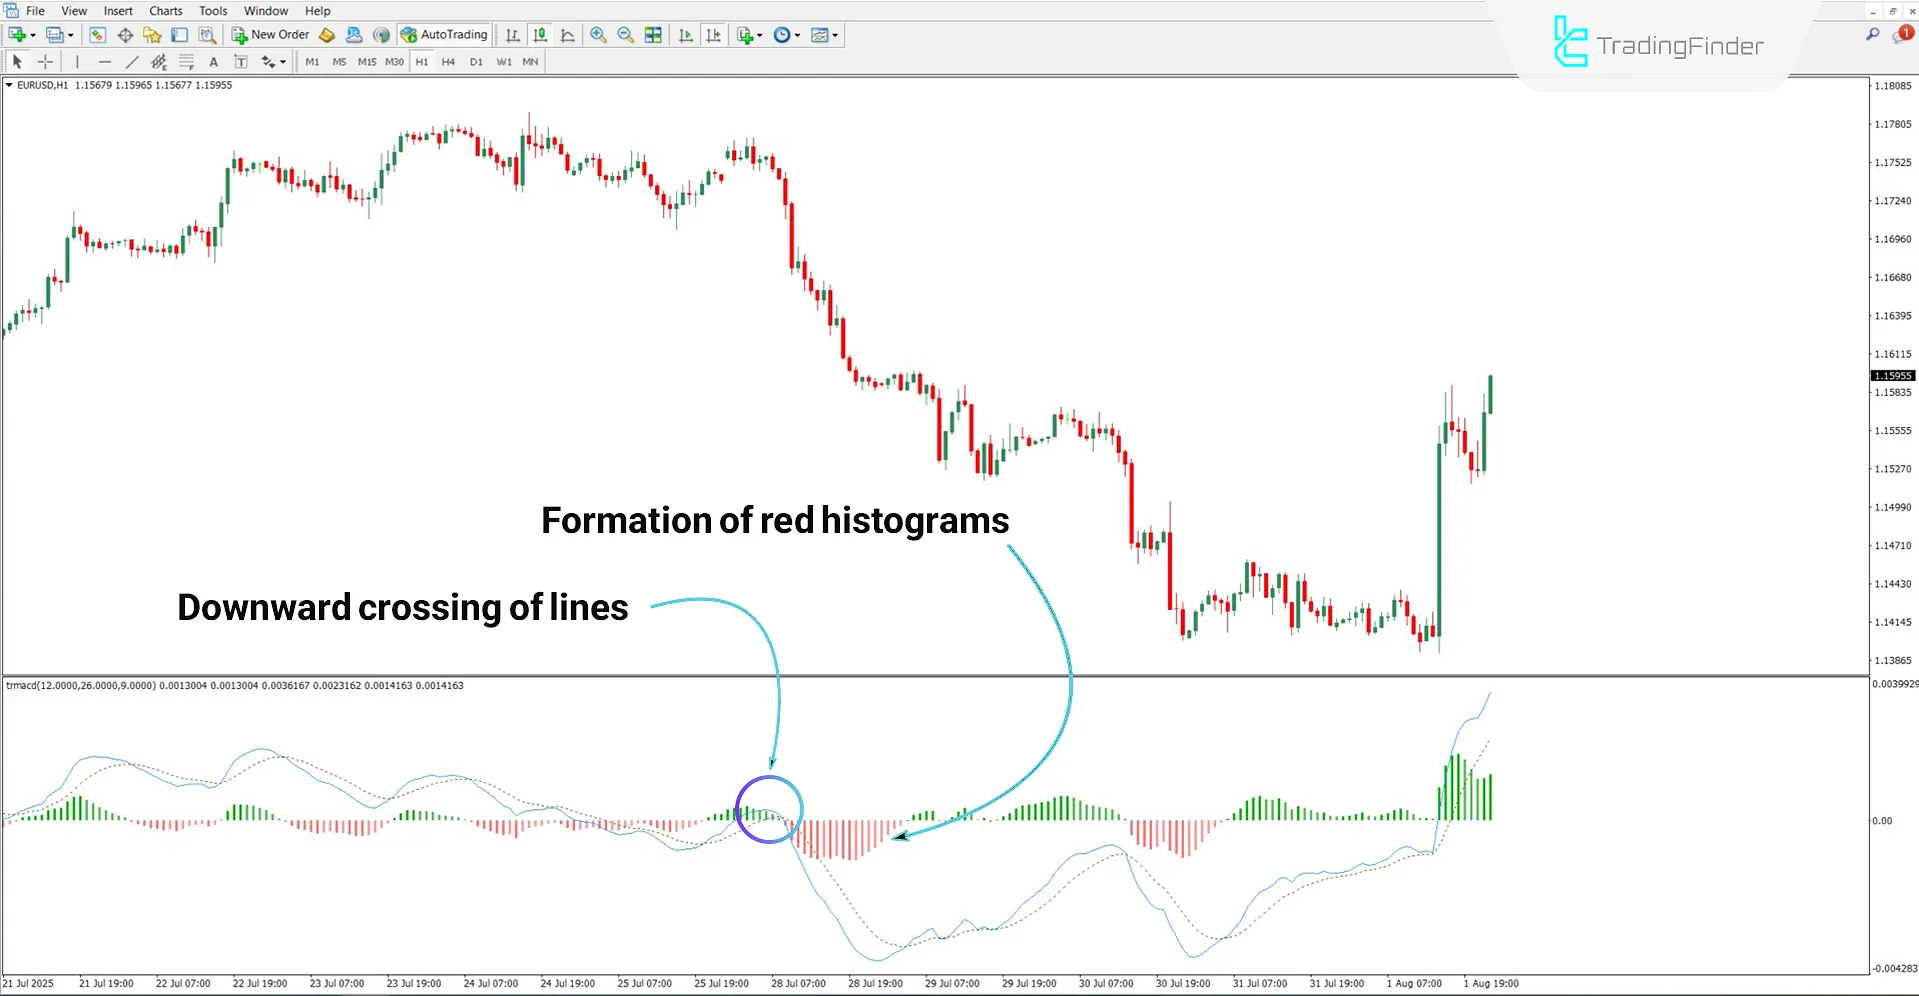
Based on the EUR/USD pair chart in the 1-hour timeframe, the identified crossover point is considered a sell entry signal.
Moreover, as long as red histograms continue to form consecutively, the bearish trend is likely to persist.

MACD 2 Color Histogram Indicator Settings
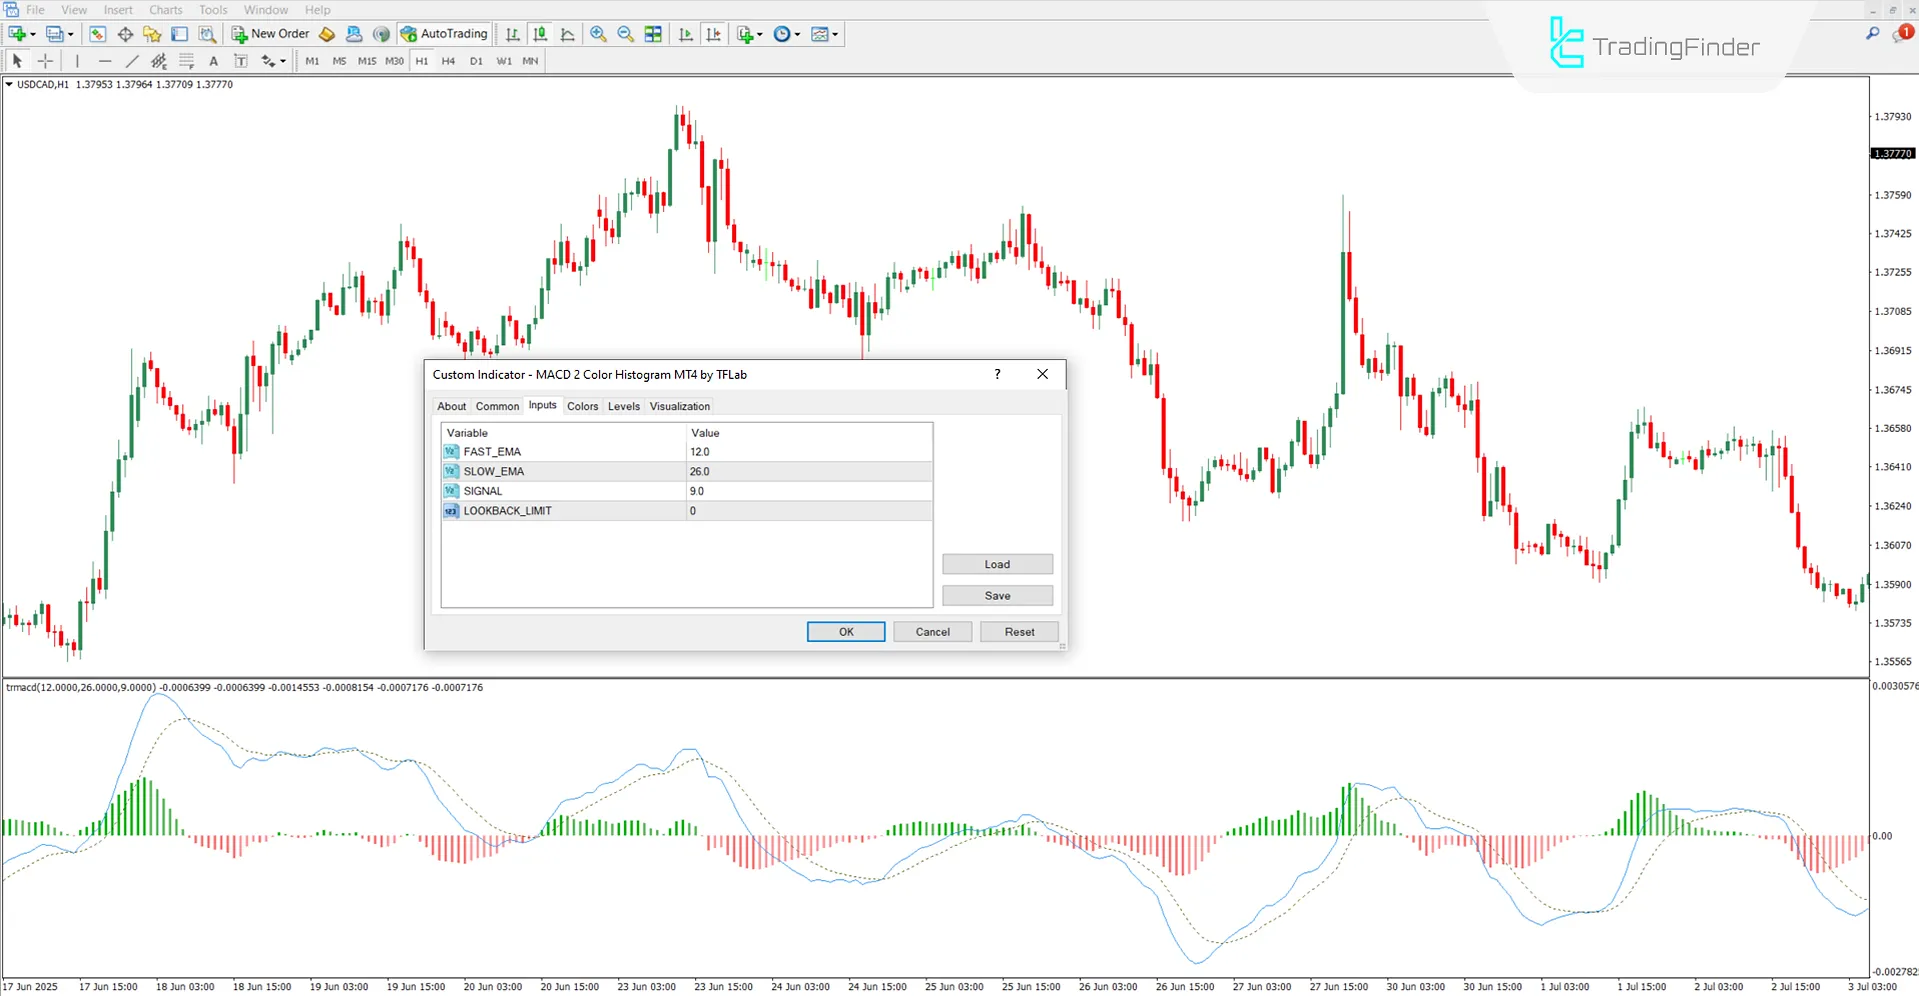
The specifications of the MACD 2 Color Histogram oscillator are as follows:

- FAST_EMA: Fast moving average calculations
- SLOW_EMA: Slow moving average calculations
- SIGNAL: Exponential moving average calculations for the signal line
- LOOKBACK_LIMIT: Lookback range limiter for display or calculation
Conclusion
The MACD 2 Color Histogram oscillator, through changes in histogram colors, identifies momentum strength and the bullish or bearish state of the trend.
In addition, the crossover of the MACD lines with the oscillator’s signal line displays suitable entry points for buy and sell trades.
Users can also modify the calculations of fast, slow, and other moving averages in the settings section.
MACD 2 Color Histogram Indicator MT4 PDF
MACD 2 Color Histogram Indicator MT4 PDF
Click to download MACD 2 Color Histogram Indicator MT4 PDFDoes this indicator only apply to the Forex market?
No, this indicator can be used without any limitations in all markets.
What does the consecutive formation of red histograms mean?
The consecutive display of red bars indicates the level of bearish trend momentum.


