![MACD 2 Line Oscillator for MT4 Download - Free [TradingFinder]](https://cdn.tradingfinder.com/image/168244/13-10-en-macd2l-mt4-1.webp)
![MACD 2 Line Oscillator for MT4 Download - Free [TradingFinder] 0](https://cdn.tradingfinder.com/image/168244/13-10-en-macd2l-mt4-1.webp)
![MACD 2 Line Oscillator for MT4 Download - Free [TradingFinder] 1](https://cdn.tradingfinder.com/image/168242/13-10-en-macd2l-mt4-2.webp)
![MACD 2 Line Oscillator for MT4 Download - Free [TradingFinder] 2](https://cdn.tradingfinder.com/image/168241/13-10-en-macd2l-mt4-3.webp)
![MACD 2 Line Oscillator for MT4 Download - Free [TradingFinder] 3](https://cdn.tradingfinder.com/image/168243/13-10-en-macd2l-mt4-4.webp)
The MACD 2 Line Indicator is an updated and advanced version of the "MACD" oscillator for Meta Trader 4.
This trading tool improves trading signals by displaying two moving average lines (EMA) in different colors and a volume histogram separately from the price chart.
It also provides a zero line that helps traders easily identify overbought and oversold zones.
Specifications Table for the 2 Line MACD Indicator
This table includes some of the prominent features of the indicator:
Indicator Categories: | Oscillators MT4 Indicators Signal & Forecast MT4 Indicators Currency Strength MT4 Indicators MACD Indicators for MetaTrader 4 |
Platforms: | MetaTrader 4 Indicators |
Trading Skills: | Intermediate |
Indicator Types: | Reversal MT4 Indicators |
Timeframe: | Multi-Timeframe MT4 Indicators |
Trading Style: | Day Trading MT4 Indicators |
Trading Instruments: | Share Stocks MT4 Indicators Forward Market MT4 Indicators Indices Market MT4 Indicators Commodity Market MT4 Indicators Stock Market MT4 Indicators Cryptocurrency MT4 Indicators Forex MT4 Indicators |
MACD 2 Line Indicator Overview
The MACD 2 Line Indicator uses moving averages (EMA) and a histogram for trend analysis and signaling. The moving averages include a fast and a slow line, typically displayed in blue and red. The histogram shows buying pressure in green and selling pressure in red above and below the zero line.
Uptrend Conditions
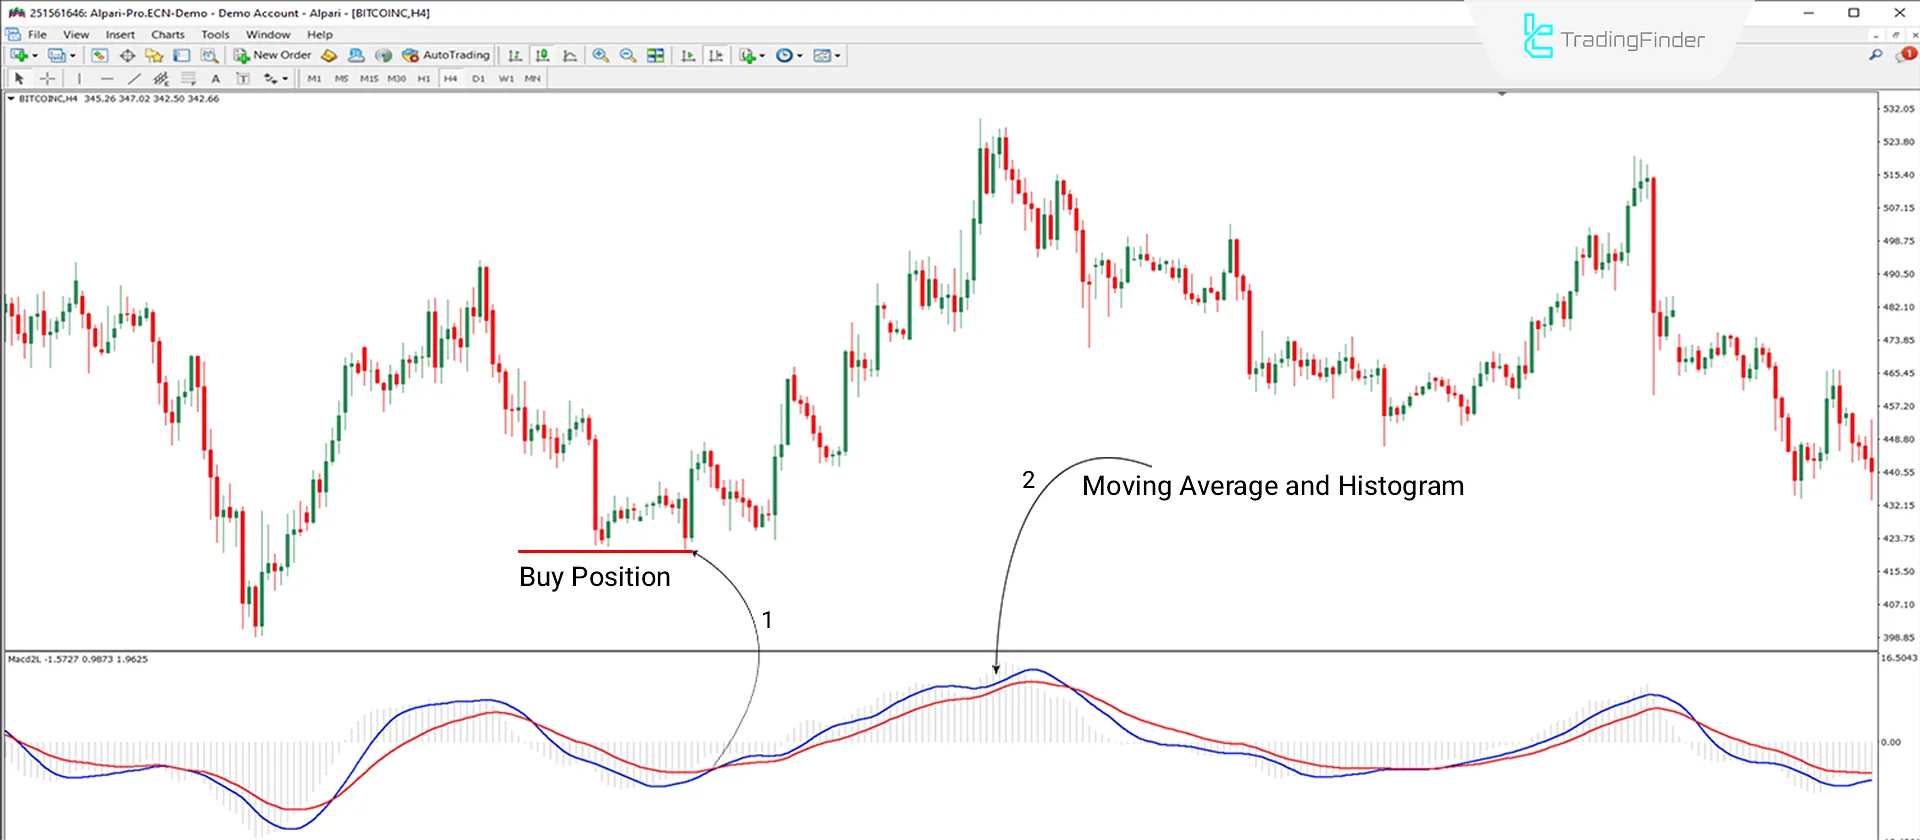
The 4-hour Bitcoin (BTC) price chart demonstrates how the MACD 2 Line Indicator works under uptrend conditions.
As shown in Arrow 1, the fast EMA (blue line) first crosses the slow EMA (red line) from below, signalling the beginning of an uptrend and an opportunity to enter a long position.
As indicated by Arrow 2, both the fast moving average and the histogram are above the zero line.

Downtrend Conditions
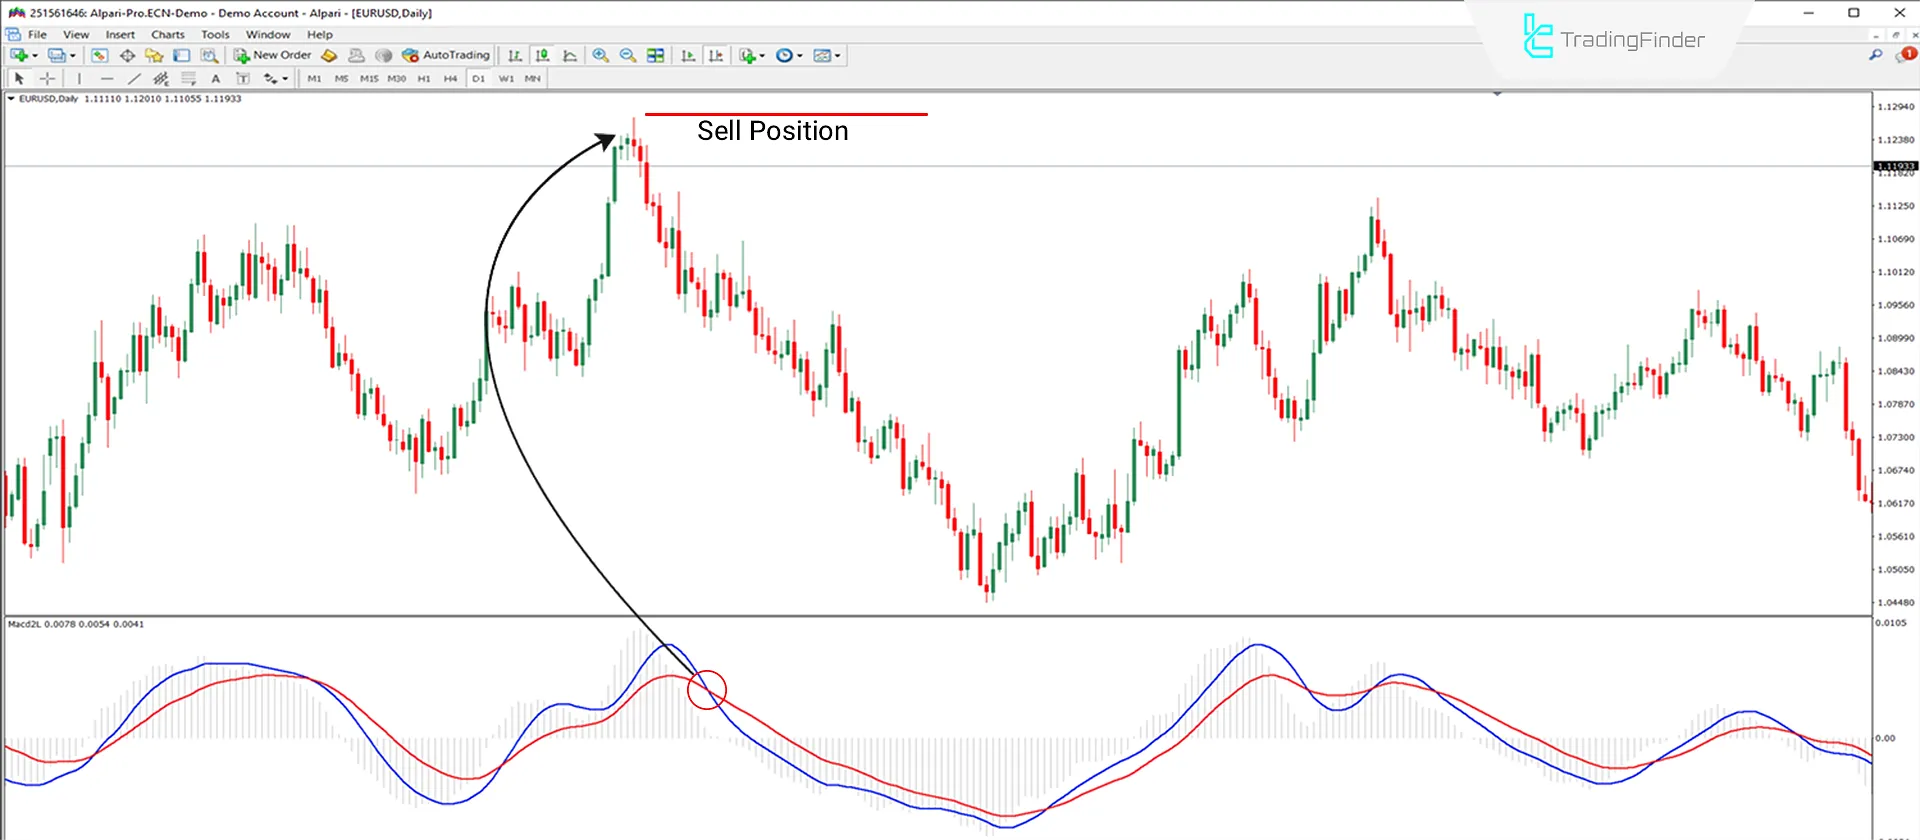
The daily chart of the EUR/USD currency pair shows how the MACD 2 Line Indicator works under downtrend conditions. The arrow shows that the fast EMA (blue line) first crosses the slow EMA (red line) from above.
Crossing the blue line below the red line can signal to enter a sell position. Afterwards, both moving averages and the histogram are below the zero line.

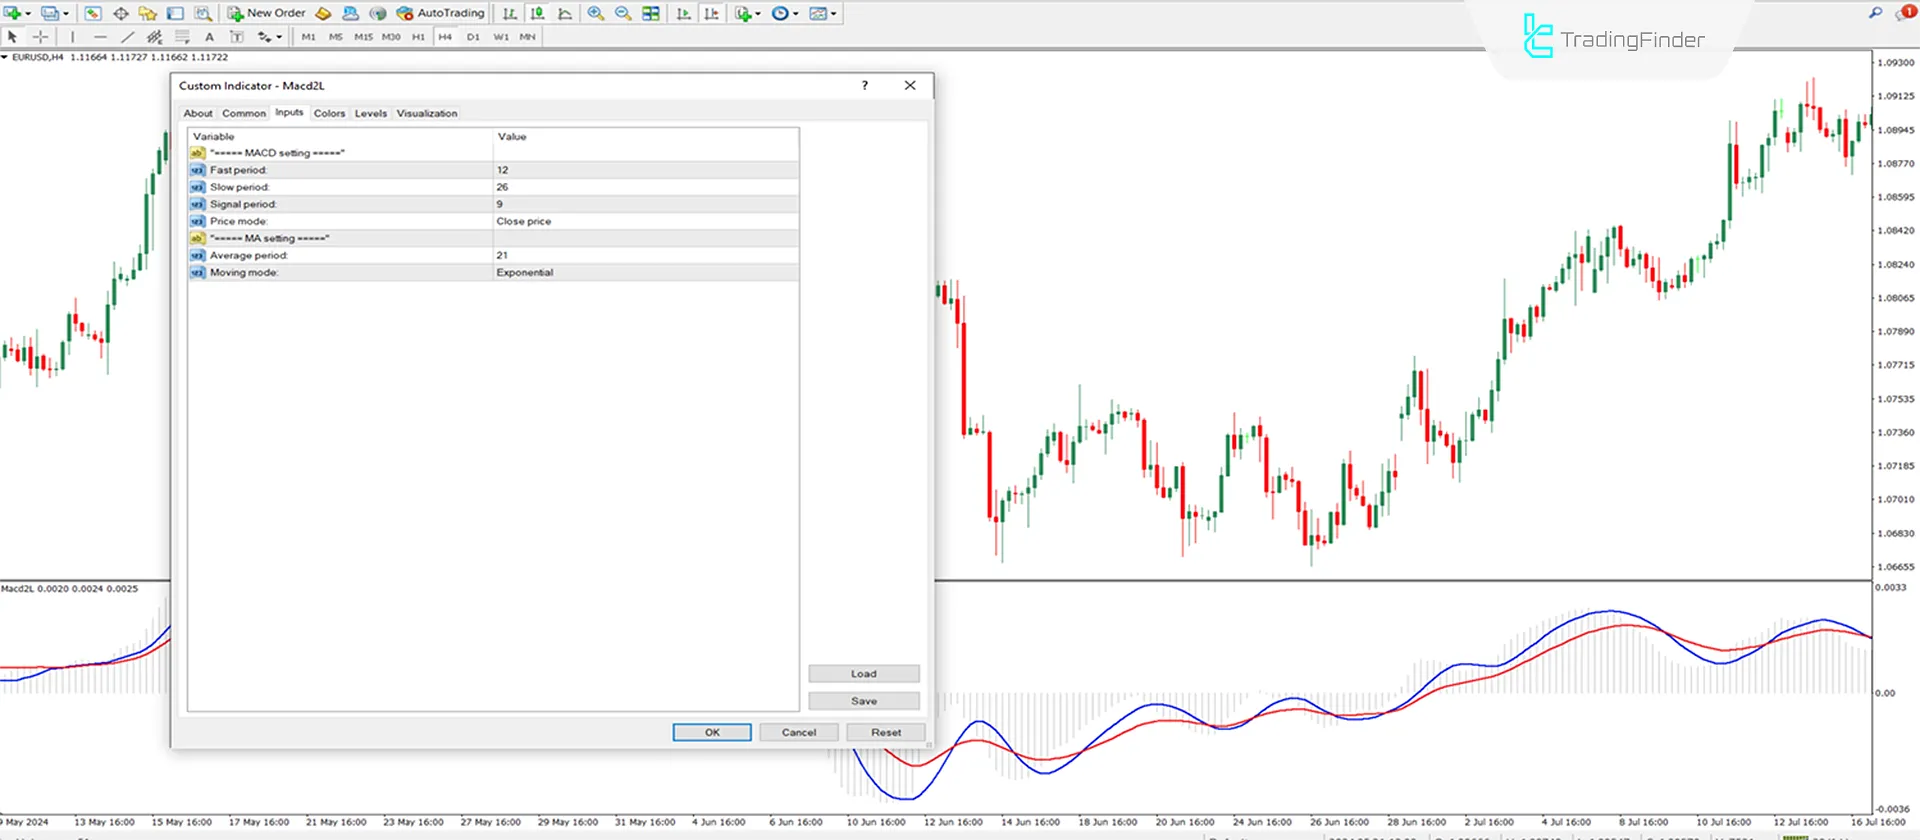
Indicator Settings
The customizable features of the indicator for a better user experience are presented in this section:

- Fast Period: The fast-moving average line is set to 12;
- Slow Period: The slow-moving average line is set to 26;
- Signal Period: The exponential moving average (EMA) is set to 9;
- Price Mode: The moving average is calculated based on the closing prices of the candles;
- Average Period: The number of candles considered for calculating the moving average is 21;
- Moving Mode: Settings related to the type of moving average.
Conclusion
The MACD 2 Line Indicator provides moving averages, volume histograms, and a zero line to help traders identify optimal entry and exit points.
This powerful oscillator and other technical analysis tools, helps traders improve their trading strategy and analysis accuracy.
MACD 2 Line Oscillator MT4 PDF
MACD 2 Line Oscillator MT4 PDF
Click to download MACD 2 Line Oscillator MT4 PDFHow does the MACD 2 Line Indicator display trend reversals?
When the histogram volume decreases and the moving average lines (EMA) approach the zero line, it indicates that the trend may be reversing.
How can an uptrend be identified using this indicator?
When the fast-moving average line (Fast EMA) crosses the slow-moving average line (Slow EMA) from below and oscillates above the zero line.
can you provide .mq5 ? Thanx
Here is the link to your desired indicator for MetaTrader 5. At the top of the page, you can choose between MetaTrader 4, MetaTrader 5, or TradingView. https://tradingfinder.com/products/indicators/mt5/macd-2-line-free-download/


