![MACD 3 Color Indicator MT4 Download - Free - [TFlab]](https://cdn.tradingfinder.com/image/156324/13-28-en-macd-3-color-mt4-1.webp)
![MACD 3 Color Indicator MT4 Download - Free - [TFlab] 0](https://cdn.tradingfinder.com/image/156324/13-28-en-macd-3-color-mt4-1.webp)
![MACD 3 Color Indicator MT4 Download - Free - [TFlab] 1](https://cdn.tradingfinder.com/image/156323/13-28-en-macd-3-color-mt4-2.webp)
![MACD 3 Color Indicator MT4 Download - Free - [TFlab] 2](https://cdn.tradingfinder.com/image/156326/13-28-en-macd-3-color-mt4-3.webp)
![MACD 3 Color Indicator MT4 Download - Free - [TFlab] 3](https://cdn.tradingfinder.com/image/156325/13-28-en-macd-3-color-mt4-4.webp)
The MACD 3 Color Oscillator is a commonly used technical analysis tool. This tool significantly helps traders identify the strength and direction of price trends.
This MT4 currency strength indicator, consists of two phases positive and negative. The fluctuation of the signal line, along with the color change of the histogram in these two phases, determines whether the trend is bullish or bearish.
The color change and separation of the signal line from the histogram can provide a signal for entry or exit in trades.
MACD 3 Color Indicator Table
Indicator Categories: | Oscillators MT4 Indicators Signal & Forecast MT4 Indicators Currency Strength MT4 Indicators MACD Indicators for MetaTrader 4 |
Platforms: | MetaTrader 4 Indicators |
Trading Skills: | Elementary |
Indicator Types: | Trend MT4 Indicators Lagging MT4 Indicators Reversal MT4 Indicators |
Timeframe: | Multi-Timeframe MT4 Indicators |
Trading Style: | Day Trading MT4 Indicators Fast Scalper MT4 Indicators Scalper MT4 Indicators Swing Trading MT4 Indicators |
Trading Instruments: | Share Stocks MT4 Indicators Indices Market MT4 Indicators Commodity Market MT4 Indicators Stock Market MT4 Indicators Cryptocurrency MT4 Indicators Forex MT4 Indicators |
MACD 3 Color Indicator at a Glance
The MACD 3 Color Indicator is similar to the classic MACD indicator in MetaTrader 4, but with the difference that it shows bullish and bearish trends using two different colors.
This difference in color helps traders easily recognize trend changes and look for trading opportunities in the direction of the trend.
Bullish Trend Conditions
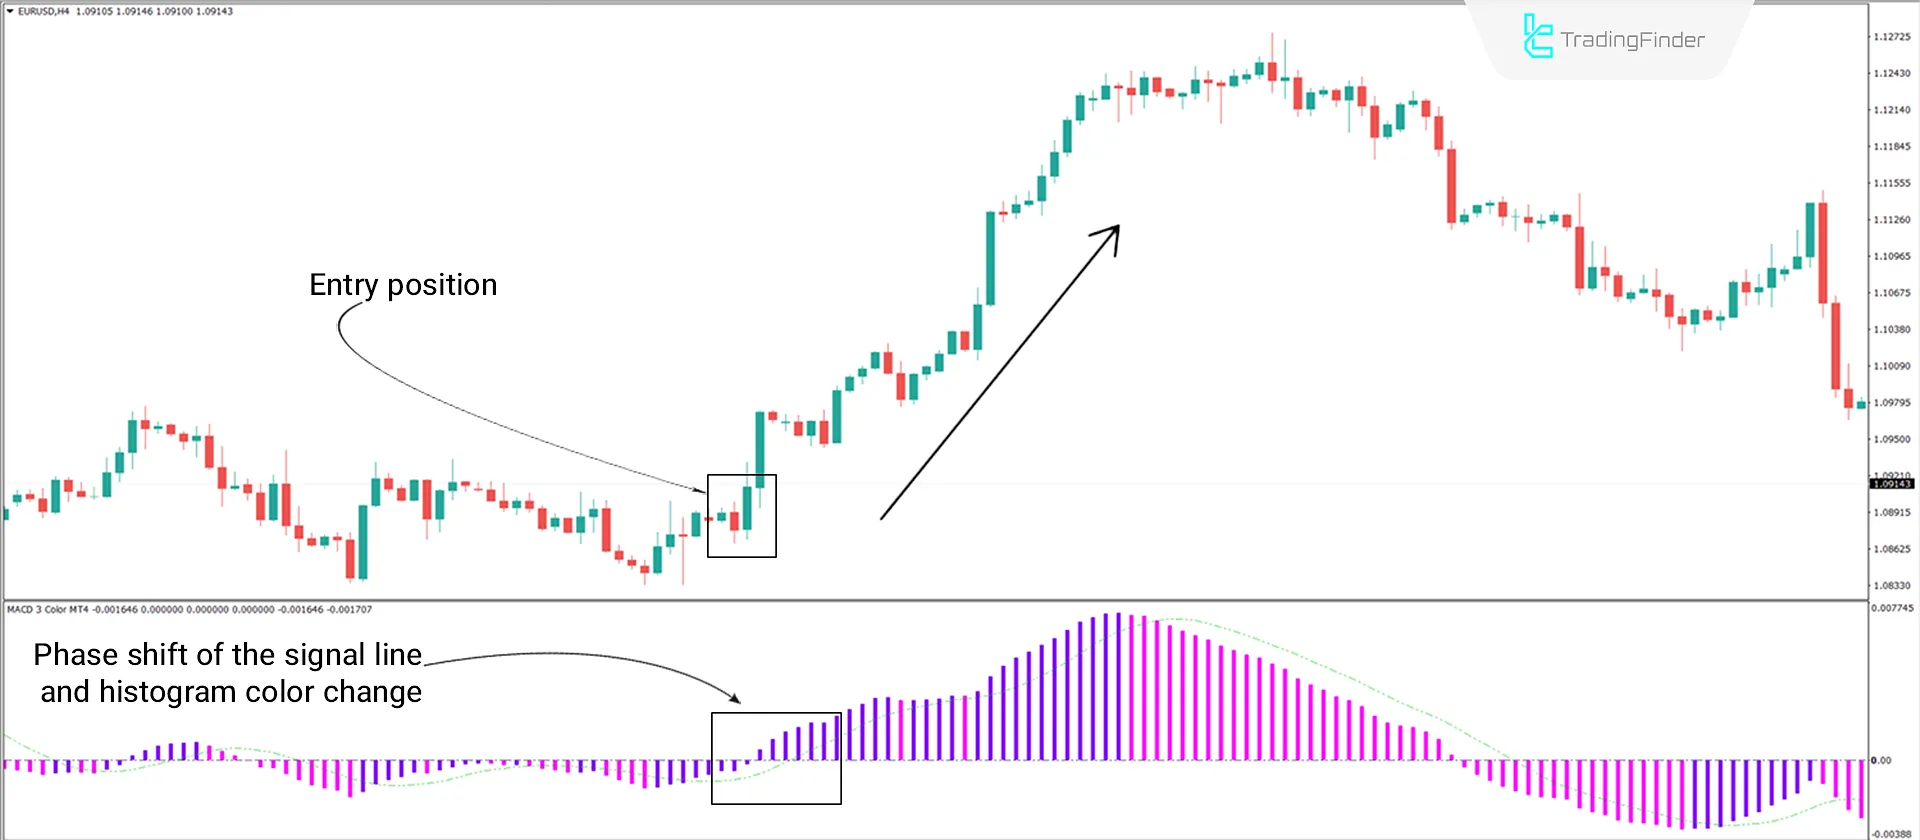
According to the price chart of the EUR/USD currency pair in the 4-hour timeframe, the phase shift of the signal line from negative to positive and the histogram color change from light purple to dark purple serve as factors indicating a trend reversal in the market, which can be signals for entering buy positions.

Bearish Trend Conditions
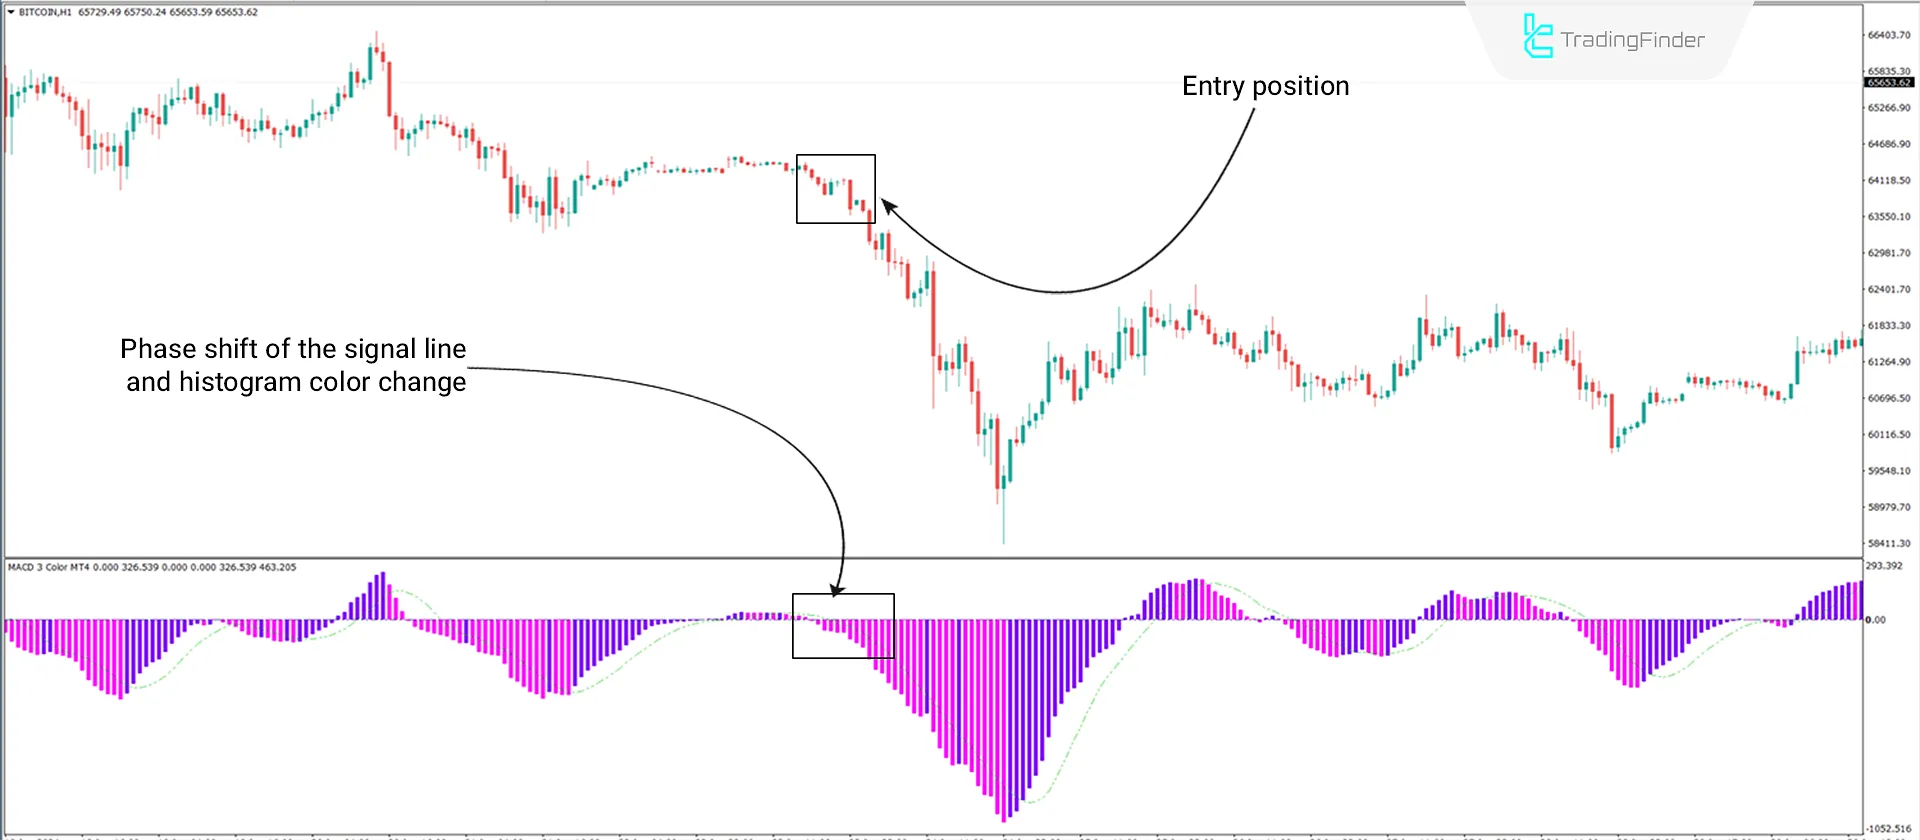
The price chart of Bitcoin (BTC) in the 1-hour timeframe shows the performance of the MACD 3 Color Indicator in indicating trend changes and issuing signals.
The chart shows that the signal line's phase shift from positive to negative, and the histogram color change from dark purple to light purple indicates a trend reversal and provides a sell signal.

Indicator Settings

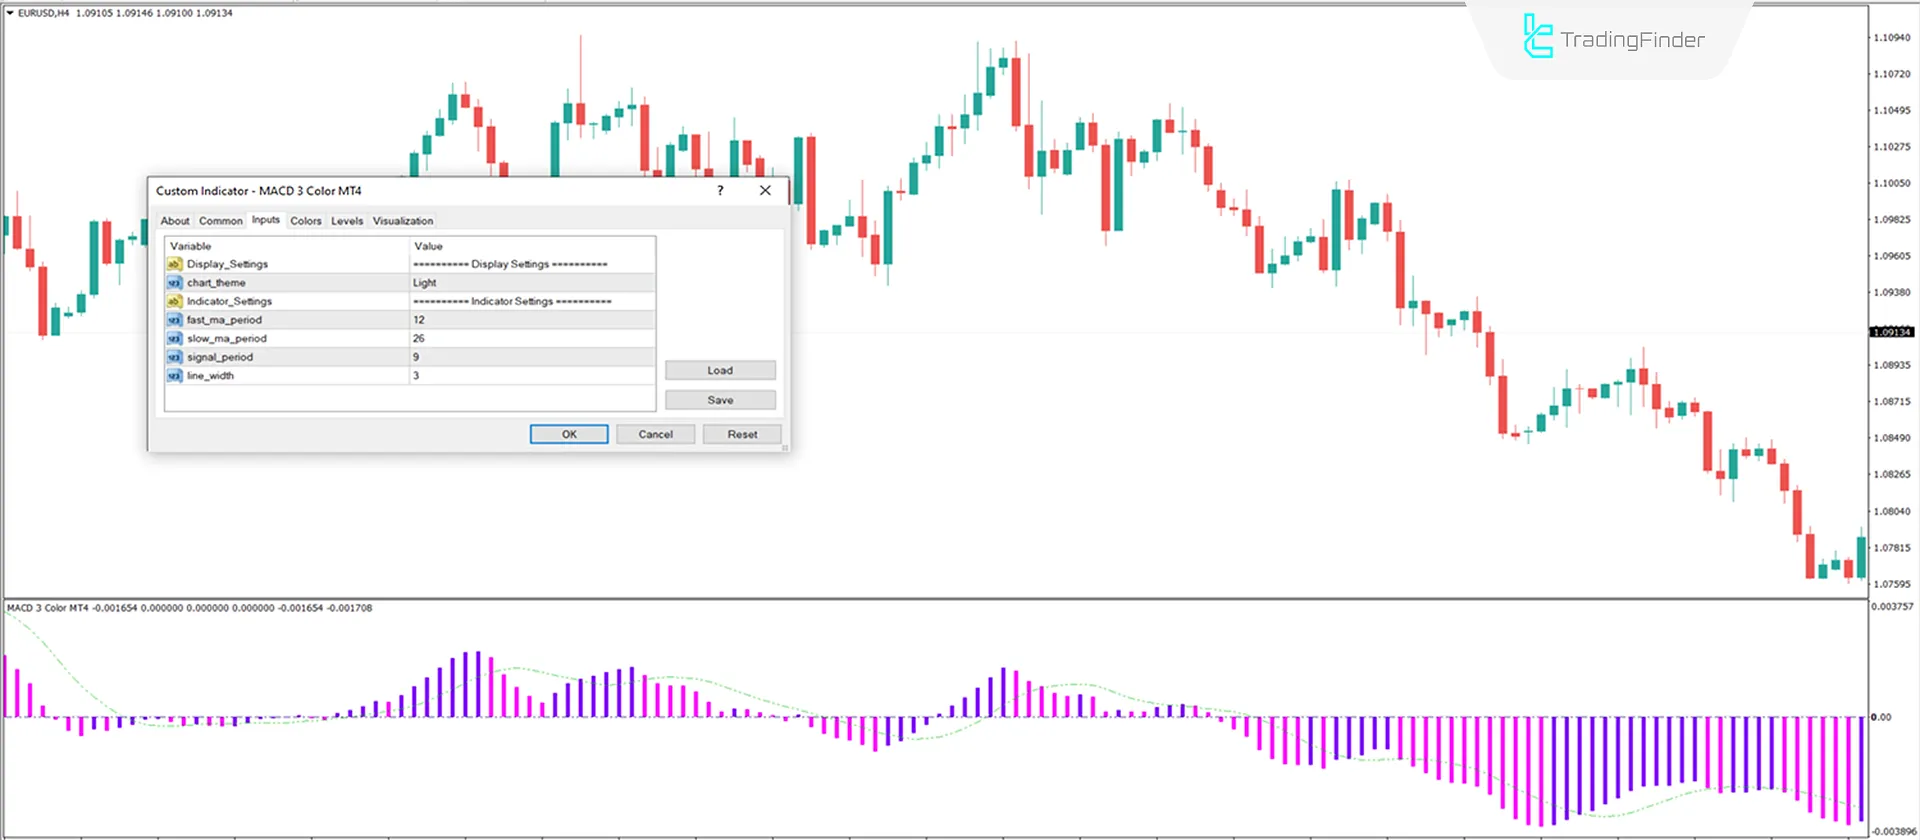
- Chart Theme: Indicator theme settings;
- Fast MA Period: Fast moving average period set to 12;
- Slow MA Period: Slow moving average period set to 26;
- Signal Period: Simple moving average period set to 9;
- Line Width: Oscillator line thickness set to 3.
Summary
The MACD 3 Color Indicator is useful in MetaTrader 4, particularly for identifying trend direction and strength. This MT4 oscillator generates entry signals by utilizing color differences in the histogram and signal line fluctuations between positive and negative phases.
The 3 color MACD indicator is suitable for use in all trading strategies due to its simplicity and clarity.
MACD 3 Color MT4 PDF
MACD 3 Color MT4 PDF
Click to download MACD 3 Color MT4 PDFWhat is the MACD 3 Color Indicator?
It is a tool similar to the classic MACD indicator but displays a trend's positive and negative phases with two different colors.
How can the signals from the MACD 3 Color Indicator be used?
In this oscillator, whenever the histogram changes color and the MACD phase shift occurs, it signals trend changes.


