![MACD Crossover Arrows & Alert Indicator for MetaTrader 4 Download - Free - [Trading Finder]](https://cdn.tradingfinder.com/image/108393/11-32-en-macd-crossover-arrows-amp-alert-mt4.webp)
![MACD Crossover Arrows & Alert Indicator for MetaTrader 4 Download - Free - [Trading Finder] 0](https://cdn.tradingfinder.com/image/108393/11-32-en-macd-crossover-arrows-amp-alert-mt4.webp)
![MACD Crossover Arrows & Alert Indicator for MetaTrader 4 Download - Free - [Trading Finder] 1](https://cdn.tradingfinder.com/image/39134/11-32-en-macd-crossover-arrow-alert-mt4-02.avif)
![MACD Crossover Arrows & Alert Indicator for MetaTrader 4 Download - Free - [Trading Finder] 2](https://cdn.tradingfinder.com/image/39135/11-32-en-macd-crossover-arrow-alert-mt4-03.avif)
![MACD Crossover Arrows & Alert Indicator for MetaTrader 4 Download - Free - [Trading Finder] 3](https://cdn.tradingfinder.com/image/39136/11-32-en-macd-crossover-arrow-alert-mt4-04.avif)
On June 23, 2025, in version 2, alert/notification functionality was added to this indicator
The MACD Crossover Arrows & Alert Indicator is part of the MetaTrader 4 indicators. The Moving Average Convergence Divergence (MACD) identifies the beginning of price trends and movements.
Bullish trends show a buy signal with an upward blue arrow when the MACD signal line crosses above the Histogram in Technical analysis.
In bearish trends, it displays a sell signal with a downward red arrow when the MACD signal line crosses below the Histogram.
MACD Crossover Arrows & Alert Indicator Table
Indicator Categories: | Support & Resistance MT4 Indicators Signal & Forecast MT4 Indicators Trading Assist MT4 Indicators |
Platforms: | MetaTrader 4 Indicators |
Trading Skills: | Elementary |
Indicator Types: | Lagging MT4 Indicators Reversal MT4 Indicators |
Timeframe: | Multi-Timeframe MT4 Indicators |
Trading Style: | Day Trading MT4 Indicators Fast Scalper MT4 Indicators Scalper MT4 Indicators Swing Trading MT4 Indicators |
Trading Instruments: | Share Stocks MT4 Indicators Binary Options MT4 Indicators Indices Market MT4 Indicators Commodity Market MT4 Indicators Stock Market MT4 Indicators Cryptocurrency MT4 Indicators Forex MT4 Indicators |
MACD Crossover Arrows & Alert Indicator at a Glance
The MACD Indicator is one of the most commonly used technical analysis tools and can be used in various ways.
The MACD Crossover indicator predicts future price trends by detecting signal line crossings over histograms.
It identifies pivots and price chart highs and lows and provides them as trading signals.
Buy Signal (Long Position)
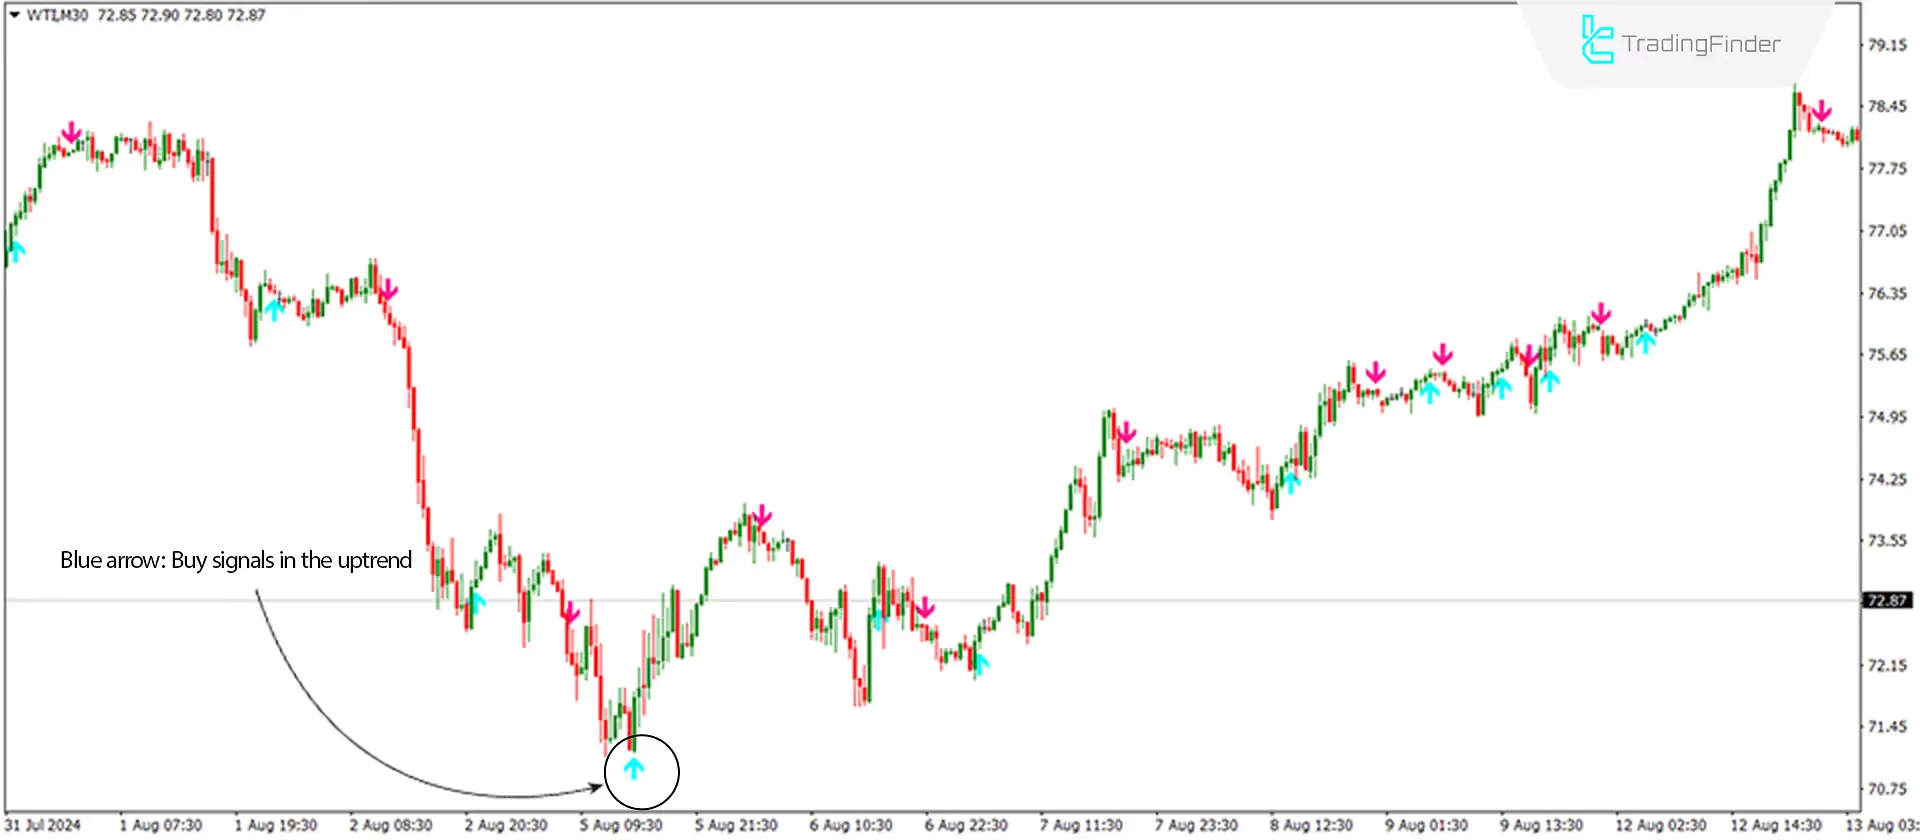
The price chart of WTI Crude Oil is displayed in the 30-minute timeframe in the image below.
The Binary indicator shows a buy signal with an upward blue arrow at the start of a strong bullish trend, and traders can take a Buy Position using other trend confirmation tools.

Sell Signal (Short Position)
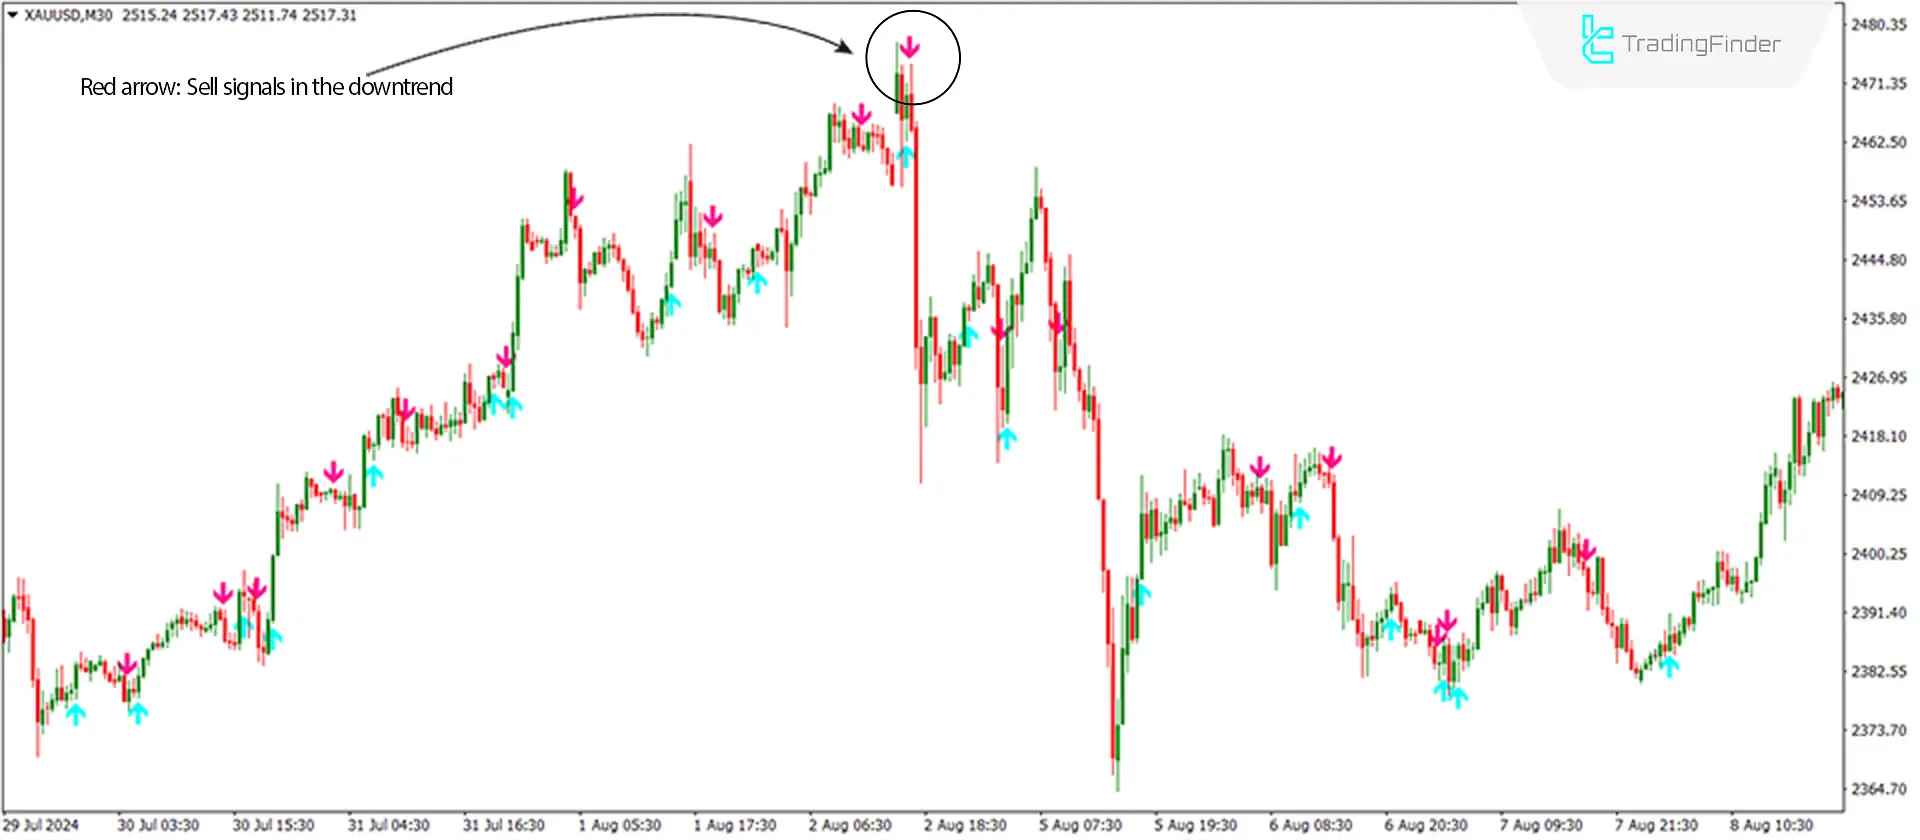
The image below shows the price chart of Gold (XAU/USD) in the 30-minute timeframe.
The indicator shows a sell signal with a downward red arrow at the start of a strong bearish trend, and traders can take a Sell Position using other trend confirmation tools.

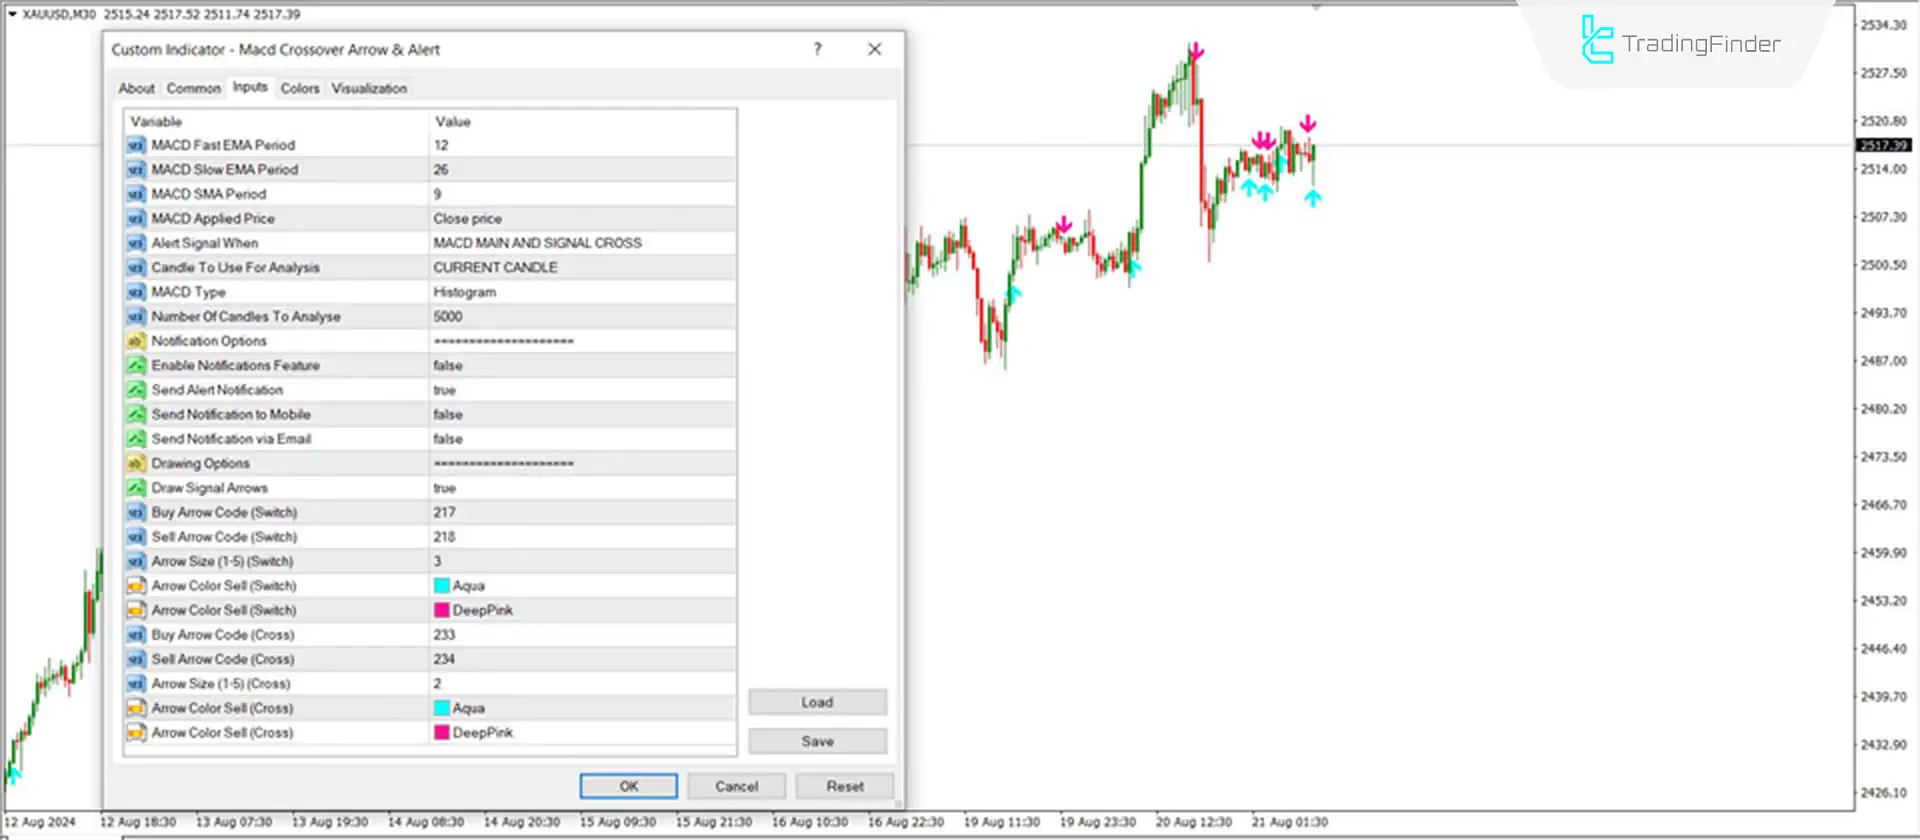
MACD Crossover Arrow Indicator Settings

- MACD Fast EMA Period: Fast exponential moving average (EMA) set to 12
- MACD Slow EMA Period: Slow exponential moving average (EMA) set to 26
- MACD SMA Period: Simple moving average (SMA) set to 9
- MACD Applied Price: MACD applied price is based on the Close price
- Alert Signal When: Signal alert whenMACD Main and Signal Cross
- Candle To Use For Analysis: The candle used for analysis is the current candle
- MACD Type: The MACD type is Histogram
- Number of Candles To Analyse: The number of candles to analyze is 5000
Notification Options
- Enable Notifications Feature: Enable notifications set to false
- Send Alert Notification: Send alert notification set to true
- Send Notification to Mobile: Send mobile notifications set to false
- Send Notification via Email: Send email notifications set to false
Drawing Options
- Draw Signal Arrows: Draw signal arrows set to true
- Buy Arrow Code (Switch): Buy signal arrow code set to 217
- Sell Arrow Code (Switch): Sell signal arrow code set to 218
- Arrow Size (1-5) (Switch): Arrow size set to 3
- Arrow Color Sell (Switch) :Color of sell signal arrow
- Buy Arrow Code (Cross): Buy signal arrow code set to 233
- Sell Arrow Code (Cross): Sell signal arrow code set to 234
- Arrow Size (1-5) (Cross): Arrow size set to 2
- Arrow Color Sell (Cross): Color of sell signal arrow
Conclusion
The MACD Crossover Arrows & Alert Indicator can be used across all timeframes. Still, it is recommended to first check higher timeframe signals and base trades on those that align with the current timeframe for optimal results.
It can be used alongside other analytical tools like support and resistance levels indicator, Bollinger Bands, trendlines, and divergences to increase the reliability of the indicator's signals.
MACD Crossover Arrows Alert MT4 PDF
MACD Crossover Arrows Alert MT4 PDF
Click to download MACD Crossover Arrows Alert MT4 PDFIs the MACD Crossover Indicator applicable to all trading instruments?
Yes, the MACD Crossover Indicator can be used for all trading instruments, especially those with higher volatility.
Does the MACD Crossover Arrows Indicator issue trading signals on its own?
Yes, but for better usage, it should be combined with other technical analysis tools, such as support and resistance levels.


