![MACD RSI Oscillator for MT4 Download – Free – [TradingFinder]](https://cdn.tradingfinder.com/image/323682/13-97-en-macd-rsi-mt4-01.webp)
![MACD RSI Oscillator for MT4 Download – Free – [TradingFinder] 0](https://cdn.tradingfinder.com/image/323682/13-97-en-macd-rsi-mt4-01.webp)
![MACD RSI Oscillator for MT4 Download – Free – [TradingFinder] 1](https://cdn.tradingfinder.com/image/323683/13-97-en-macd-rsi-mt4-02.webp)
![MACD RSI Oscillator for MT4 Download – Free – [TradingFinder] 2](https://cdn.tradingfinder.com/image/323680/13-97-en-macd-rsi-mt4-03.webp)
![MACD RSI Oscillator for MT4 Download – Free – [TradingFinder] 3](https://cdn.tradingfinder.com/image/323681/13-97-en-macd-rsi-mt4-04.webp)
The MACD RSI Indicator is a combined oscillator designed to detect divergences and provide momentum andtrend based signals in technical analysis. This MT4 currency strength indicator uses histogram bars, Fast EMA, and Slow EMA lines to indicate optimal trade entry and exit points.
MACD and RSI Oscillator Specifications Table
Below is a table summarizing the features and specifications of the MACD and RSI indicators:
Indicator Categories: | Oscillators MT4 Indicators Volatility MT4 Indicators Currency Strength MT4 Indicators MACD Indicators for MetaTrader 4 RSI Indicators for MetaTrader 4 |
Platforms: | MetaTrader 4 Indicators |
Trading Skills: | Intermediate |
Indicator Types: | Reversal MT4 Indicators |
Timeframe: | Multi-Timeframe MT4 Indicators |
Trading Style: | Day Trading MT4 Indicators |
Trading Instruments: | Share Stocks MT4 Indicators Binary Options MT4 Indicators Forward Market MT4 Indicators Indices Market MT4 Indicators Stock Market MT4 Indicators Cryptocurrency MT4 Indicators Forex MT4 Indicators |
MACD and RSI Indicator at a Glance
The MACD indicator focuses on the divergence and convergence of moving averages, while the RSI emphasizes overbought and oversold conditions.
These tools offer traders a multi layered view when combined into a single indicator. The formation of histogram bars in either the positive or negative phase, along with EMA line crossovers, can be considered trade entry signals.
Buy Position
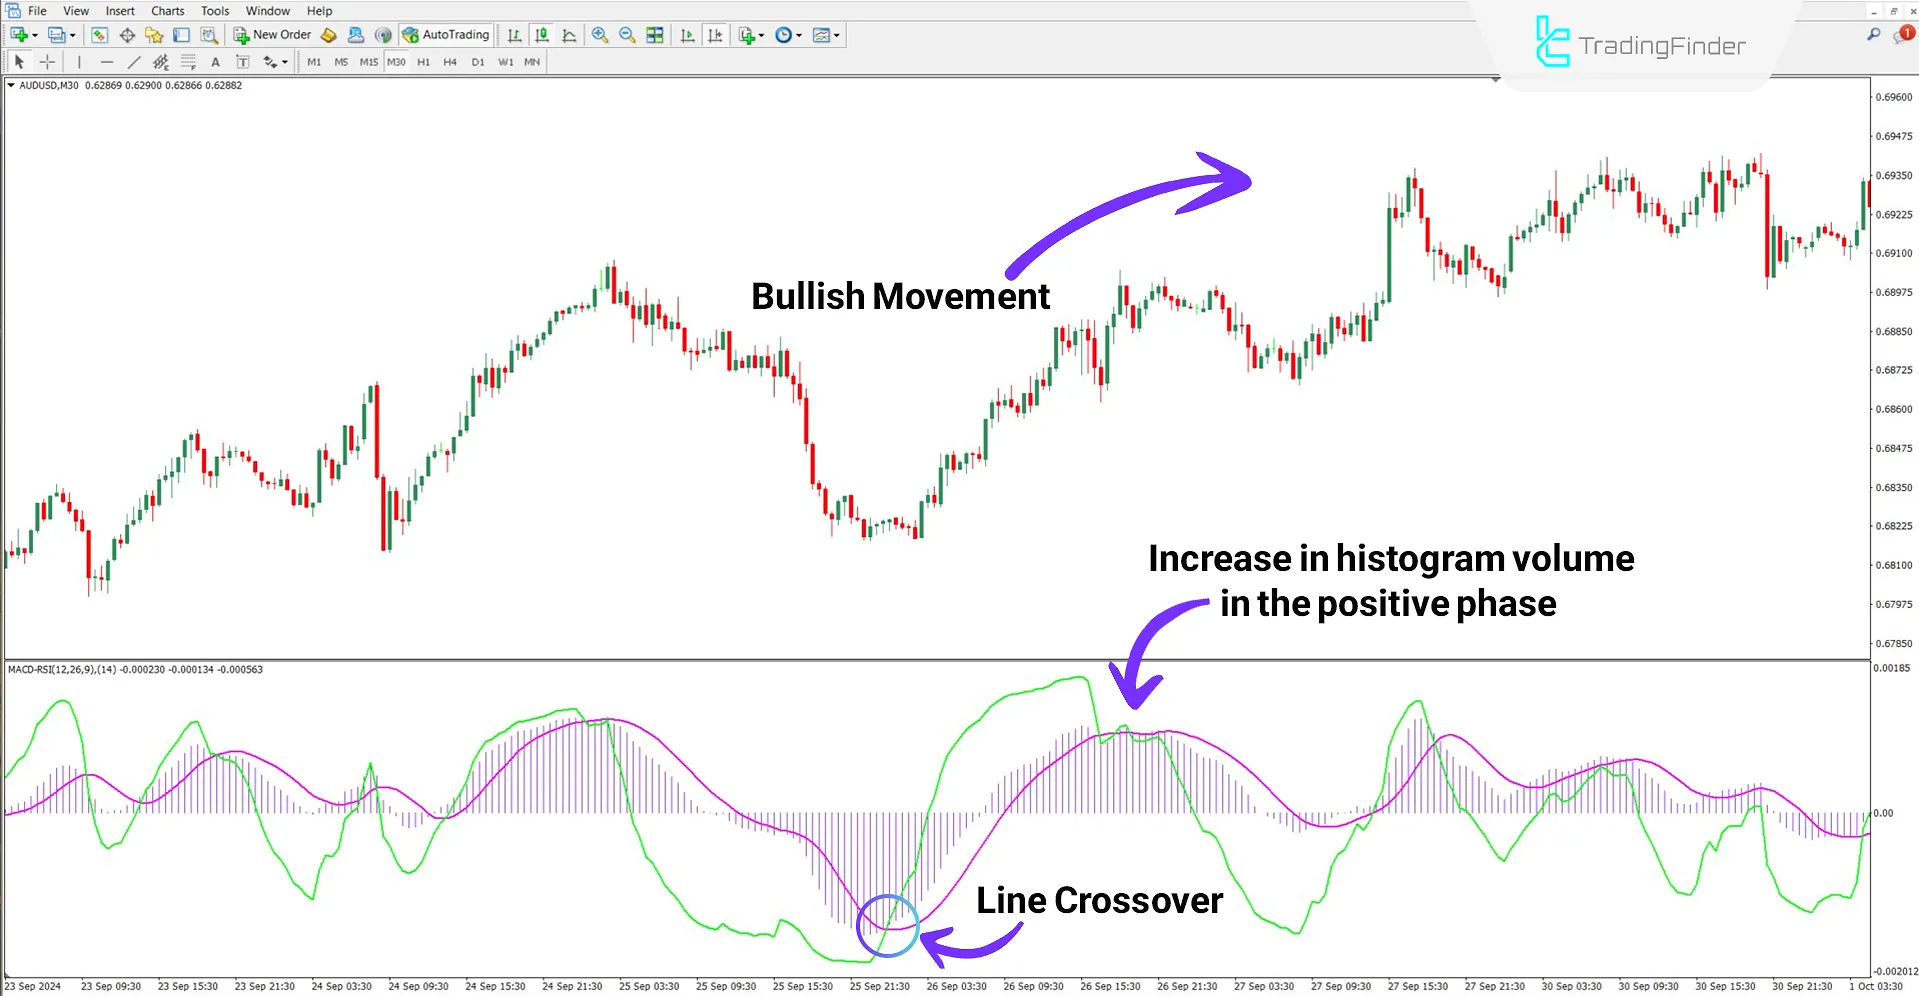
Based on the 30-minute chart analysis of the AUD/USD currency pair, the green line crosses above the pink line. Simultaneously, histogram volume decreases in the negative phase and increases in the positive phase.
In such a setup, the histogram phase change point becomes a substantial entry opportunity for a buy position after the line crossover signal.

Sell Position
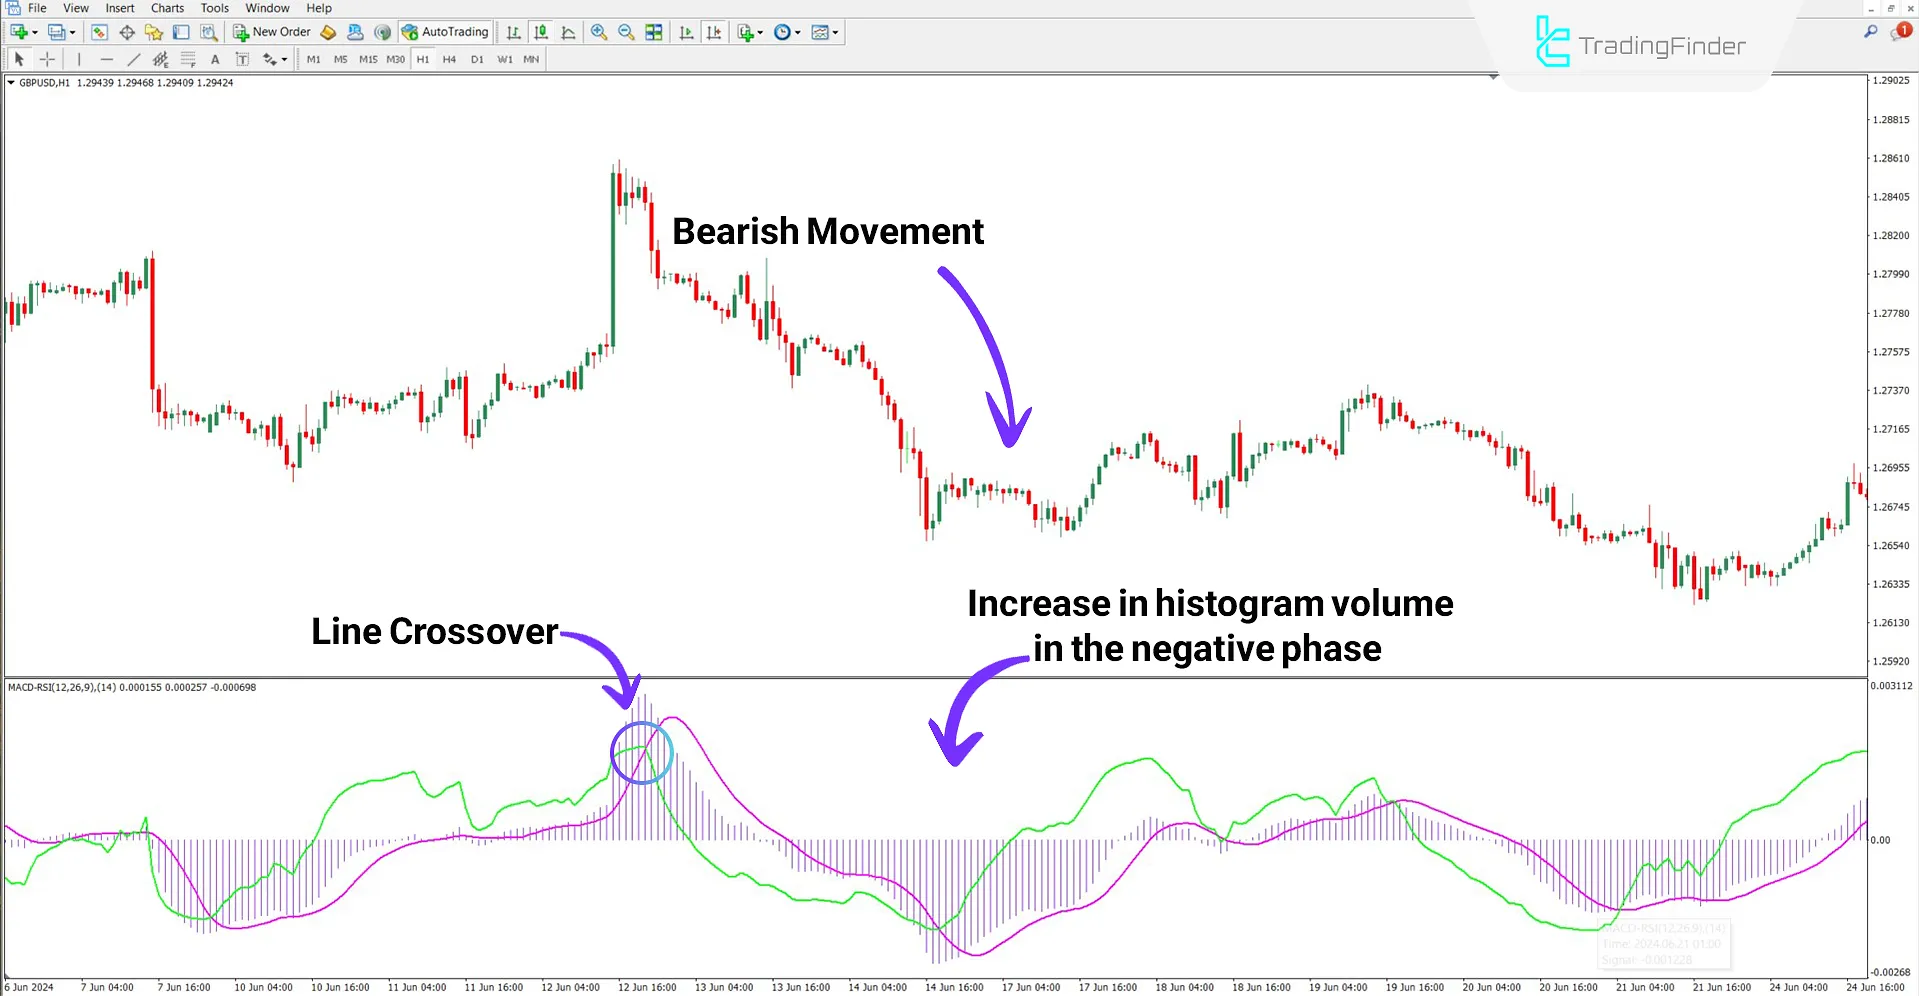
On the 1-hour chart of the GBP/USD pair, the green line crosses below the pink line, indicating a trend reversal.
In addition, the histogram phase shifts from positive to negative, confirming the bearish trend.

MACD and RSI Indicator Settings
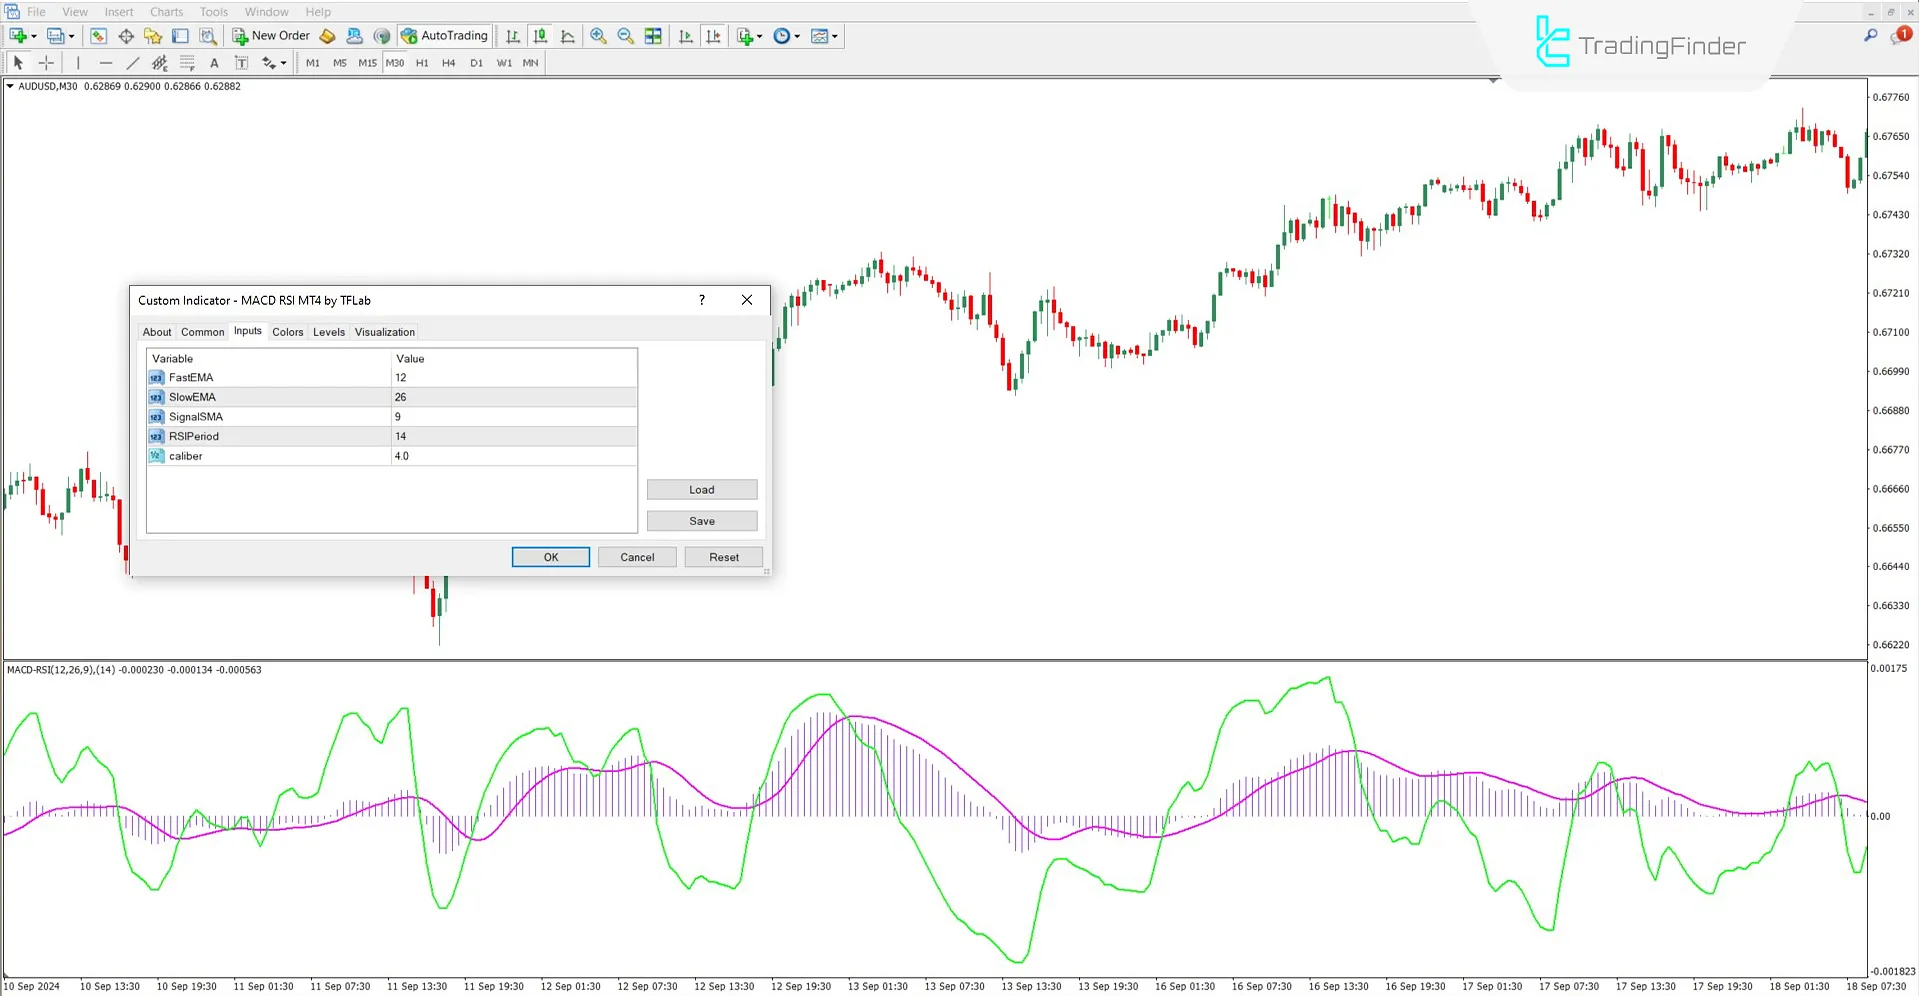
The image below illustrates the adjustable parameters in the MACD and RSI oscillator settings:

- Fast EMA: Period for calculating the fast exponential moving average
- Slow EMA: Period for calculating the slow exponential moving average
- Signal SMA: Period for calculating the signal line (simple moving average)
- RSI Period: Calculation period for the RSI
- Caliber: Defines the delay level for divergence signal detection
Conclusion
TheMACD and Relative Strength Index oscillator, by integrating the concepts of MACD and RSI, facilitates the identification of price direction changes and entry points.
Unlike traditional models, this trading tool calculates the RSI and then applies the MACD algorithm. As a result, market momentum behavior is presented in a simplified visual form.
This indicator can also be used in all trading markets, including Forex, cryptocurrency, stocks, and commodities.
MACD RSI Oscillator MT4 PDF
MACD RSI Oscillator MT4 PDF
Click to download MACD RSI Oscillator MT4 PDFWhich markets are the MACD and RSI Indicators suitable for?
This indicator is applicable and suitable for all markets.
Are the MACD and RSI indicators effective for trend identification?
Yes, the MACD line and its direction help determine the trend's strength and direction.


