![Machine Learning Momentum Index Indicator MT4 Download – Free – [TradingFinder]](https://cdn.tradingfinder.com/image/610700/13-253-en-machine-learning-momentum-index-mt4-01.webp)
![Machine Learning Momentum Index Indicator MT4 Download – Free – [TradingFinder] 0](https://cdn.tradingfinder.com/image/610700/13-253-en-machine-learning-momentum-index-mt4-01.webp)
![Machine Learning Momentum Index Indicator MT4 Download – Free – [TradingFinder] 1](https://cdn.tradingfinder.com/image/610697/13-253-en-machine-learning-momentum-index-mt4-02.webp)
![Machine Learning Momentum Index Indicator MT4 Download – Free – [TradingFinder] 2](https://cdn.tradingfinder.com/image/610695/13-253-en-machine-learning-momentum-index-mt4-03.webp)
![Machine Learning Momentum Index Indicator MT4 Download – Free – [TradingFinder] 3](https://cdn.tradingfinder.com/image/610696/13-253-en-machine-learning-momentum-index-mt4-04.webp)
The Machine Learning Momentum Index Indicator combines classic momentum analysis with machine learning algorithms.
This tool uses Weighted Moving Averages (WMA) and the Relative Strength Index (RSI) to measure price strength across various timeframes.
Additionally, the k-Nearest Neighbors (K-NN) algorithm is implemented to learn from past data and predict trend direction.
Machine Learning Momentum Index Indicator Specification Table
The table below includes the specifications of the Machine Learning Momentum Index indicator:
Indicator Categories: | Momentum Indicators in MT4 Machine Learning Indicators for MetaTrader 4 |
Platforms: | MetaTrader 4 Indicators |
Trading Skills: | Intermediate |
Indicator Types: | Overbought and Oversold MT4 Indicators Reversal MT4 Indicators |
Timeframe: | Multi-Timeframe MT4 Indicators |
Trading Style: | Intraday MT4 Indicators Scalper MT4 Indicators Swing Trading MT4 Indicators |
Trading Instruments: | Share Stocks MT4 Indicators Indices Market MT4 Indicators Commodity Market MT4 Indicators Stock Market MT4 Indicators Cryptocurrency MT4 Indicators Forex MT4 Indicators |
Indicator at a Glance
The Machine Learning Momentum Index Indicator defines overbought and oversold areas using two oscillating lines, with each region displayed in a distinct color.
This indicator generates trading signals through a comparison between fast and slow moving averages based on RSI.
An upward crossover of the lines indicates a buy signal, while a downward crossover represents a sell signal.
Buy Signal
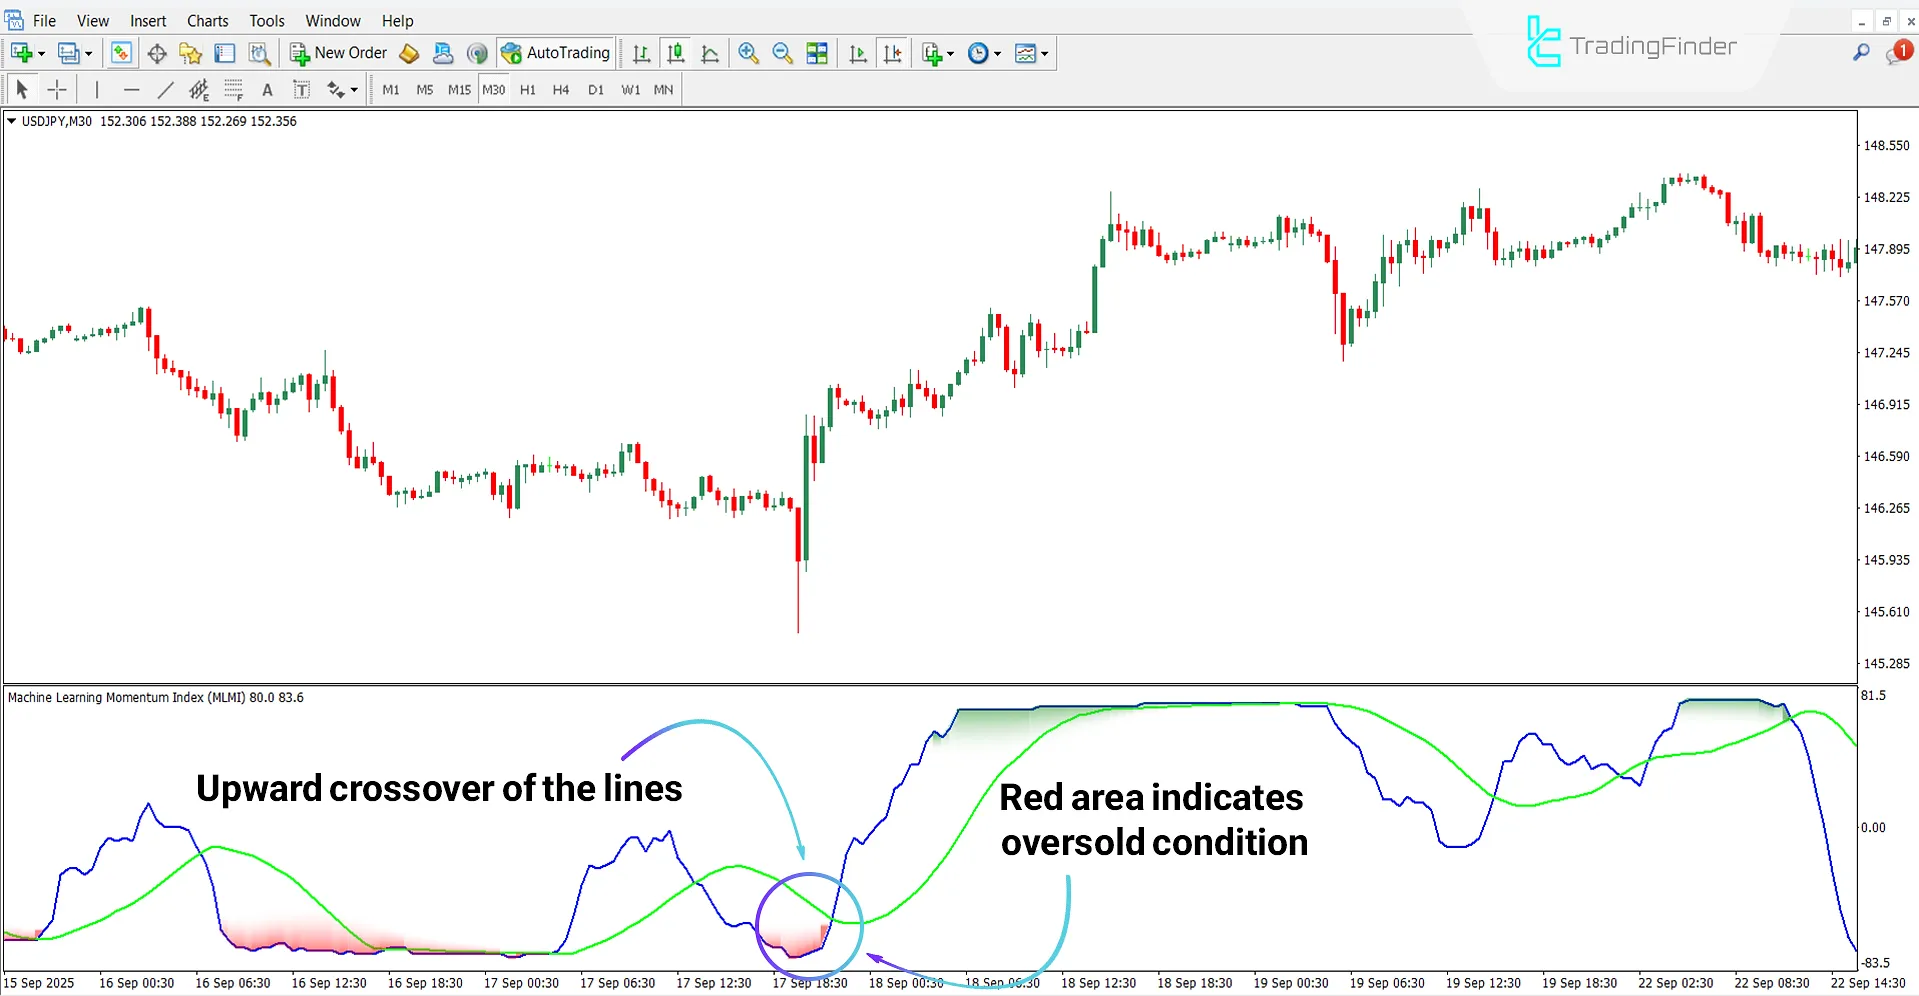
Based on the USD/JPY 30-minute chart, the red area shows the oversold condition.
Subsequently, the upward crossover of the oscillator lines is considered a buy opportunity.

Sell Signal
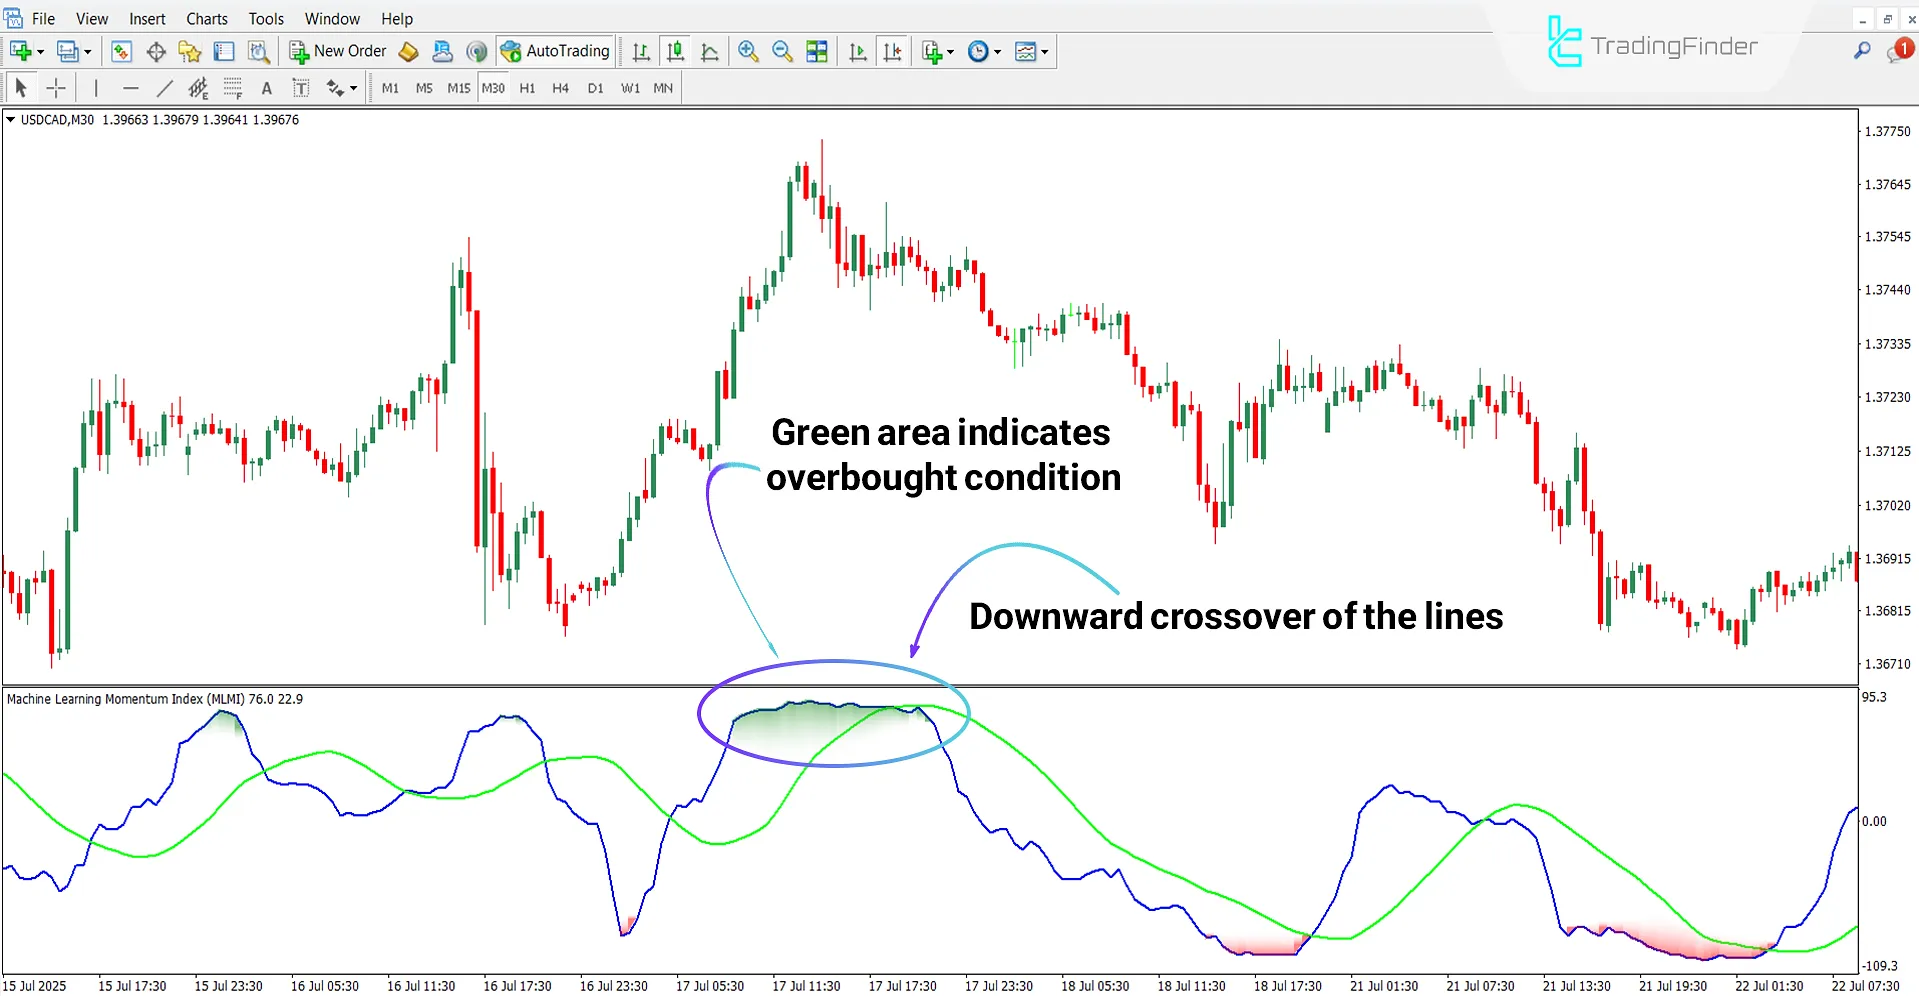
According to the USD/CAD 30-minute chart, the overbought condition is displayed by the area turning green.
Furthermore, the downward crossover of the two oscillator lines is recognized as a suitable point to enter sell trades.

Machine Learning Momentum Index Indicator Settings
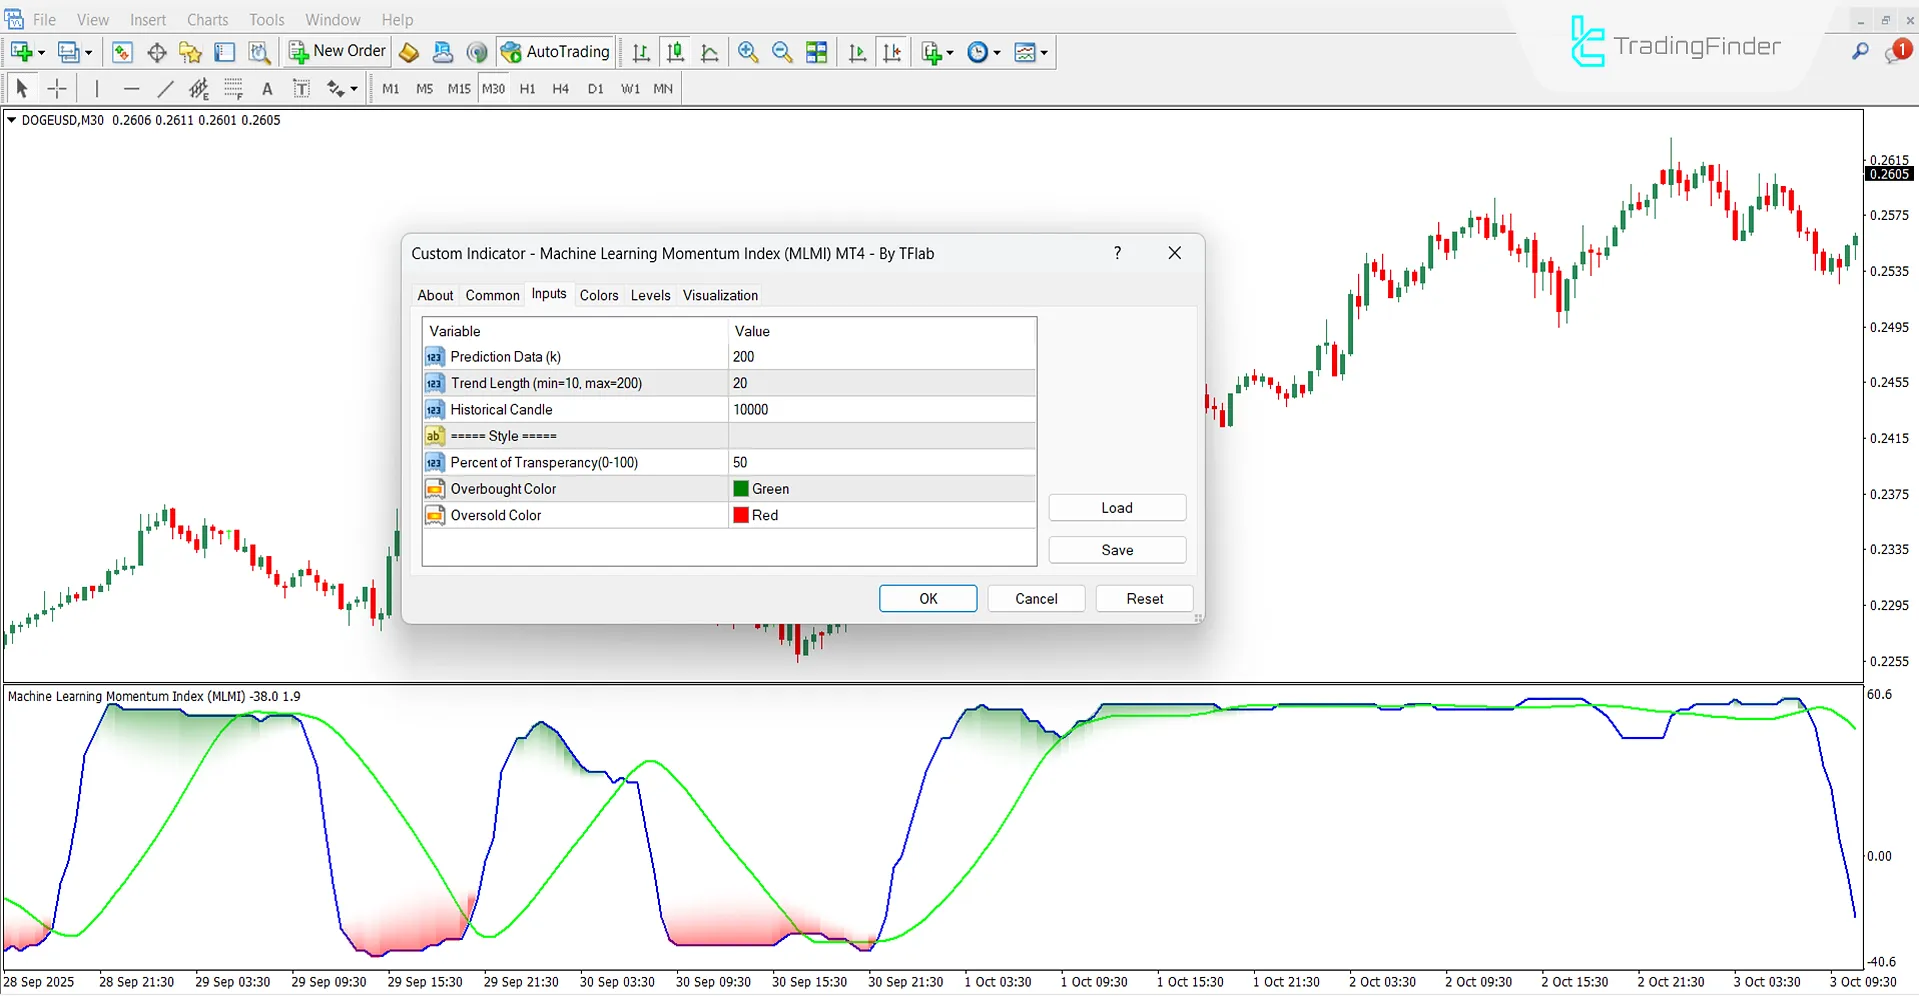
The following settings are available for the Machine Learning Momentum Index Indicator:

- Prediction Data: Value of "K" in the K-NN algorithm
- Trend Length (min=10, max=200): Momentum calculation period for indicator sensitivity
- Historical Candle: Number of candles for training and historical data analysis
- Percent of Transparency (0–100): Transparency level of overbought and oversold colors in oscillator area
- Overbought Color: Color of overbought zones in bullish or strong momentum conditions
- Oversold Color: Color of oversold zones in bearish or weak momentum conditions
Conclusion
The Machine Learning Momentum Index Indicator merges classic momentum with machine learning algorithms. By utilizing RSI, WMA, and the K-NN model, it predicts market trend direction.
This oscillator highlights overbought and oversold zones in distinct colors, with line crossovers serving as buy and sell signals.
With multi-timeframe capability and high analytical precision on historical data, it suits scalping, day trading, and swing trading strategies.
Machine Learning Momentum Index Indicator MT4 PDF
Machine Learning Momentum Index Indicator MT4 PDF
Click to download Machine Learning Momentum Index Indicator MT4 PDFIs this indicator suitable for all markets?
Yes. The Machine Learning Momentum Index Indicator can be used across all markets including Forex, Crypto, Stocks, and Commodities.
What is the role of the K-NN algorithm in this indicator?
The K-Nearest Neighbors algorithm analyzes past market data and uses it to forecast potential future price behavior.


