![Market Way Indicator for MetaTrader 4 Download – [TradingFinder]](https://cdn.tradingfinder.com/image/580454/11-115-en-market-way-mt4-01.webp)
![Market Way Indicator for MetaTrader 4 Download – [TradingFinder] 0](https://cdn.tradingfinder.com/image/580454/11-115-en-market-way-mt4-01.webp)
![Market Way Indicator for MetaTrader 4 Download – [TradingFinder] 1](https://cdn.tradingfinder.com/image/580422/11-115-en-market-way-mt4-02.webp)
![Market Way Indicator for MetaTrader 4 Download – [TradingFinder] 2](https://cdn.tradingfinder.com/image/580421/11-115-en-market-way-mt4-03.webp)
![Market Way Indicator for MetaTrader 4 Download – [TradingFinder] 3](https://cdn.tradingfinder.com/image/580425/11-115-en-market-way-mt4-04.webp)
The Market Way Indicator is a specialized oscillator designed to identify buy and sell pressure in the market, available on the MetaTrader 4 platform.
Technical analysis traders can easily assess the level of buying and selling pressure in the market using this indicator.
Its structure is based on histograms, blue points, and oscillator lines, which together enable traders to detect the probable market direction.
Market Way Indicator Table
Below are the details of the Market Way Indicator:
Indicator Categories: | Oscillators MT4 Indicators Signal & Forecast MT4 Indicators Trading Assist MT4 Indicators |
Platforms: | MetaTrader 4 Indicators |
Trading Skills: | Advanced |
Indicator Types: | Entry and Exit MT4 Indicators Trend MT4 Indicators Reversal MT4 Indicators |
Timeframe: | Multi-Timeframe MT4 Indicators |
Trading Style: | Day Trading MT4 Indicators Intraday MT4 Indicators Scalper MT4 Indicators |
Trading Instruments: | Share Stocks MT4 Indicators Indices Market MT4 Indicators Stock Market MT4 Indicators Cryptocurrency MT4 Indicators Forex MT4 Indicators |
Market Way Indicator at a Glance
The Market Way Indicator is a specialized tool for forex and crypto traders that uses oscillators to identify buy and sell pressure and, ultimately, the probable market direction.
Through advanced calculations, this indicator provides traders with precise metrics to evaluate buyer and seller strength:
- Blue points in the oscillator window indicate the difference between closing and opening prices of a candle in a specific timeframe; when these points appear above the zero level, they signal buying pressure; below zero, they signal selling pressure;
- Applying a moving average to the oscillator measures the intensity of buy and sell pressure. When the green line moves positively away from the moving average, the distance between the green oscillator line and the moving average is displayed as a blue histogram, representing buying pressure strength;
- When the red line moves negatively away from the moving average, the indicator displays a yellow histogram, showing the strength of selling pressure compared to the average.
By analyzing the histogram, points, and oscillator lines, traders gain deeper insight into the balance of buyer and seller power and the market’s potential direction.
Bullish Trend in the Market Way Indicator
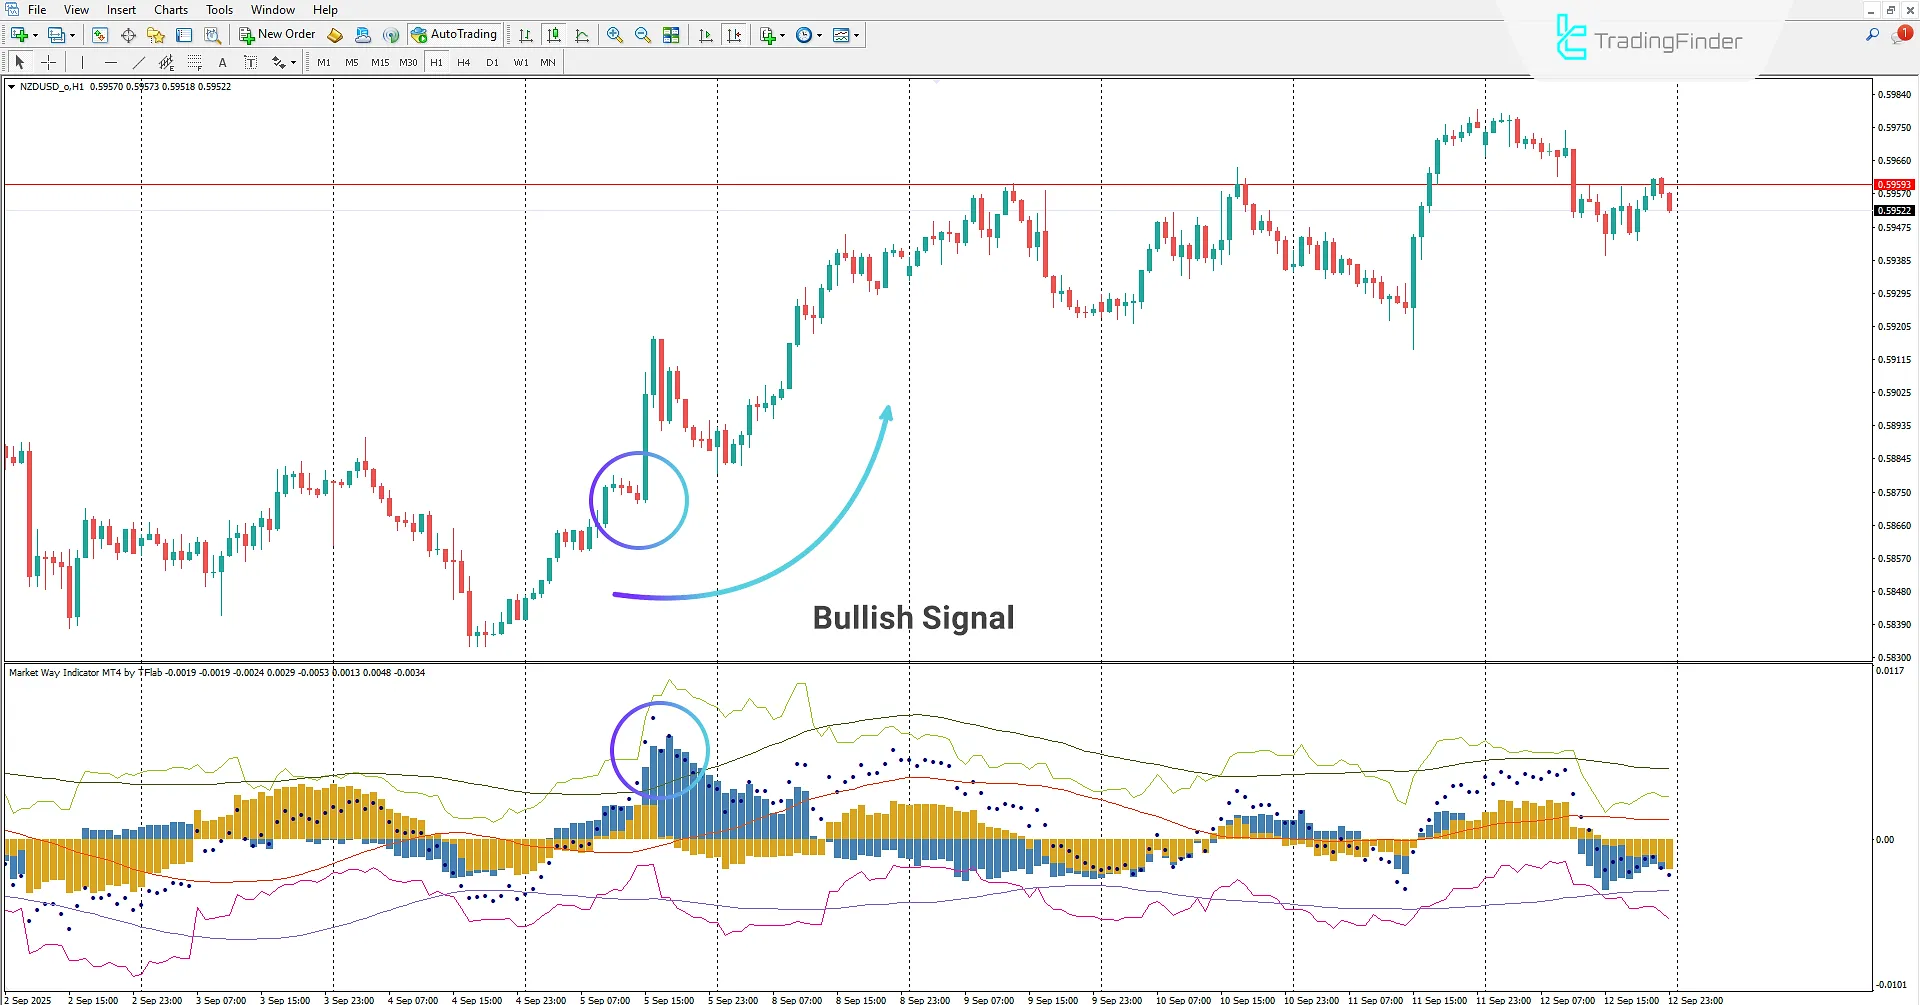
On the 1-hour chart of the NZD/USD pair, the Market Way Indicator was applied. Traders can identify bullish trends using this oscillator alongside their trading strategies and enter buy trades based on buying pressure.
When blue points appear above the zero level, they indicate rising buying pressure in the market.
This signal becomes stronger when accompanied by a blue histogram, as this combination confirms buying pressure and supports the bullish trend.
In such conditions, traders can use this confluence as a reliable buy entry signal.

Bearish Trend in the Market Way Indicator
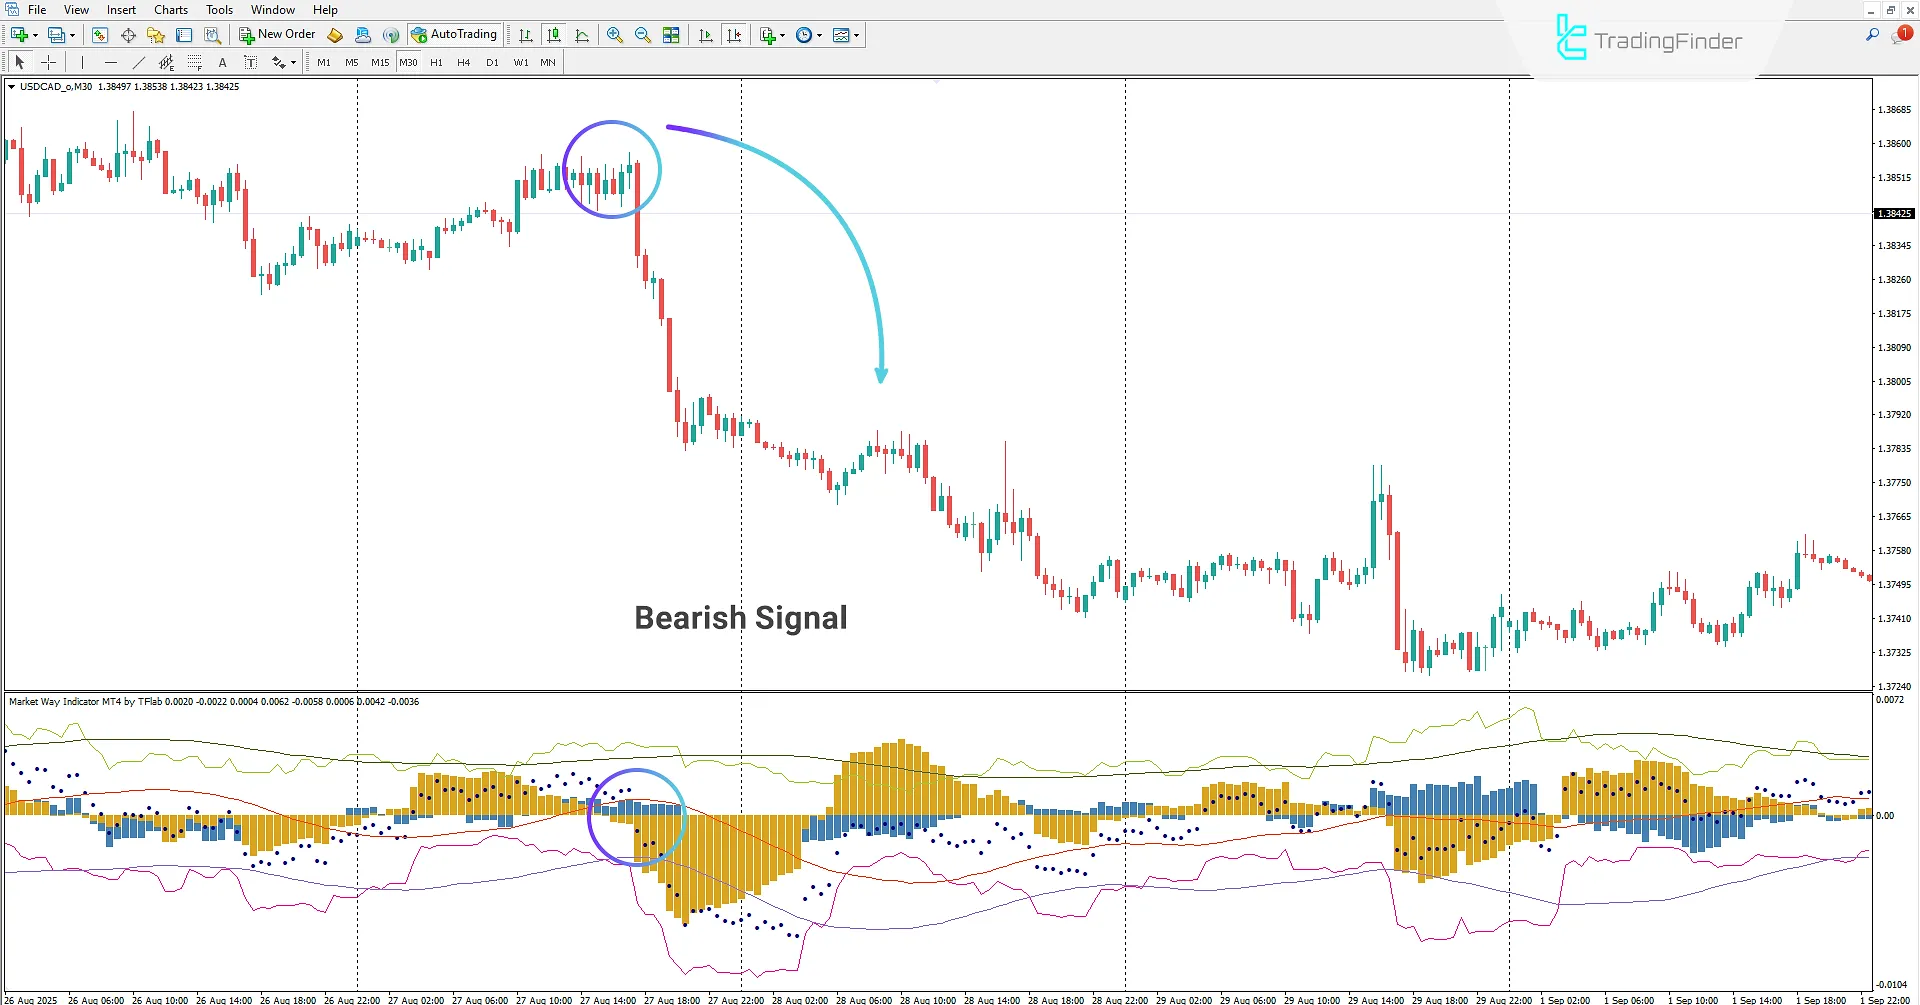
On the 30-minute chart of the USD/CAD pair, traders can detect selling pressure by analyzing the Market Way oscillator.
When blue points move below the zero level and the histogram simultaneously turns yellow, this condition is interpreted as confirmation of selling pressure.
Traders can use this wave of selling pressure to enter short trades and adjust their positions accordingly.

Market Way Indicator Settings
Below are the adjustable settings of the Market Way Indicator:

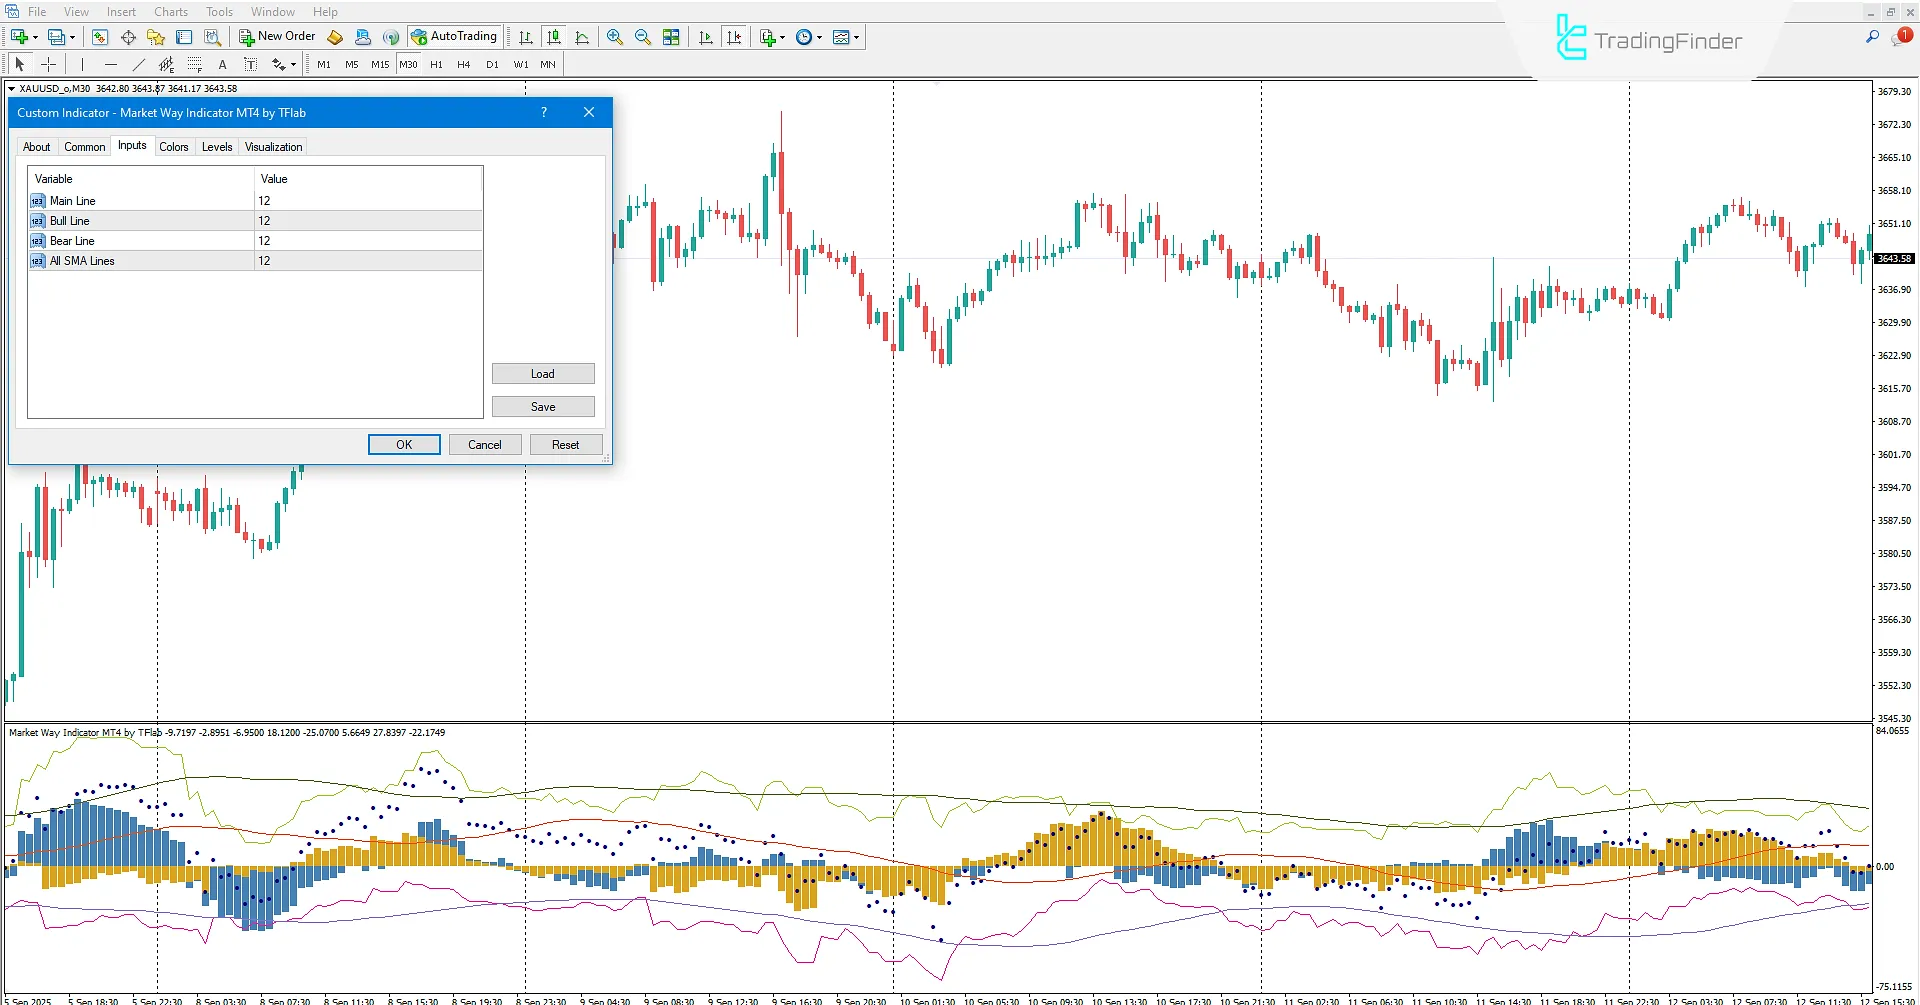
- Main Line: Defines the period used by the indicator to calculate the difference between candle open and close prices. These calculations generate the dark blue points that represent buy or sell pressure;
- Bull Line: Designed for bullish candles, its period specifies how the indicator analyzes and displays upward price movements;
- Bear Line: Related to bearish candles, its period determines how selling pressure and downward price movements are shown on the oscillator;
- All SMA Lines: Defines the moving average period used to measure buy and sell pressure and to display the blue and yellow histograms.
Conclusion
The Market Way Indicator is a specialized oscillator developed to display buy and sell pressure levels in forex and crypto markets, giving traders deeper market trend analysis.
Using blue points and blue/yellow histograms, this indicator highlights buy and sell pressure levels so that traders can assess market direction and the intensity of buyers’ and sellers’ moves with precision.
Market Way Indicator for MetaTrader 4 PDF
Market Way Indicator for MetaTrader 4 PDF
Click to download Market Way Indicator for MetaTrader 4 PDFWhat is the Market Way Indicator?
The Market Way Indicator is a specialized oscillator designed to identify buy and sell pressure in the market and is available on the MetaTrader 4 platform. It enables traders to detect the probable market direction.
What is the structure and data display method of the Market Way Indicator?
This indicator consists of histograms, blue points, and oscillator lines:
- Blue points: Show the difference between candle open and close prices in a specific period; positive points indicate buying pressure, negative points indicate selling pressure;
- Green line and blue histogram: The green line’s distance from the positive moving average indicates the strength of buying pressure;
- Red line and yellow histogram: The red line’s distance from the negative moving average reflects the strength of selling pressure.


