![MARSICD Composite Indicator for MT4 Download – Free – [TradingFinder]](https://cdn.tradingfinder.com/image/399220/13-133-en-marsicd-mt4-01.webp)
![MARSICD Composite Indicator for MT4 Download – Free – [TradingFinder] 0](https://cdn.tradingfinder.com/image/399220/13-133-en-marsicd-mt4-01.webp)
![MARSICD Composite Indicator for MT4 Download – Free – [TradingFinder] 1](https://cdn.tradingfinder.com/image/399221/13-133-en-marsicd-mt4-02.webp)
![MARSICD Composite Indicator for MT4 Download – Free – [TradingFinder] 2](https://cdn.tradingfinder.com/image/399218/13-133-en-marsicd-mt4-03.webp)
![MARSICD Composite Indicator for MT4 Download – Free – [TradingFinder] 3](https://cdn.tradingfinder.com/image/399219/13-133-en-marsicd-mt4-04.webp)
The MARSICD composite indicator is designed for MetaTrader 4 to detect trend direction and momentum changes in financial markets.
This trading toolgenerates buy and sell signals by combining adaptive moving averages (AMA and RMA) with relative strength index (RSI) calculations. It displays the RSI and its complementary line and plots their smoothed versions.
MARSICD Oscillator Specification Table
Below is the technical specification of the MARSICD index indicator.
Indicator Categories: | Oscillators MT4 Indicators Signal & Forecast MT4 Indicators Currency Strength MT4 Indicators RSI Indicators for MetaTrader 4 |
Platforms: | MetaTrader 4 Indicators |
Trading Skills: | Intermediate |
Indicator Types: | Reversal MT4 Indicators |
Timeframe: | Multi-Timeframe MT4 Indicators |
Trading Style: | Day Trading MT4 Indicators Scalper MT4 Indicators Swing Trading MT4 Indicators |
Trading Instruments: | Forward Market MT4 Indicators Stock Market MT4 Indicators Cryptocurrency MT4 Indicators Forex MT4 Indicators |
MARSICD Index Indicator
The MARSICD oscillator enables traders to effectively identify trend movements by filtering out market noise.
It is useful for short-term and long-term traders, as it adapts to various timeframes and market conditions.
Buy Signal
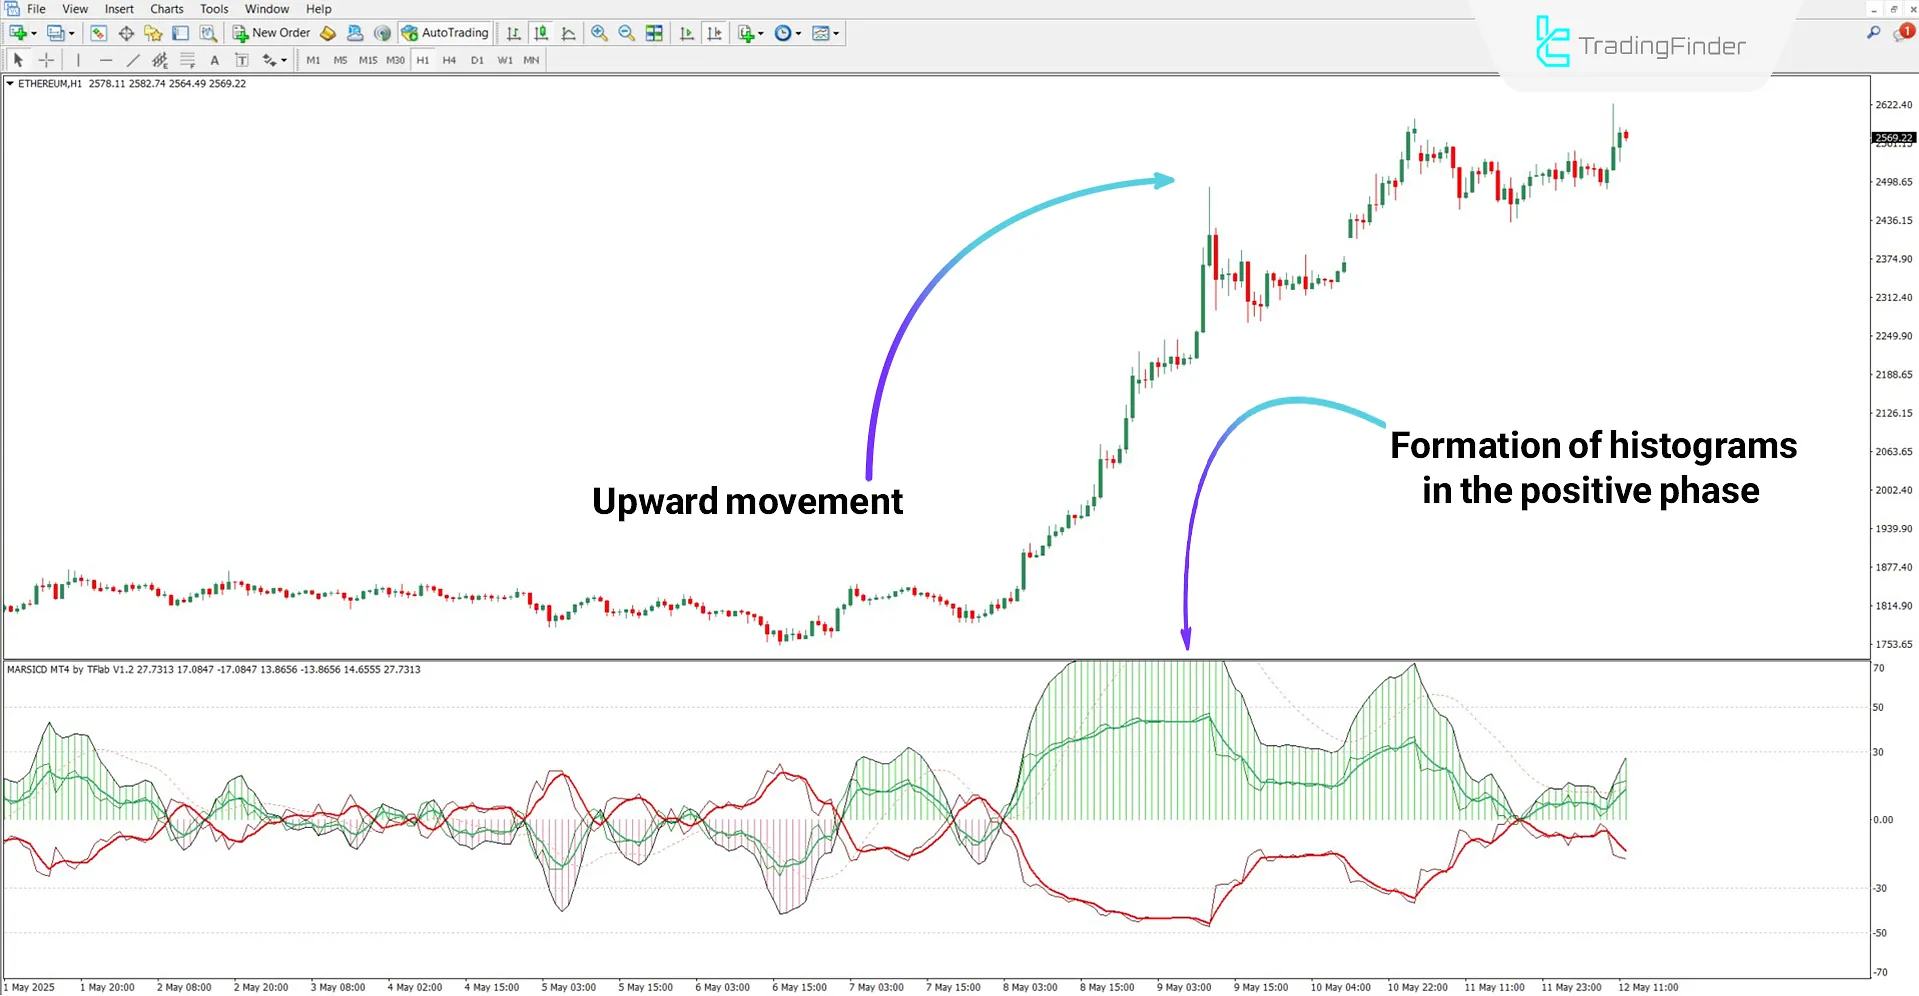
According to the 1-hour chart of the cryptocurrency Ethereum (ETH), the thin green line (ARSI), along with the smoothed RSI line, is movingupward and oscillating within the positive phase of the oscillator. Additionally, tall histograms are forming in the positive zone, which are interpreted as buy entry signals.

Sell Signal
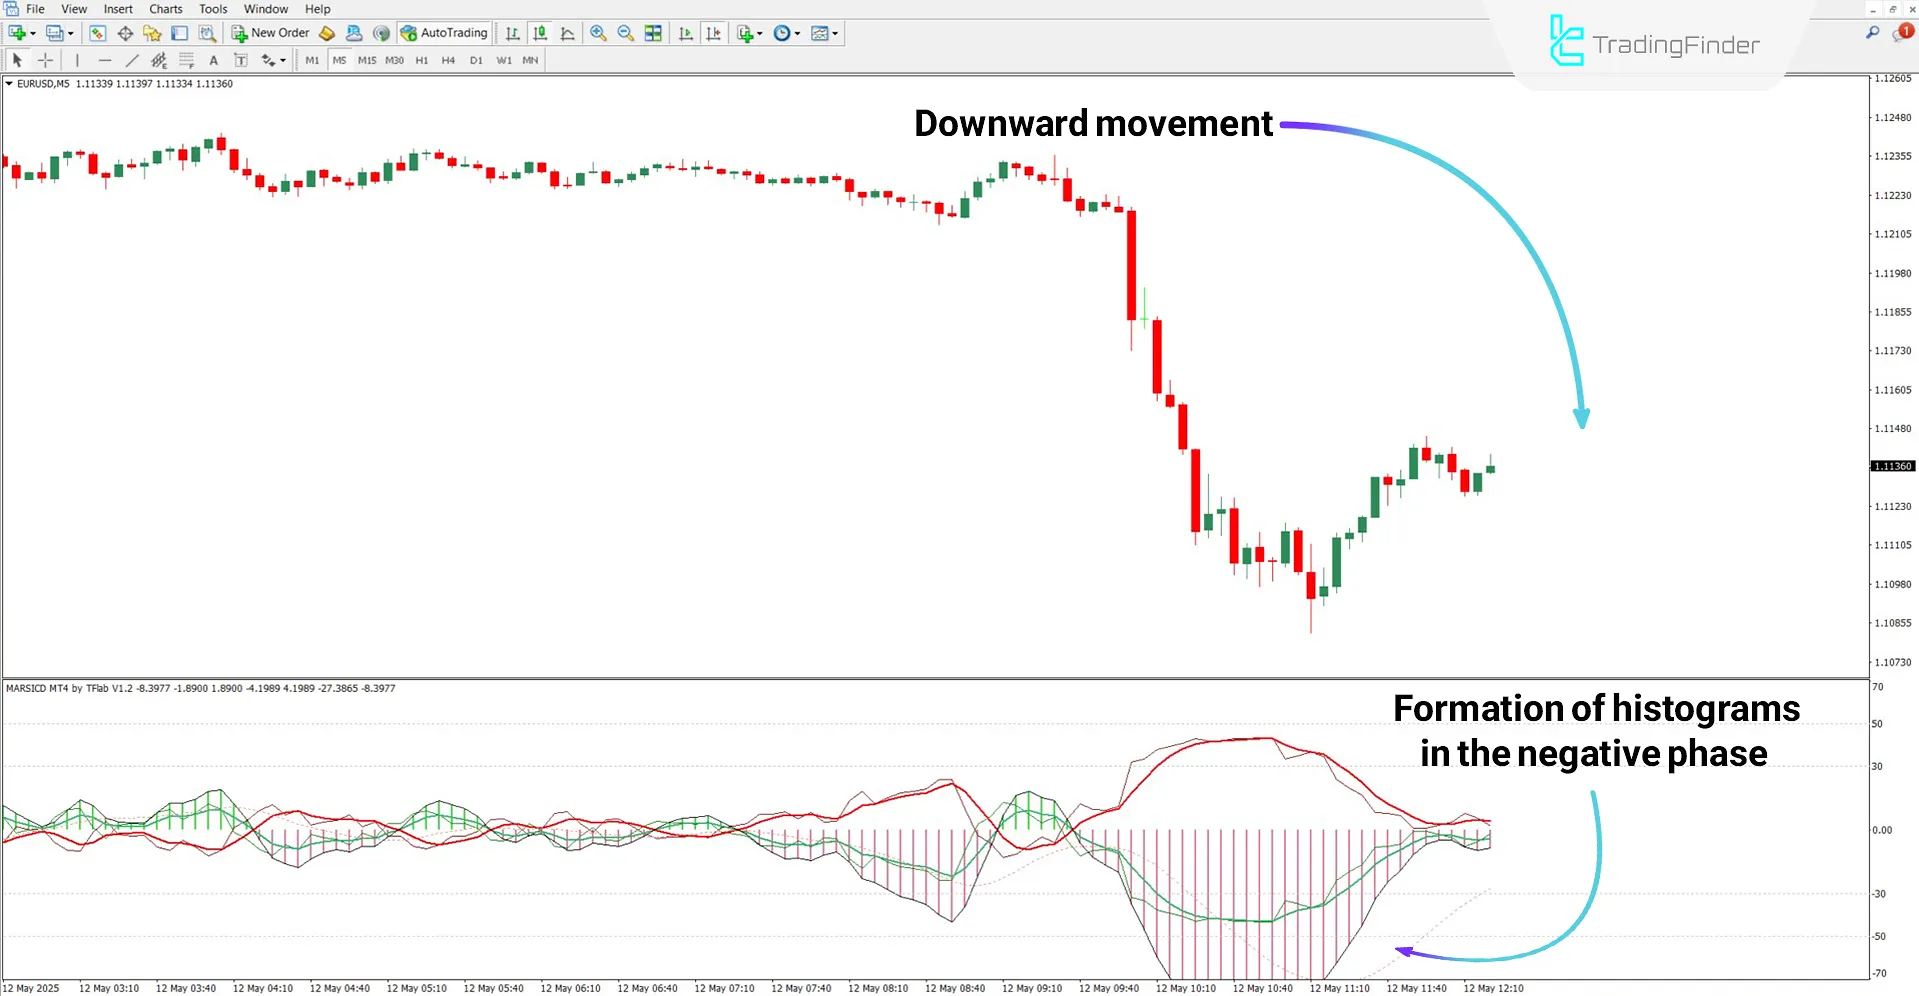
Based on the 5-minute chart of the EUR/USD pair, the smoothed RSI and ARSI lines have crossed below the oscillator's midline and fluctuated in the negative zone. At the same time, the formation of red histograms in the oscillator's lower part confirms the strength of the bearish trend.

MARSICD Indicator Settings
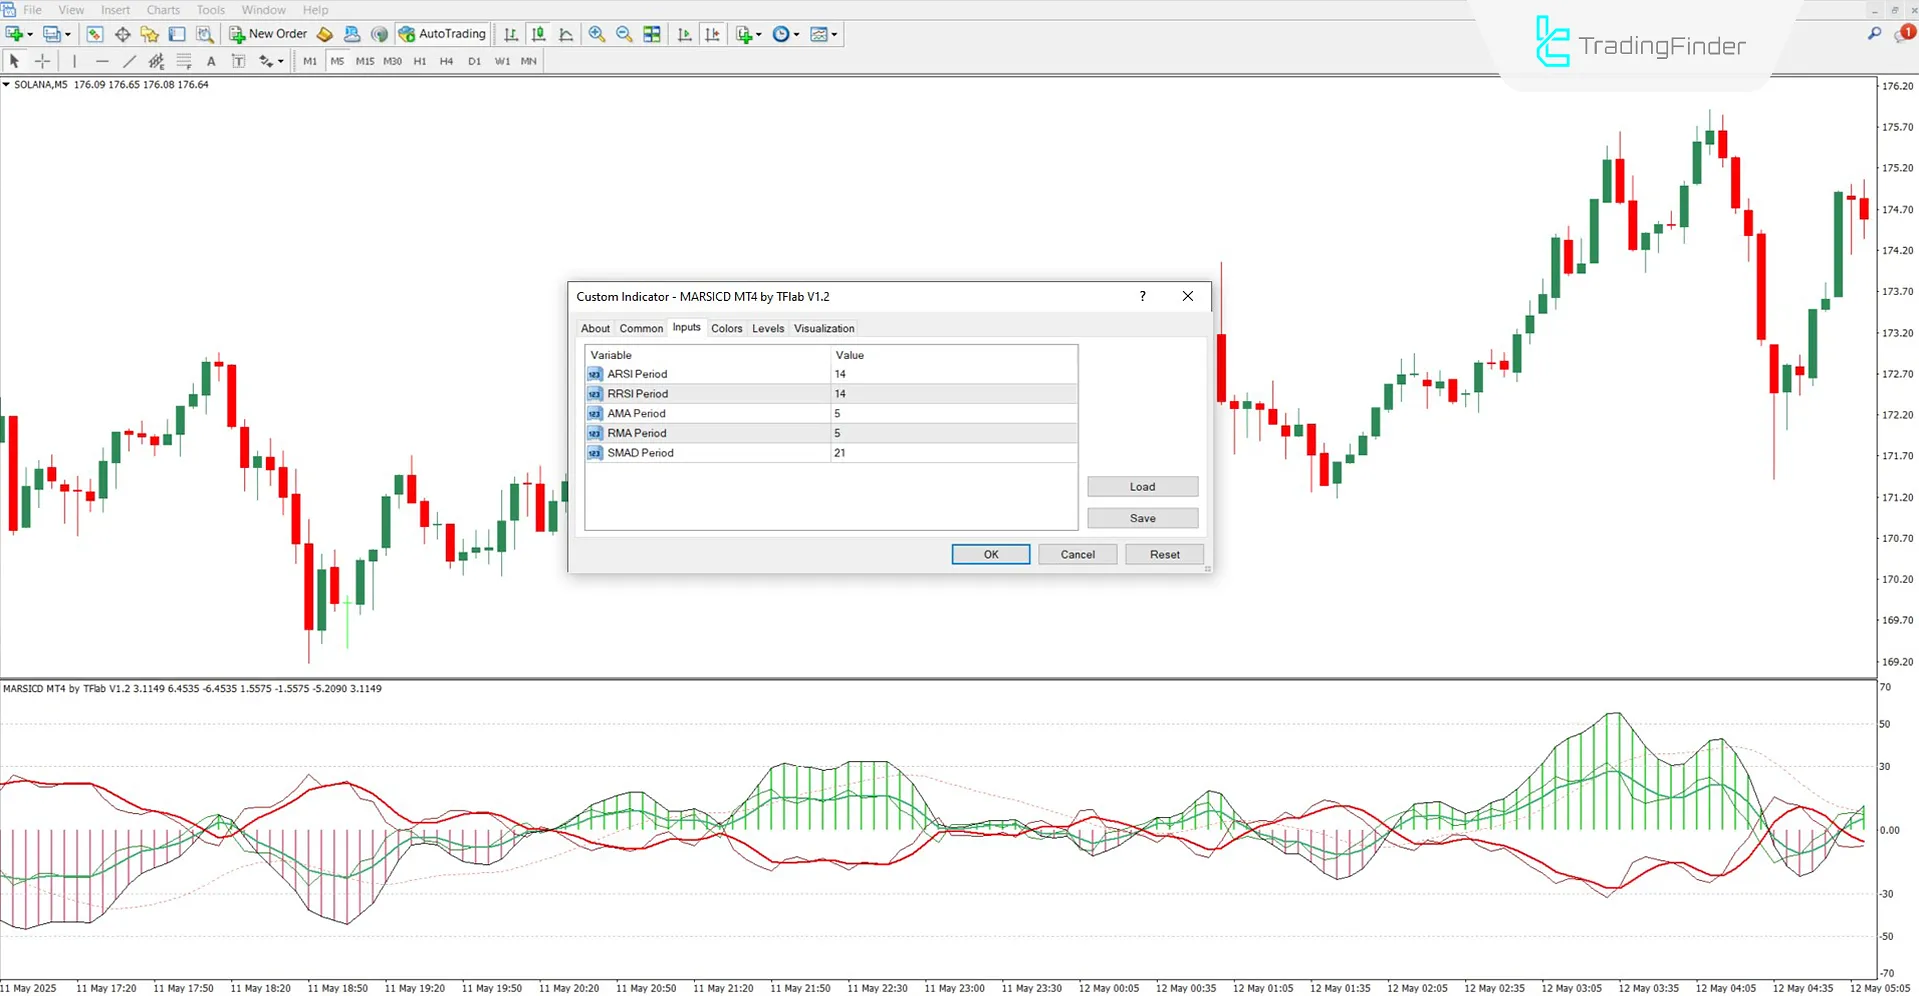
The following options are available in the MARSICD oscillator settings:

- ARSI Period: This defines the time period for calculating the first RSI line
- RRSI Period: Sets the period for the second RSI calculation
- AMA Period: Specifies the length of the adaptive moving average
- RMA Period: Determines the period for the regular moving average
- SMAD Period: Controls the smoothing factor for histogram display in the oscillator window
Conclusion
The MARSICD composite indicator is built upon three core concepts: Moving Averages, RSI, and Convergence/Divergence. It is designed to identify trends and changes in market momentum.
This indicator is equipped with histogram bars that signal the start of new trends depending on the oscillator's positive or negative phase. It also smooths these histogram bars and displays them as a dashed oscillating line.
MARSICD Composite MT4 PDF
MARSICD Composite MT4 PDF
Click to download MARSICD Composite MT4 PDFCan the MARSICD oscillator be used on higher timeframes?
Yes, it is a multi-timeframe indicator and works across all timeframe levels.
What is the role of histograms in the MARSICD index indicator?
Histograms indicate the beginning and strength of a price trend.


