![McGinley Dynamic Indicator for MetaTrader 4 Download – Free – [TFlab]](https://cdn.tradingfinder.com/image/319981/4-79-en-mcginley-dynamic-mt4-1.webp)
![McGinley Dynamic Indicator for MetaTrader 4 Download – Free – [TFlab] 0](https://cdn.tradingfinder.com/image/319981/4-79-en-mcginley-dynamic-mt4-1.webp)
![McGinley Dynamic Indicator for MetaTrader 4 Download – Free – [TFlab] 1](https://cdn.tradingfinder.com/image/319982/4-79-en-mcginley-dynamic-mt4-2.webp)
![McGinley Dynamic Indicator for MetaTrader 4 Download – Free – [TFlab] 2](https://cdn.tradingfinder.com/image/319980/4-79-en-mcginley-dynamic-mt4-3.webp)
![McGinley Dynamic Indicator for MetaTrader 4 Download – Free – [TFlab] 3](https://cdn.tradingfinder.com/image/319983/4-79-en-mcginley-dynamic-mt4-4.webp)
The McGinley Dynamic Indicator, introduced by John C. McGinley in the 1990s, is a technical analysis tool used in financial markets.
The main goal of designing this MT4 volatile indicator was to reduce delays in traditional moving averages and provide a more accurate view of price trends.
McGinley Dynamic Indicator Table
The table below summarizes the features of the McGinley Dynamic Indicator:
Indicator Categories: | Support & Resistance MT4 Indicators Volatility MT4 Indicators Trading Assist MT4 Indicators |
Platforms: | MetaTrader 4 Indicators |
Trading Skills: | Elementary |
Indicator Types: | Reversal MT4 Indicators |
Timeframe: | Multi-Timeframe MT4 Indicators |
Trading Style: | Day Trading MT4 Indicators |
Trading Instruments: | Forward Market MT4 Indicators Commodity Market MT4 Indicators Stock Market MT4 Indicators Cryptocurrency MT4 Indicators Forex MT4 Indicators |
Indicator at a Glance
With its automatic settings, the McGinley Dynamic Indicator reacts faster to price changes than traditional moving averages.
As a result, in sudden market changes, the indicator performs more accurately and provides signals at the best possible time.
Indicator in an Uptrend
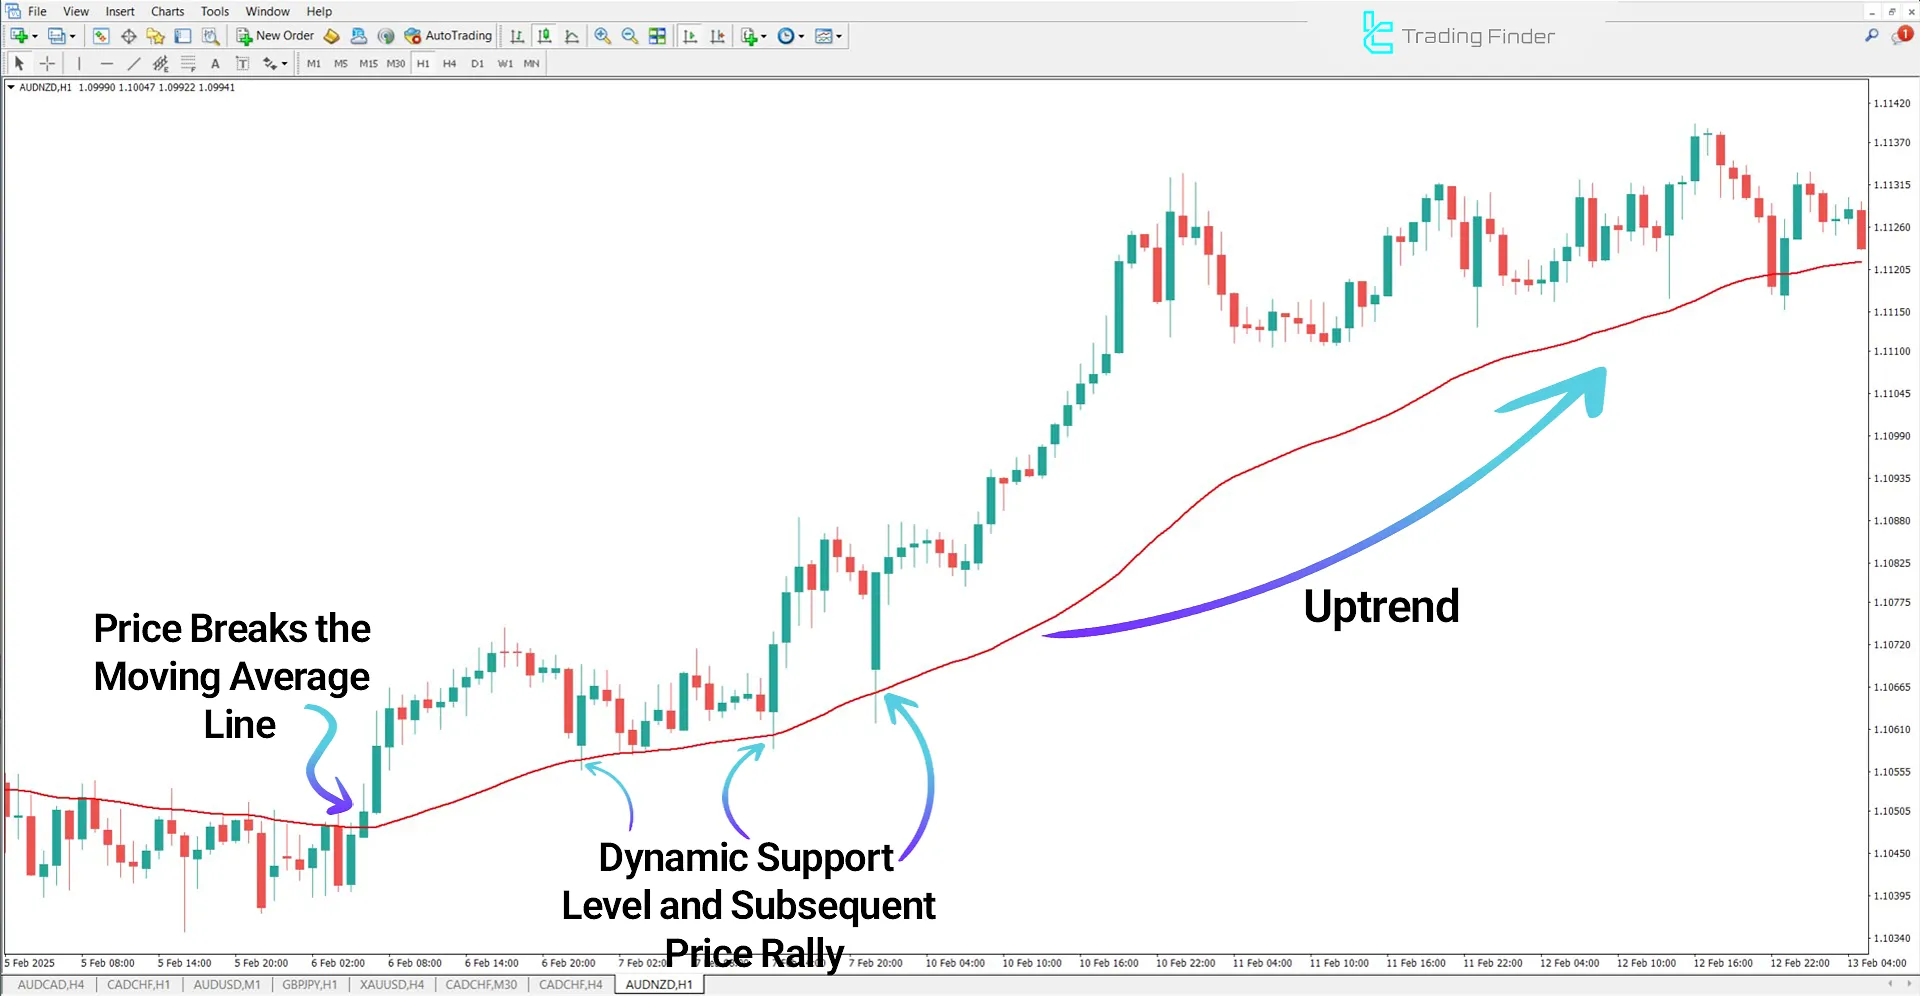
In the 1-hour AUD/NZD chart, when the McGinley moving average is broken by price, it uptrends.
After the price corrects to the indicator’s dynamic level, this area acts as a support zone, leading to the resumption of the upward price movement.

Indicator in a Downtrend
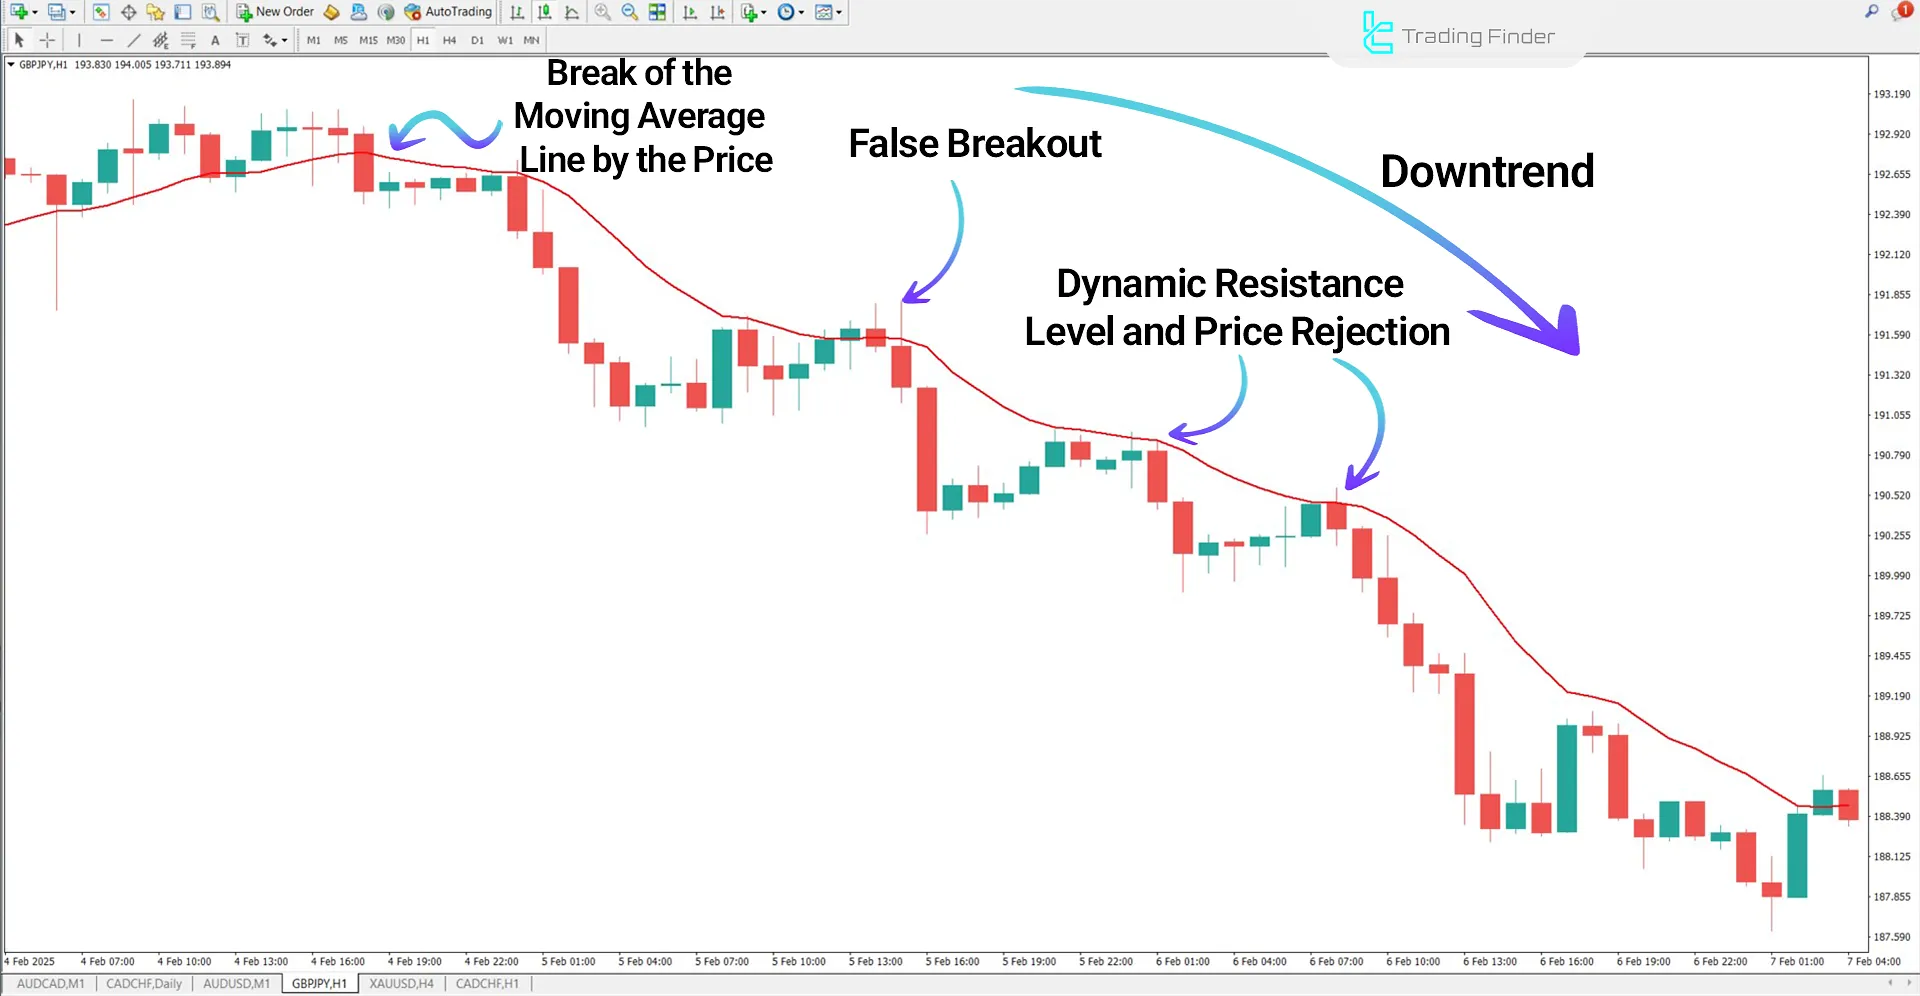
In the GBP/JPY price chart, the price decreasing and breaking the dynamic line indicates that the market is entering a downtrend phase.
Afterward, the price returns to this area, but it faces selling pressure as it encounters the dynamic resistance level, preventing further price growth.

McGinley Dynamic Indicator Settings
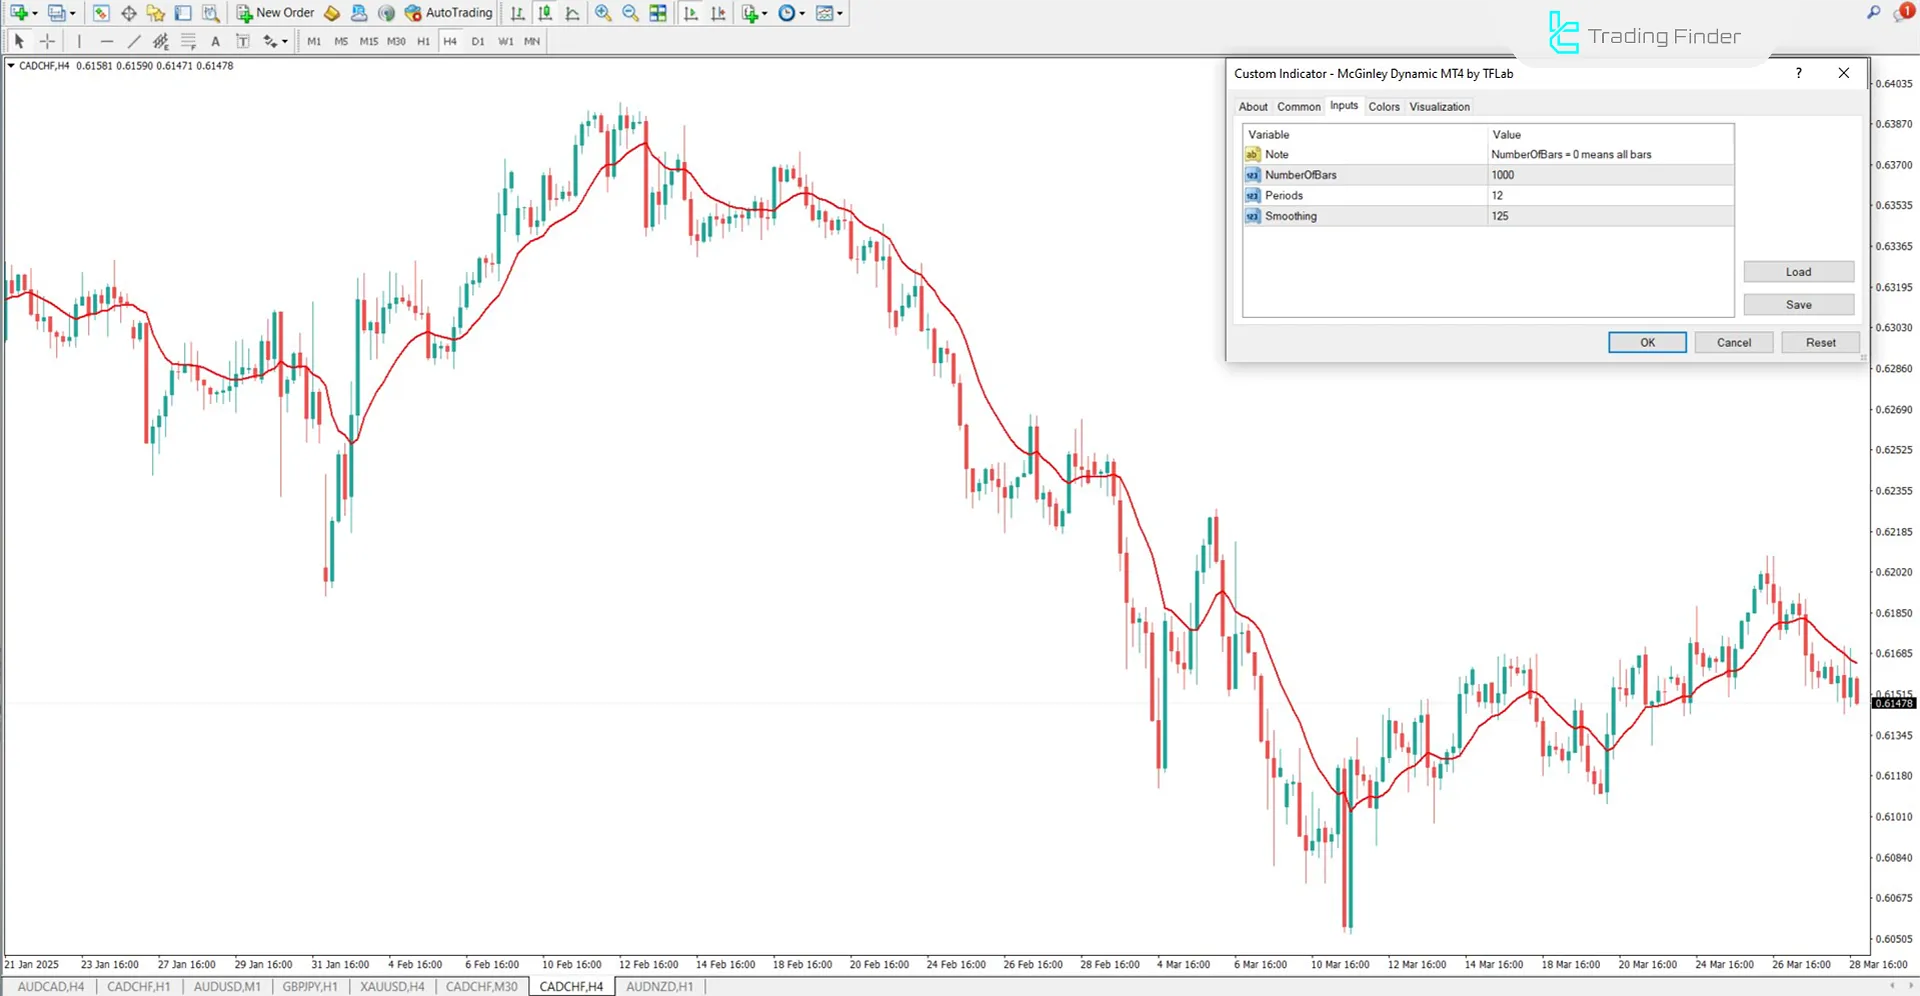
The settings for this McGinley Dynamic Indicator are displayed below:

- Number of Bars: The number of candles used for calculations
- Periods: The number of periods used to calculate the dynamic moving average
- Smoothing: Specifies the level of smoothing to reduce fluctuations and soften the indicator’s line
Conclusion
Although the calculation formula of the McGinley Dynamic Indicator may seem more complex than that of traditional indicators, its use is quite simple, and it can be applied in the MT4 trading platform.
Moreover, this indicator increases the accuracy of trading signals by reducing delays compared to traditional moving averages (EMA), leading to more accurate trend analysis.
McGinley Dynamic MT4 PDF
McGinley Dynamic MT4 PDF
Click to download McGinley Dynamic MT4 PDFWhat is the McGinley Dynamic Indicator?
The McGinley Dynamic Indicator is a type of smart moving average designed to reduce the delays of traditional averages and offer a faster response to market changes.
What is the difference between McGinley Dynamic and simple or exponential moving averages?
Unlike SMA and EMA, which may provide delayed signals in volatile conditions, the McGinley Dynamic Indicator reduces delays and responds quicker to price fluctuations.


