


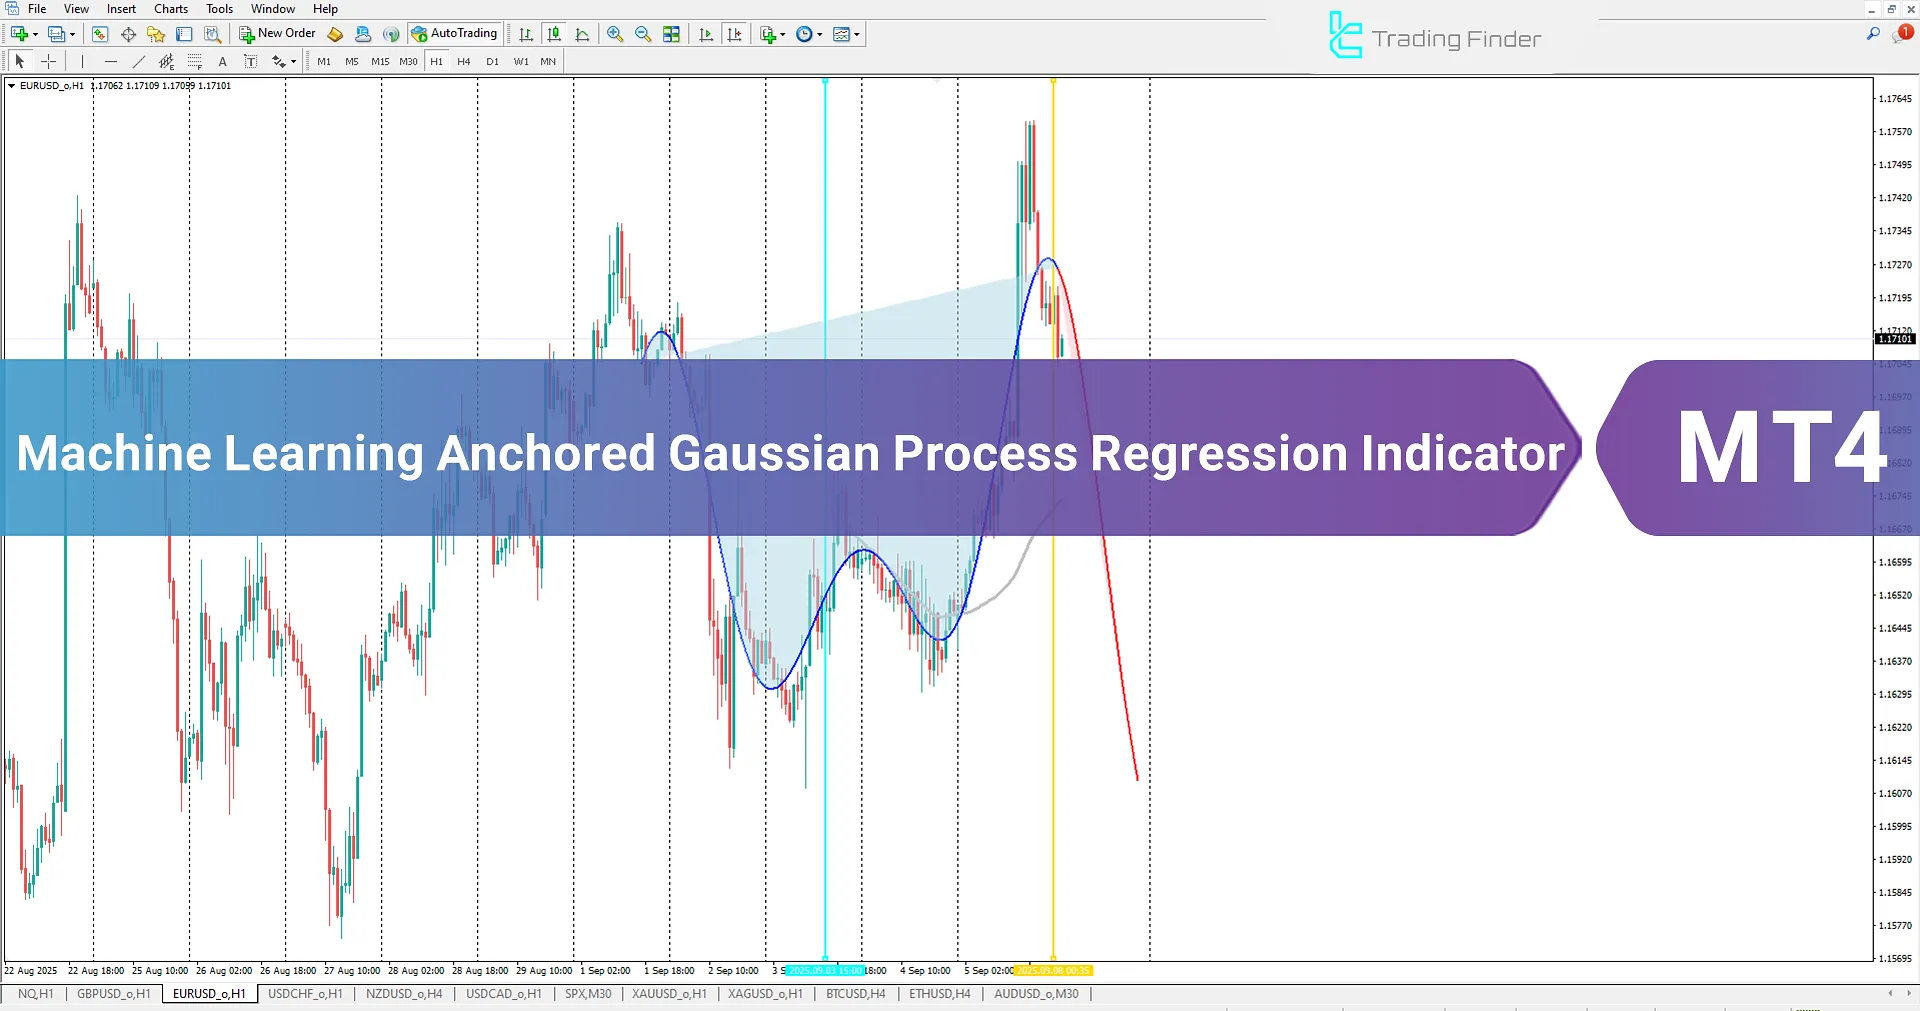
Caption: Predicting price movement using the Machine Learning-Based Gaussian Process Regression indicator
The Machine Learning-Based Gaussian Process Regression indicator is a practical tool in MetaTrader 4 that performs its calculations based on the K-Means algorithm.
Forex traders can use this indicator to study past price movement patterns and view price forecasts for future moves, enabling them to make more specialized trading decisions.
Gaussian Process Regression Indicator Table based on Machine Learning
Below, the information related to the Machine Learning-Based Gaussian Process Regression indicator is provided:
Indicator Categories: | Signal & Forecast MT4 Indicators Trading Assist MT4 Indicators Bands & Channels MT4 Indicators Machine Learning Indicators for MetaTrader 4 |
Platforms: | MetaTrader 4 Indicators |
Trading Skills: | Advanced |
Indicator Types: | Leading MT4 Indicators Trend MT4 Indicators |
Timeframe: | Multi-Timeframe MT4 Indicators |
Trading Style: | Day Trading MT4 Indicators Intraday MT4 Indicators Scalper MT4 Indicators |
Trading Instruments: | Share Stocks MT4 Indicators Indices Market MT4 Indicators Stock Market MT4 Indicators Cryptocurrency MT4 Indicators Forex MT4 Indicators |
Machine Learning-Based Gaussian Process Regression indicator at a Glance
The Machine Learning-Based Gaussian Process Regression indicator allows traders to forecast the future trend of price movement.
It performs its calculations between two vertical lines, displaying past and projected future price behavior, which can be used as a price movement model for executing trading strategies.
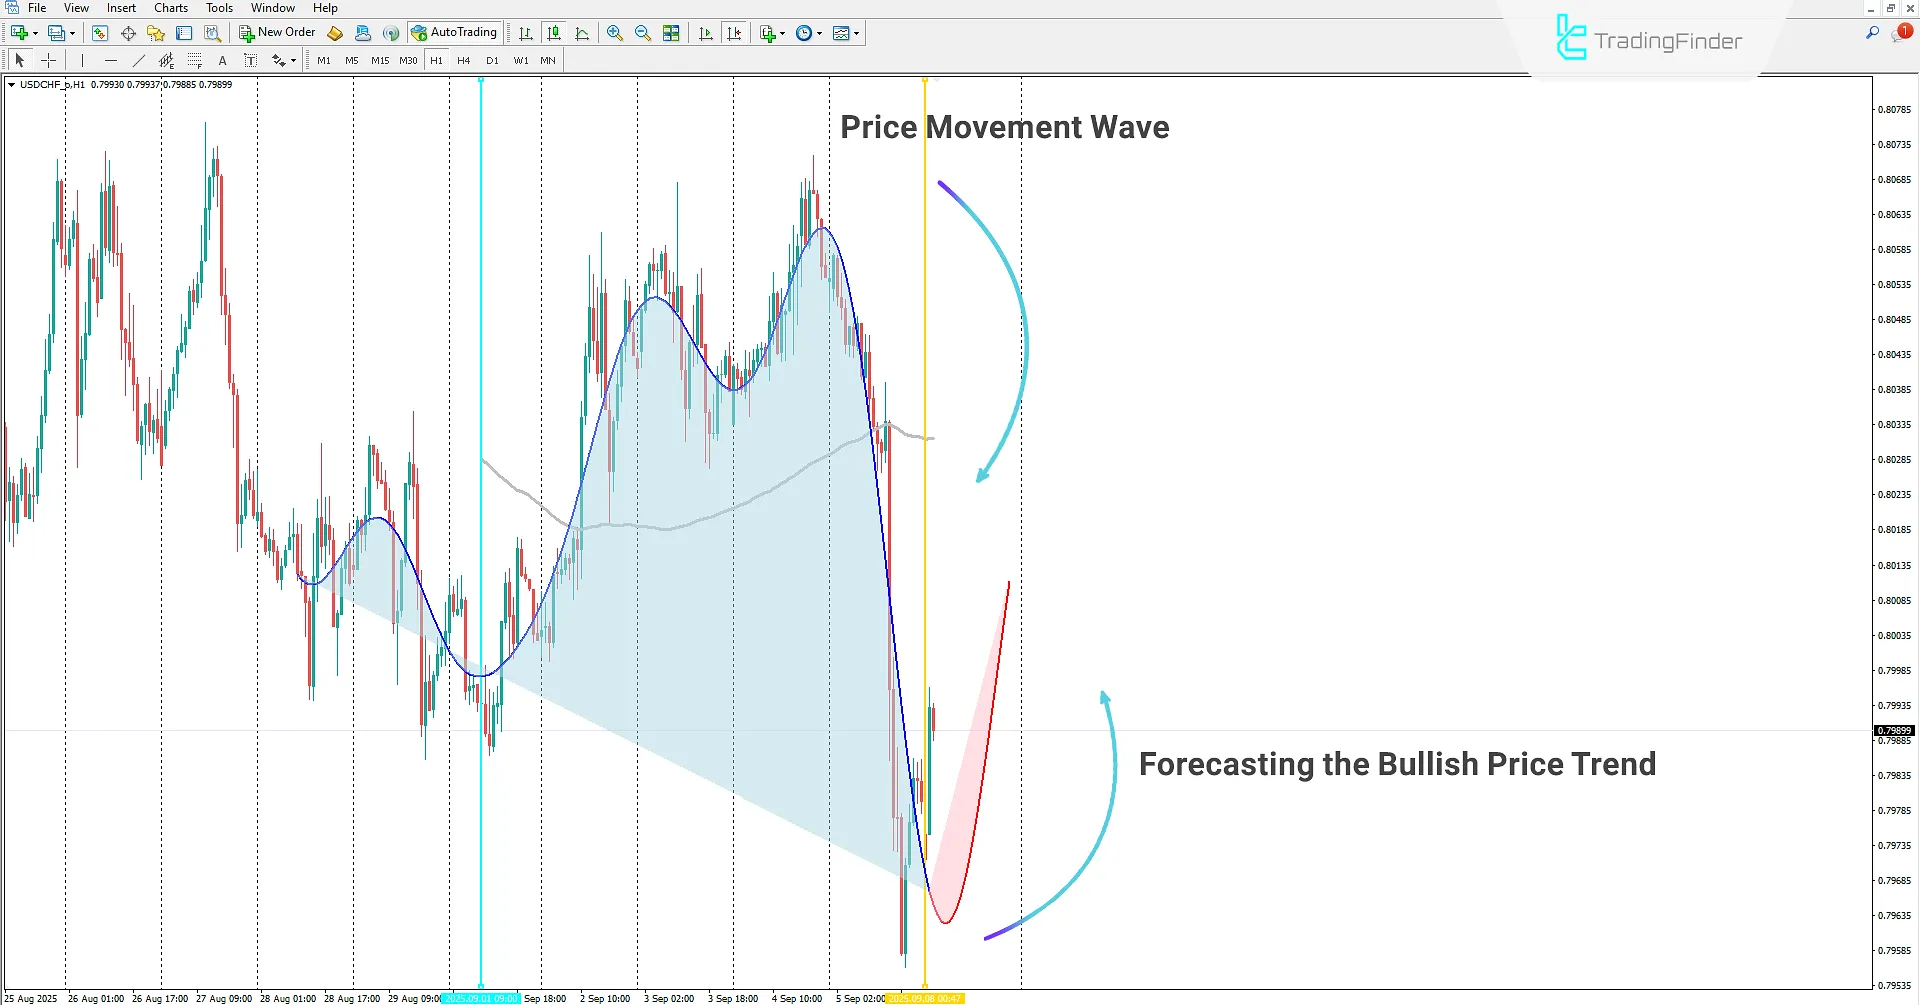
Uptrend in the Machine Learning-Based Gaussian Process Regression indicator
On the 1-hour USD/CHF chart, the Gaussian Process Regression Indicator with Machine Learning is applied.
The indicator performs its calculations using two vertical lines and forecasts the future behavior of price.
By combining technical analysis with this indicator, traders can identify bullish market trends and enter buy positions when the uptrend forecast is confirmed.
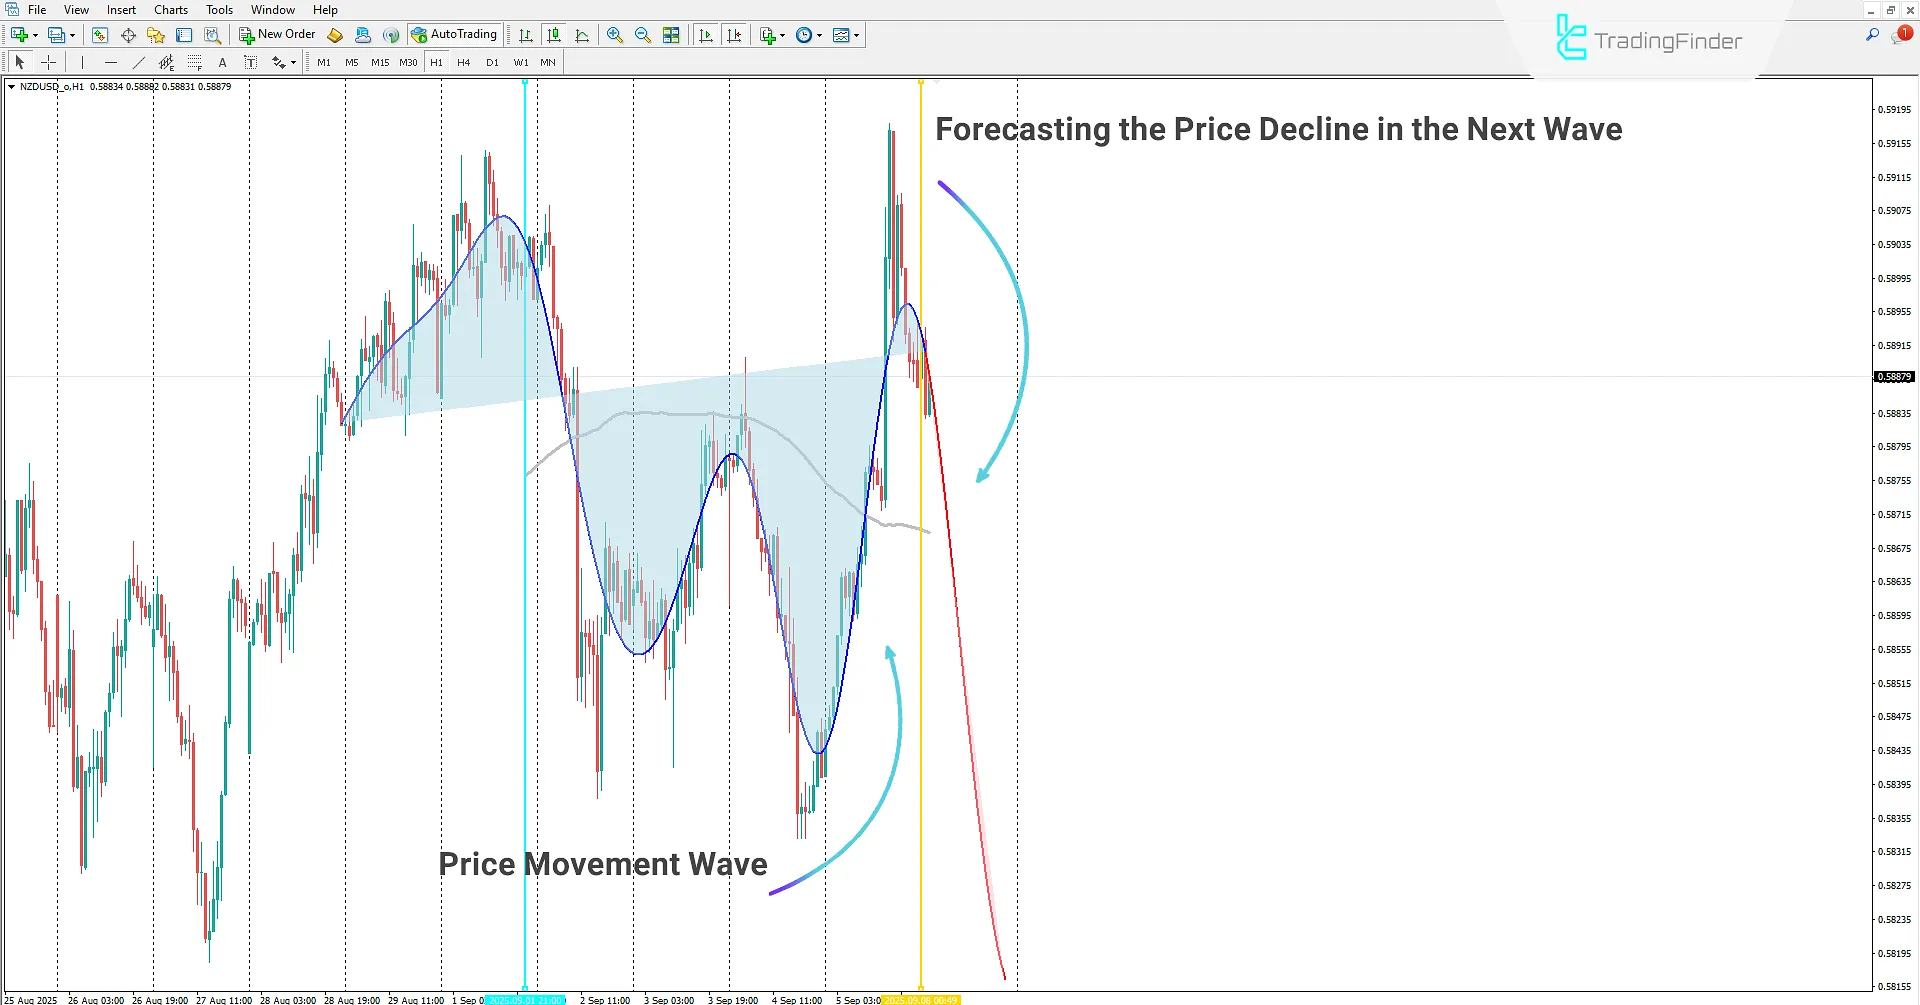
Downtrend in the Machine Learning-Based Gaussian Process Regression indicator
On the 1-hour NZD/USD chart, traders can use the Gaussian Process Regression Indicator with Machine Learning to analyze price behavior in greater detail.
The indicator provides a price forecast for the next wave of movement, and users can adjust the calculation range and forecast horizon using the two vertical lines.
In this example, the indicator forecasts a bearish trend, which can be used as a signal for entering sell positions.
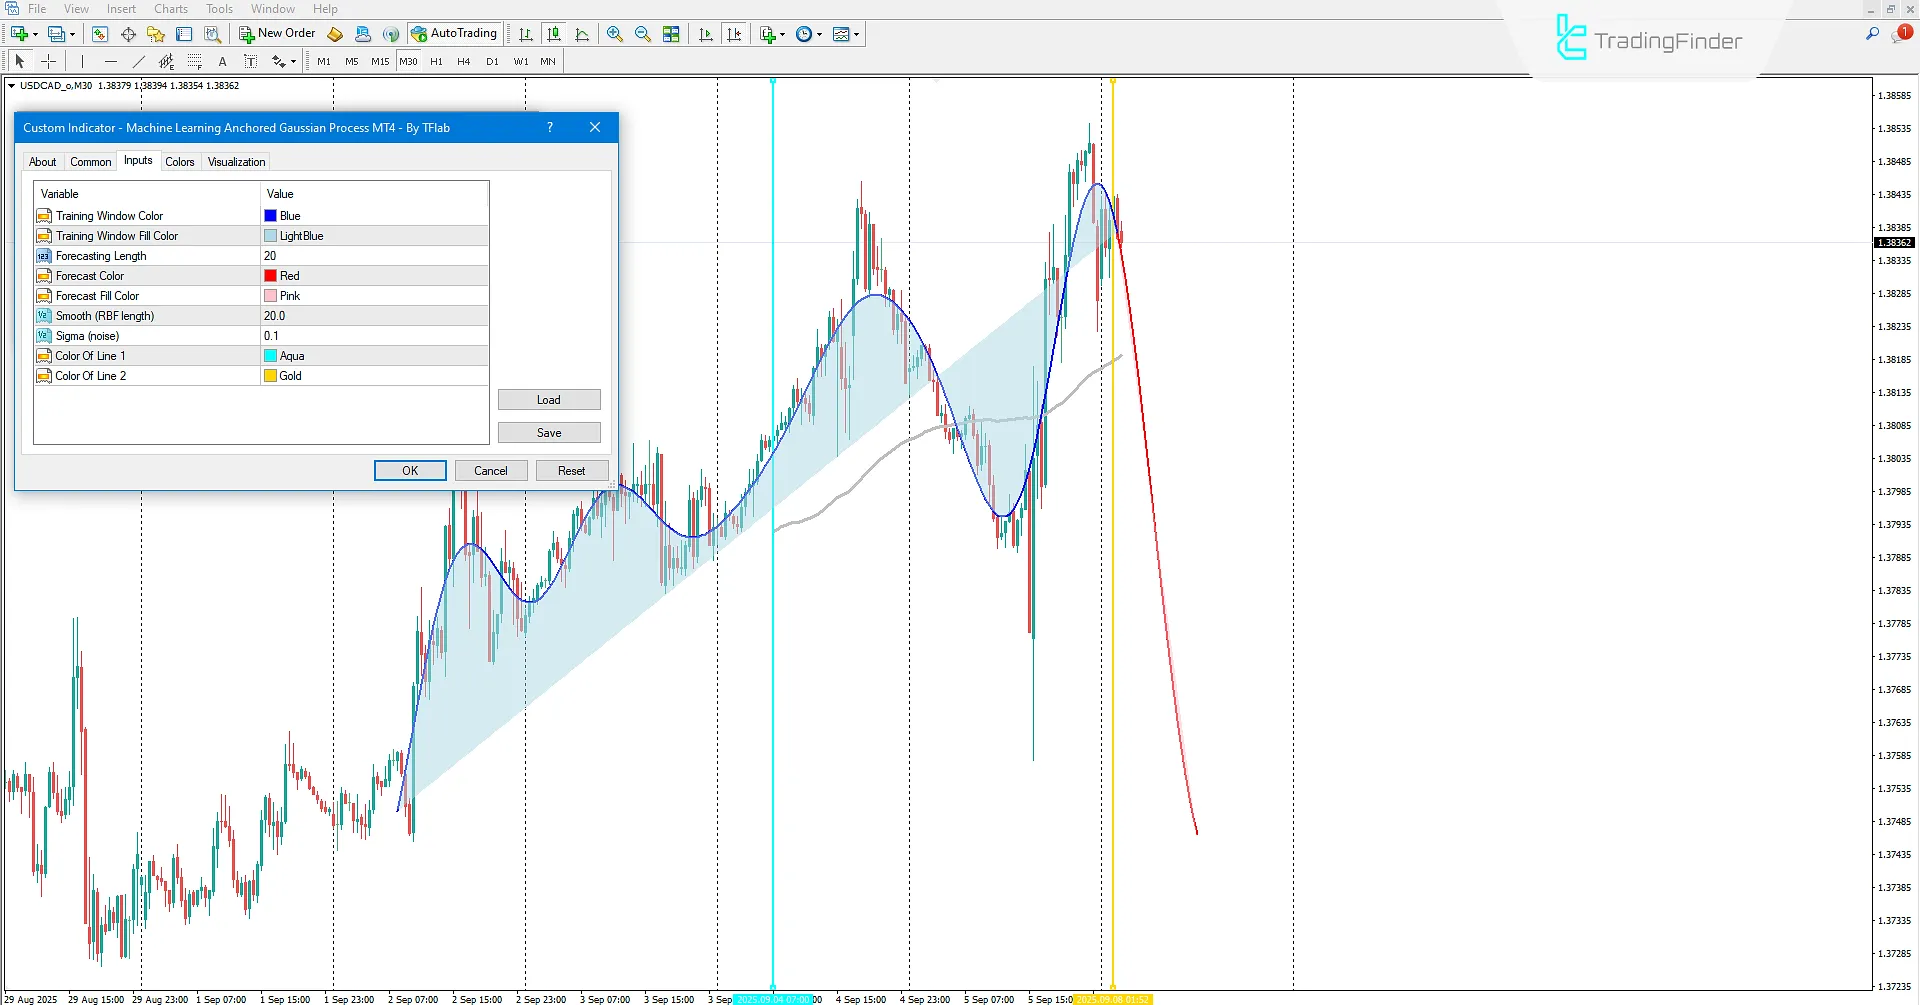
Gaussian Process Regression Indicator Settings based on Machine Learning
Below, the settings of the Machine Learning-Based Gaussian Process Regression indicator are provided:
- Training Window Color: Color of calculation line;
- Training Window Fill Color: Color of calculation zone;
- Forecasting Length: Defines the forecast horizon based on candlesticks;
- Forecast Color: Color of forecast line;
- Forecast Fill Color: Color of forecast zone;
- Smooth (RBF length): Defines smoothness and RBF calculations; the larger the value, the wider the RBF range. the smaller the value, the sharper and steeper the line;
- Sigma (noise): Defines the noise level applied in calculations;
- Color Of Line 1: Color of the first line;
- Color Of Line 2: Color of the second line.
Conclusion
The Machine Learning-Based Gaussian Process Regression Indicator is a specialized tool that relies on the K-Means algorithm to forecast price movement and display results on the chart.
Forex and crypto traders can use this indicator to forecast future price trends and conduct more comprehensive analysis of market waves.
By using two vertical lines, the indicator sets its calculation boundaries and ultimately forecasts future price behavior.
Machine Learning-Based Gaussian Process Regression Indicator in MT4 PDF
Machine Learning-Based Gaussian Process Regression Indicator in MT4 PDF
Click to download Machine Learning-Based Gaussian Process Regression Indicator in MT4 PDFWhat is the Machine Learning-Based Gaussian Process Regression Indicator?
It is a specialized forecasting tool that performs its calculations based on the K-Means algorithm, displaying both past and future price behavior on the chart.
How does the Gaussian Process Regression Indicator work?
It uses two vertical lines to define its calculation range and, based on past data, forecasts potential future price movement.


