![Market Maker X Model (MMXM) Indicator for MetaTrader 4 Download - Free - [TFlab]](https://cdn.tradingfinder.com/image/186077/4-8-en-mmxm-mt4-1.webp)
![Market Maker X Model (MMXM) Indicator for MetaTrader 4 Download - Free - [TFlab] 0](https://cdn.tradingfinder.com/image/186077/4-8-en-mmxm-mt4-1.webp)
![Market Maker X Model (MMXM) Indicator for MetaTrader 4 Download - Free - [TFlab] 1](https://cdn.tradingfinder.com/image/186072/4-8-en-mmxm-mt4-2.webp)
![Market Maker X Model (MMXM) Indicator for MetaTrader 4 Download - Free - [TFlab] 2](https://cdn.tradingfinder.com/image/186073/4-8-en-mmxm-mt4-3.webp)
![Market Maker X Model (MMXM) Indicator for MetaTrader 4 Download - Free - [TFlab] 3](https://cdn.tradingfinder.com/image/186074/4-8-en-mmxm-mt4-4.webp)
The Market Maker Model Indicator (MMXM) is a specialized tool that provides signals in critical price zones. This indicator automatically displays Fair Value Gaps (FVG) from higher timeframes on the chart. Additionally, it highlights price highs (BSL) and price lows (SSL) within these FVG zones as dashed lines.
If the price crosses the dashed line and liquidity is collected, a Change of Character (CHoCH) or CISD identified by the indicator is marked with a purple arrow.
MMXM Indicator Specifications
The table below highlights the key points of this indicator in a brief manner:
Indicator Categories: | ICT MT4 Indicators Signal & Forecast MT4 Indicators Liquidity MT4 Indicators |
Platforms: | MetaTrader 4 Indicators |
Trading Skills: | Intermediate |
Indicator Types: | Reversal MT4 Indicators |
Timeframe: | Multi-Timeframe MT4 Indicators |
Trading Style: | Day Trading MT4 Indicators |
Trading Instruments: | Forward Market MT4 Indicators Cryptocurrency MT4 Indicators Forex MT4 Indicators |
Overview of the Indicator
After forming a CHoCH and the price retraces to the FVG zone, if the indicator confirms, it provides Buy signals (Long) with a green arrow and Sell signals with a red arrow. The MMXM Market Maker Model Indicator suits ICT, Smart Money, and other liquidity-based trading styles.
MMXM Indicator in a Bullish Trend
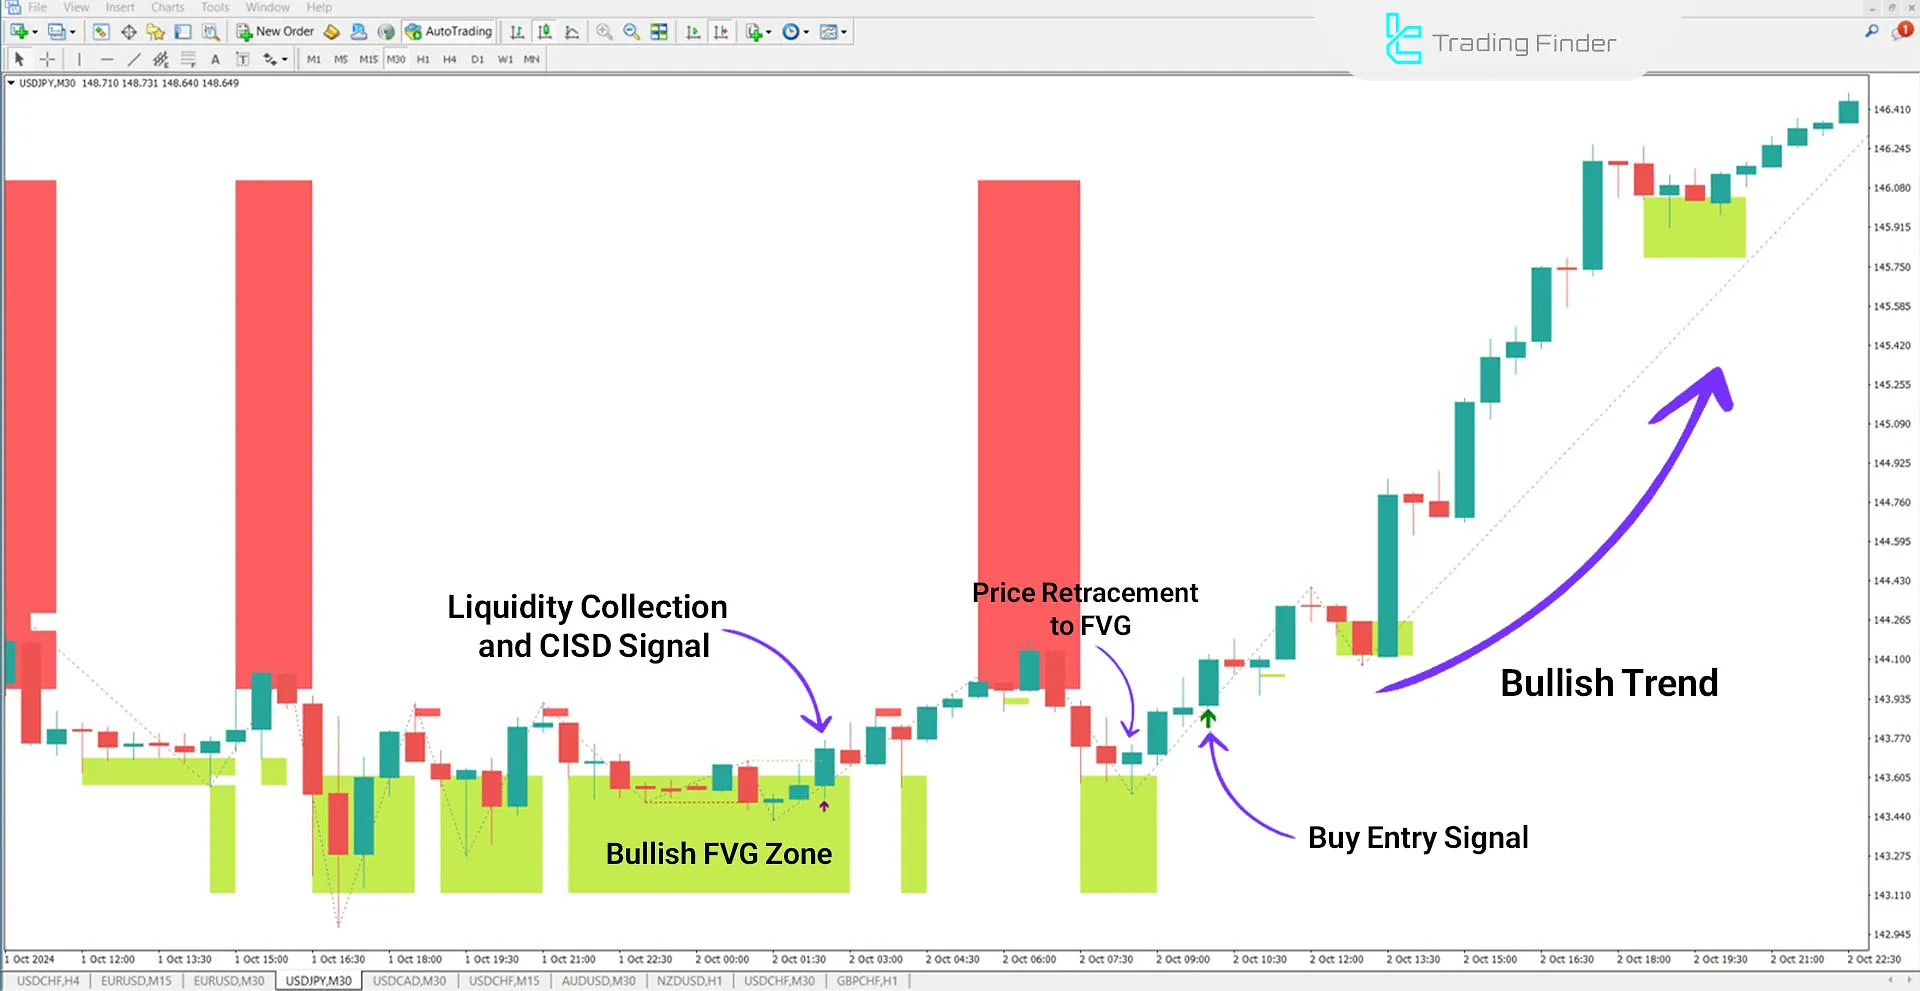
In the price chart of USD/JPY in the 30-minute timeframe, the indicator marks bullish FVG zones in green. After collecting liquidity, the price exits the FVG zone upwards with a CISD and displays a Buy Signal following a CHoCH.

MMXM Indicator in a Bearish Trend
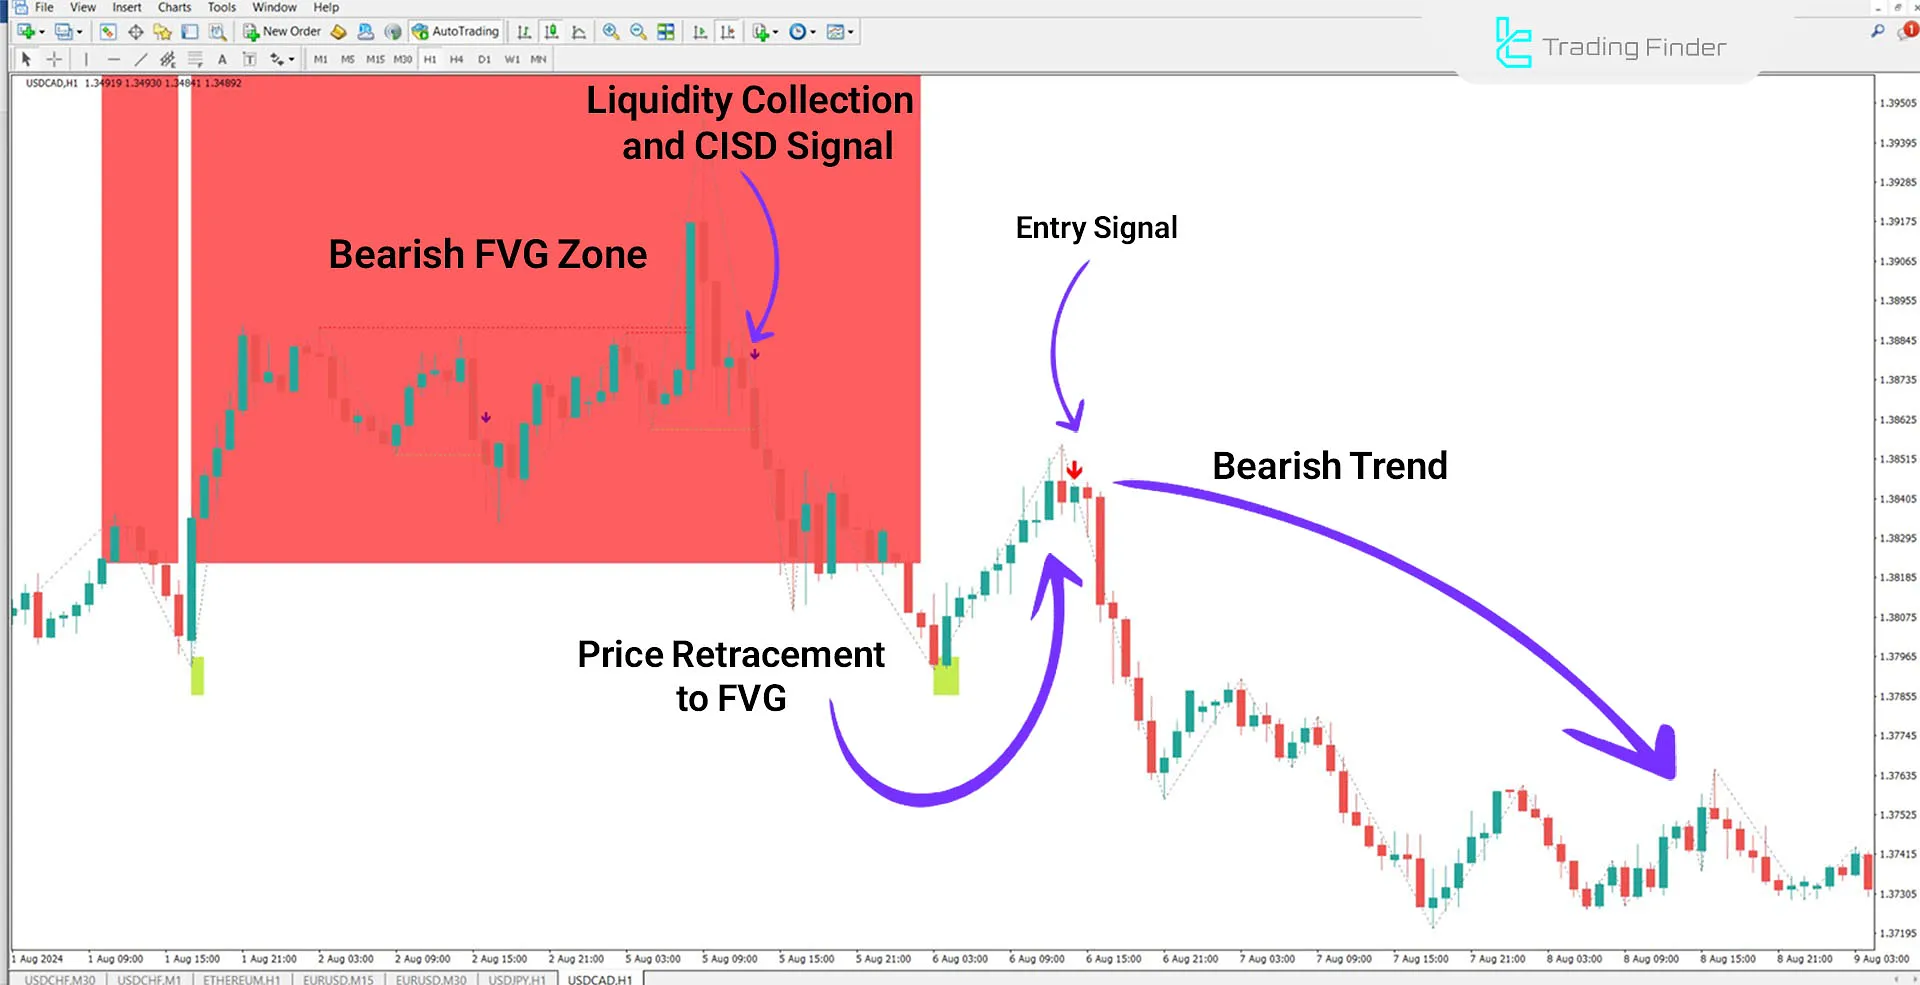
The price chart of USD/CAD in the 1-hour timeframe shows bearish FVG zones in red. The price exits the FVG zone downward for liquidity collection with a CISD, and a Sell Signal is displayed upon retracing to the FVG zone.

Indicator Settings
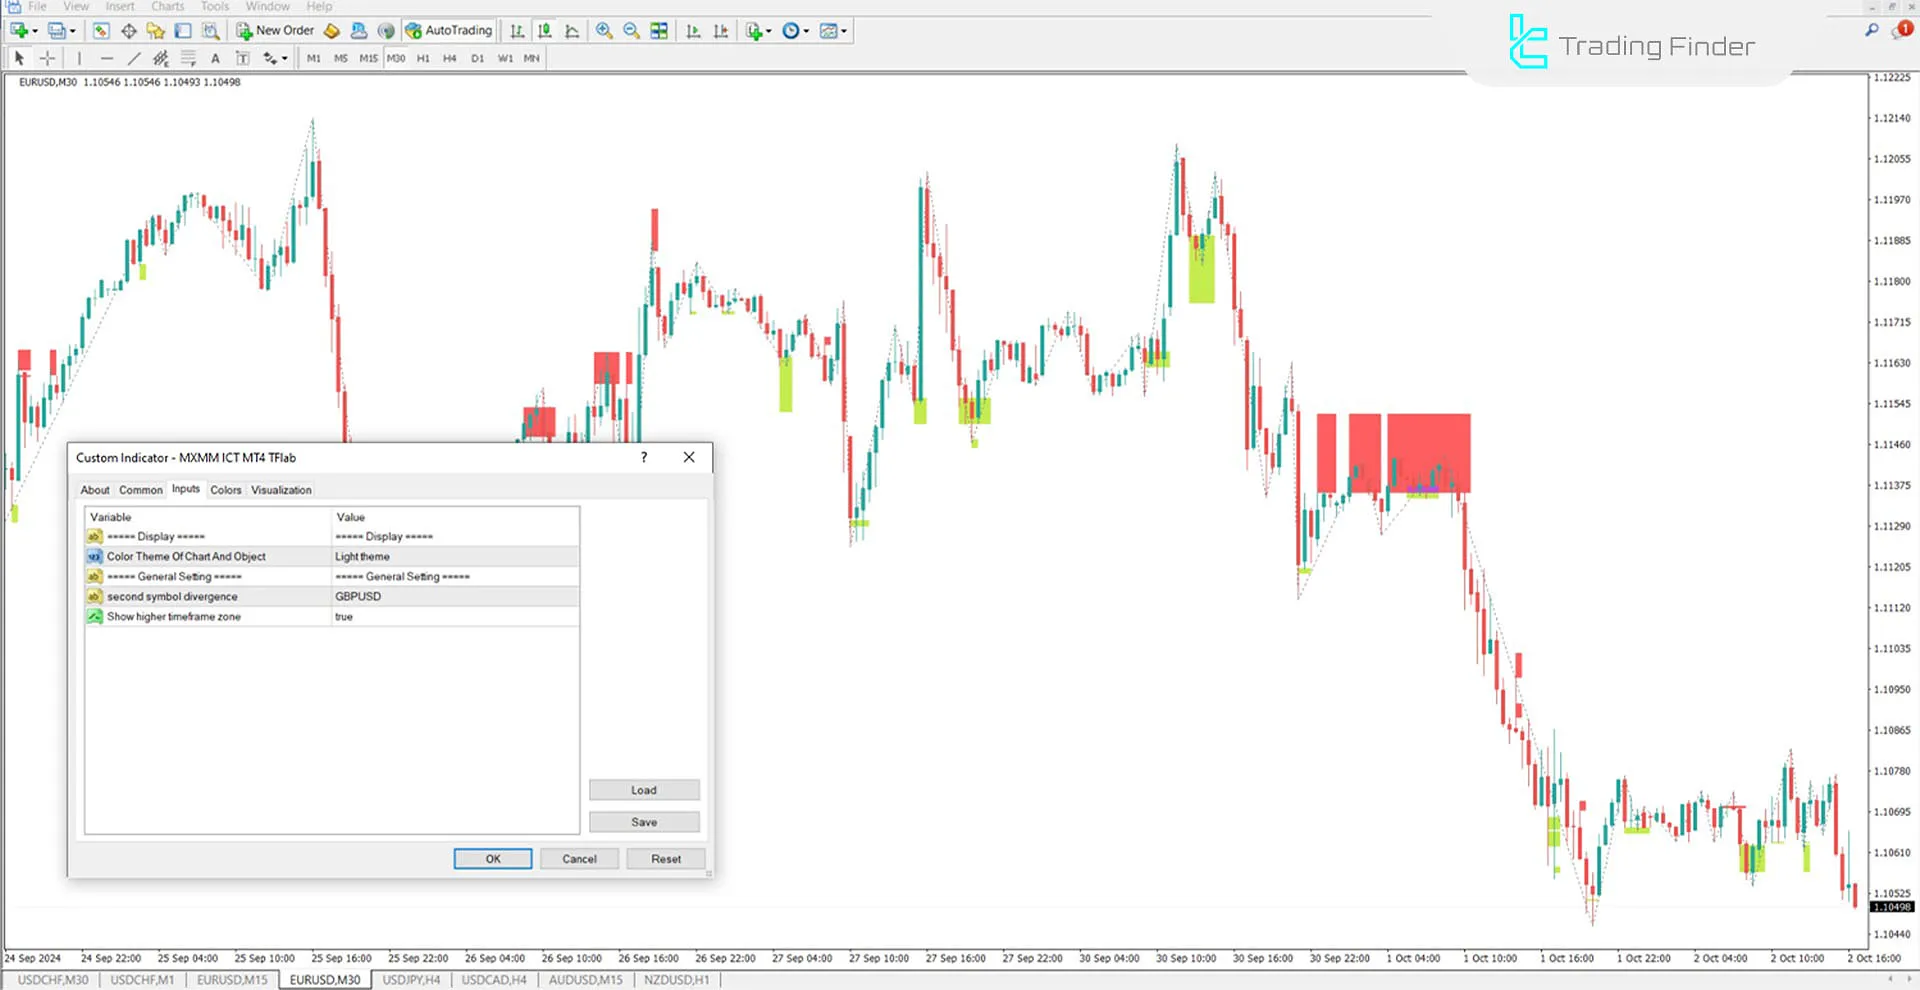
The image below contains the complete details of this indicator’s settings:

- Color Theme of Chart and Objects: Adjusted to light mode;
- Show Higher Timeframe Zone: Displays bullish and bearish FVGs from higher timeframes.
Conclusion
The Market Maker X Model Indicator (MMXM) is a practical tool in the MetaTrader 4 indicators, enabling analysts to identify critical market zones.
By drawing FVG areas and marking price highs and lows, the indicator displays Buy and Sell signals, helping traders predict price trends effectively.
Market Maker X Model MT4 PDF
Market Maker X Model MT4 PDF
Click to download Market Maker X Model MT4 PDFWhat types of price zones does the MMXM Indicator identify?
The indicator identifies FVG zones (Fair Value Gaps) from higher timeframes.
Which trading styles is the MMXM Indicator suitable for?
The MMXM Indicator is designed for ICT, Smart Money, and other liquidity-based trading methods.


