![Multi Timeframe High Low Indicator for MT4 Download – Free – [TFlab]](https://cdn.tradingfinder.com/image/320456/13-95-en-mtf-high-low-mt4-01.webp)
![Multi Timeframe High Low Indicator for MT4 Download – Free – [TFlab] 0](https://cdn.tradingfinder.com/image/320456/13-95-en-mtf-high-low-mt4-01.webp)
![Multi Timeframe High Low Indicator for MT4 Download – Free – [TFlab] 1](https://cdn.tradingfinder.com/image/320470/13-95-en-mtf-high-low-mt4-02.webp)
![Multi Timeframe High Low Indicator for MT4 Download – Free – [TFlab] 2](https://cdn.tradingfinder.com/image/320467/13-95-en-mtf-high-low-mt4-03.webp)
![Multi Timeframe High Low Indicator for MT4 Download – Free – [TFlab] 3](https://cdn.tradingfinder.com/image/320469/13-95-en-mtf-high-low-mt4-04.webp)
The Multi Timeframe High Low Indicator (MTF High Low) plots daily, weekly, and monthly high and low levels directly on the chart.
Based on the levels drawn by this MT4 levels indicator, traders can identify bullish and bearish trends across multiple timeframes. In addition to current levels, the indicator also draws previous highs and lows labeled "Previous."
Specification Table of the MTF High Low Indicator
The table below presents the specifications and features of the MTF High Low Indicator.
Indicator Categories: | Support & Resistance MT4 Indicators Trading Assist MT4 Indicators Levels MT4 Indicators |
Platforms: | MetaTrader 4 Indicators |
Trading Skills: | Elementary |
Indicator Types: | Breakout MT4 Indicators Reversal MT4 Indicators |
Timeframe: | Multi-Timeframe MT4 Indicators |
Trading Style: | Day Trading MT4 Indicators |
Trading Instruments: | Stock Market MT4 Indicators Cryptocurrency MT4 Indicators Forex MT4 Indicators |
Bullish Trend Conditions
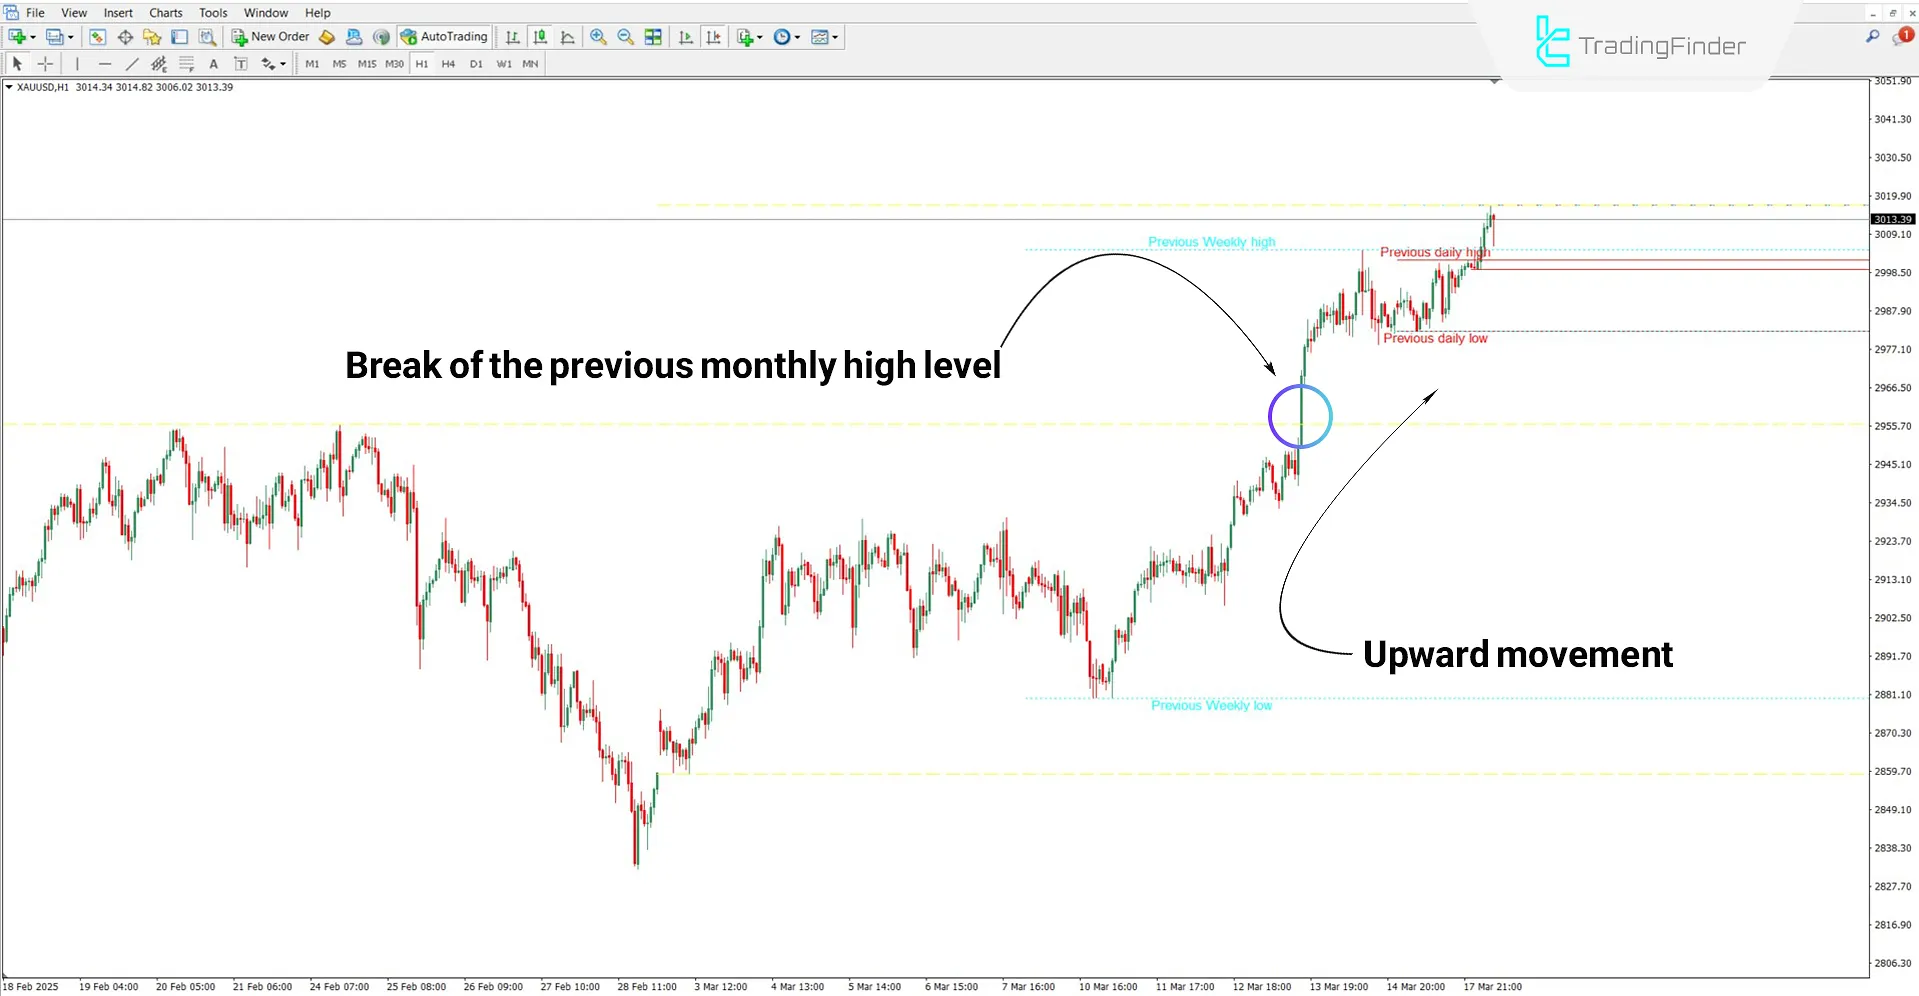
According to the 1-hour chart of XAU/USD, the upward movement started from the previous weekly low. The break of the previous monthly high also confirms the strength of the bullish trend.

Bearish Trend Conditions
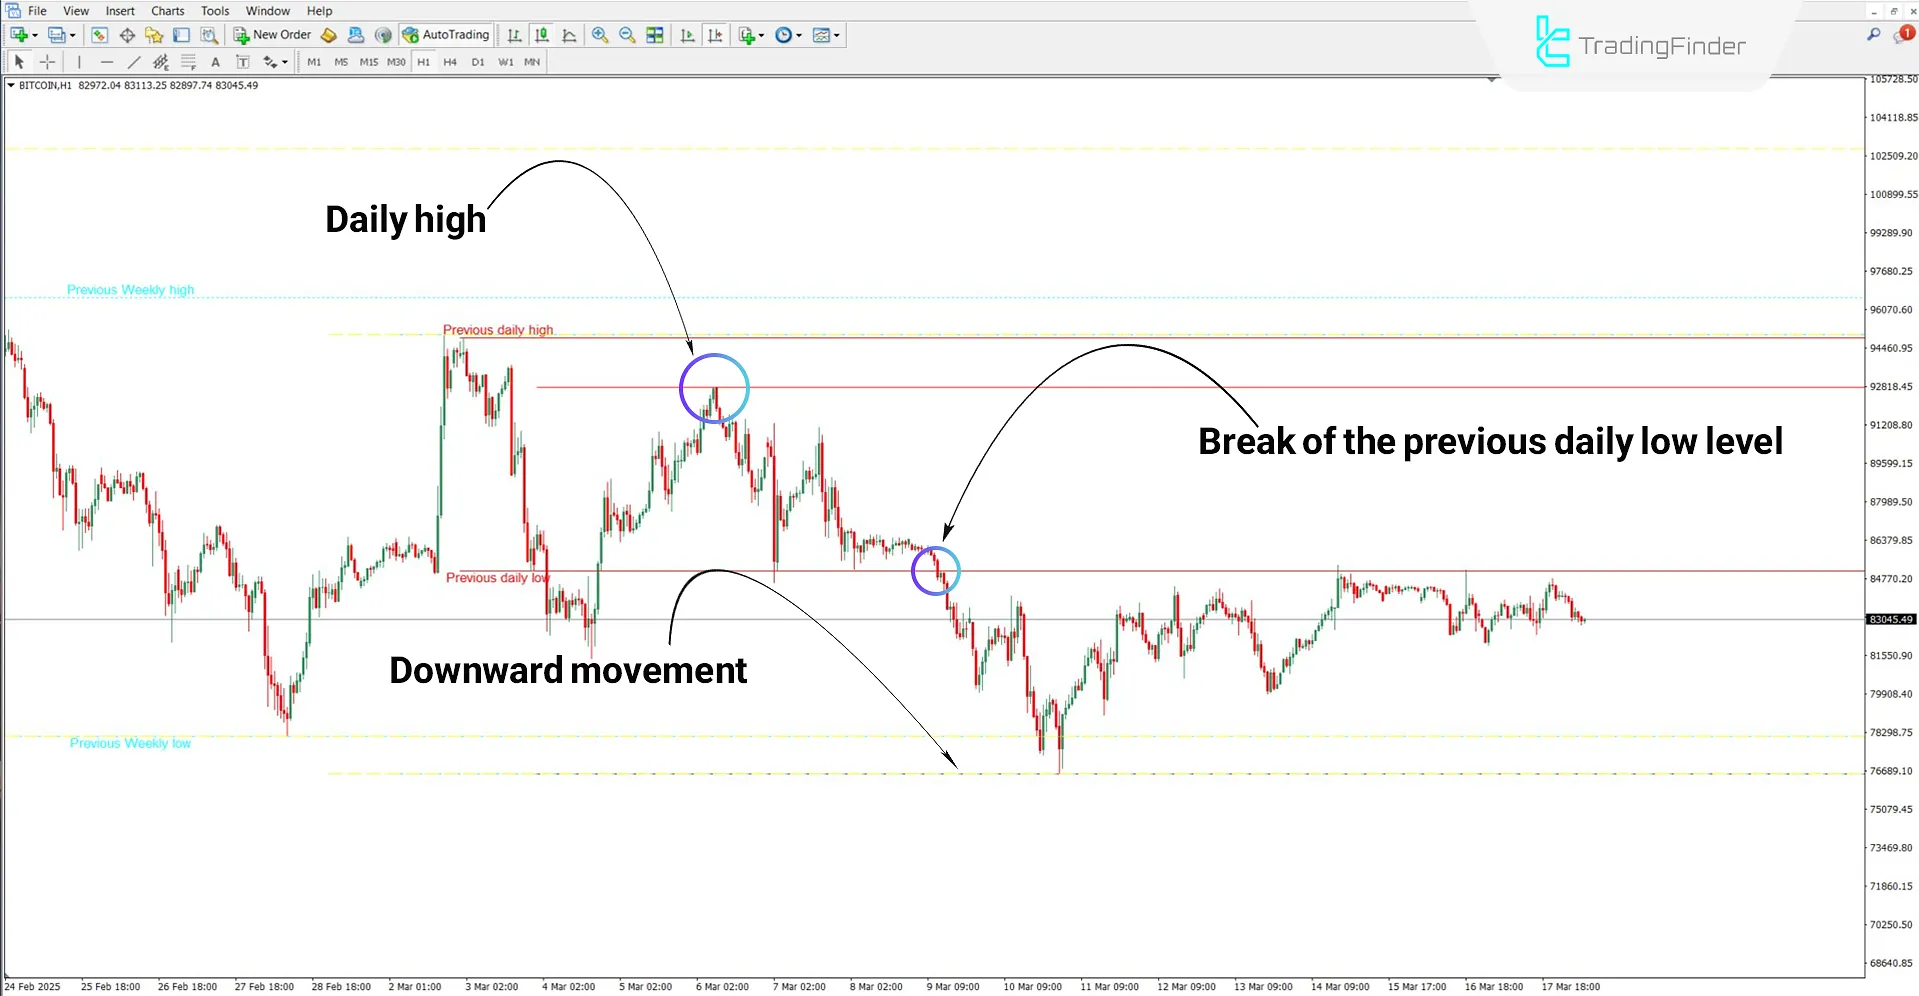
Based on the 1-hour Bitcoin (BTC) chart, the downtrend started from the previous daily high. The trend briefly retraced upward, forming the current daily high, which offers a potential entry opportunity.
Moreover, the break of the previous daily low confirms the strength of the bearish trend.

MTF High Low Indicator Settings
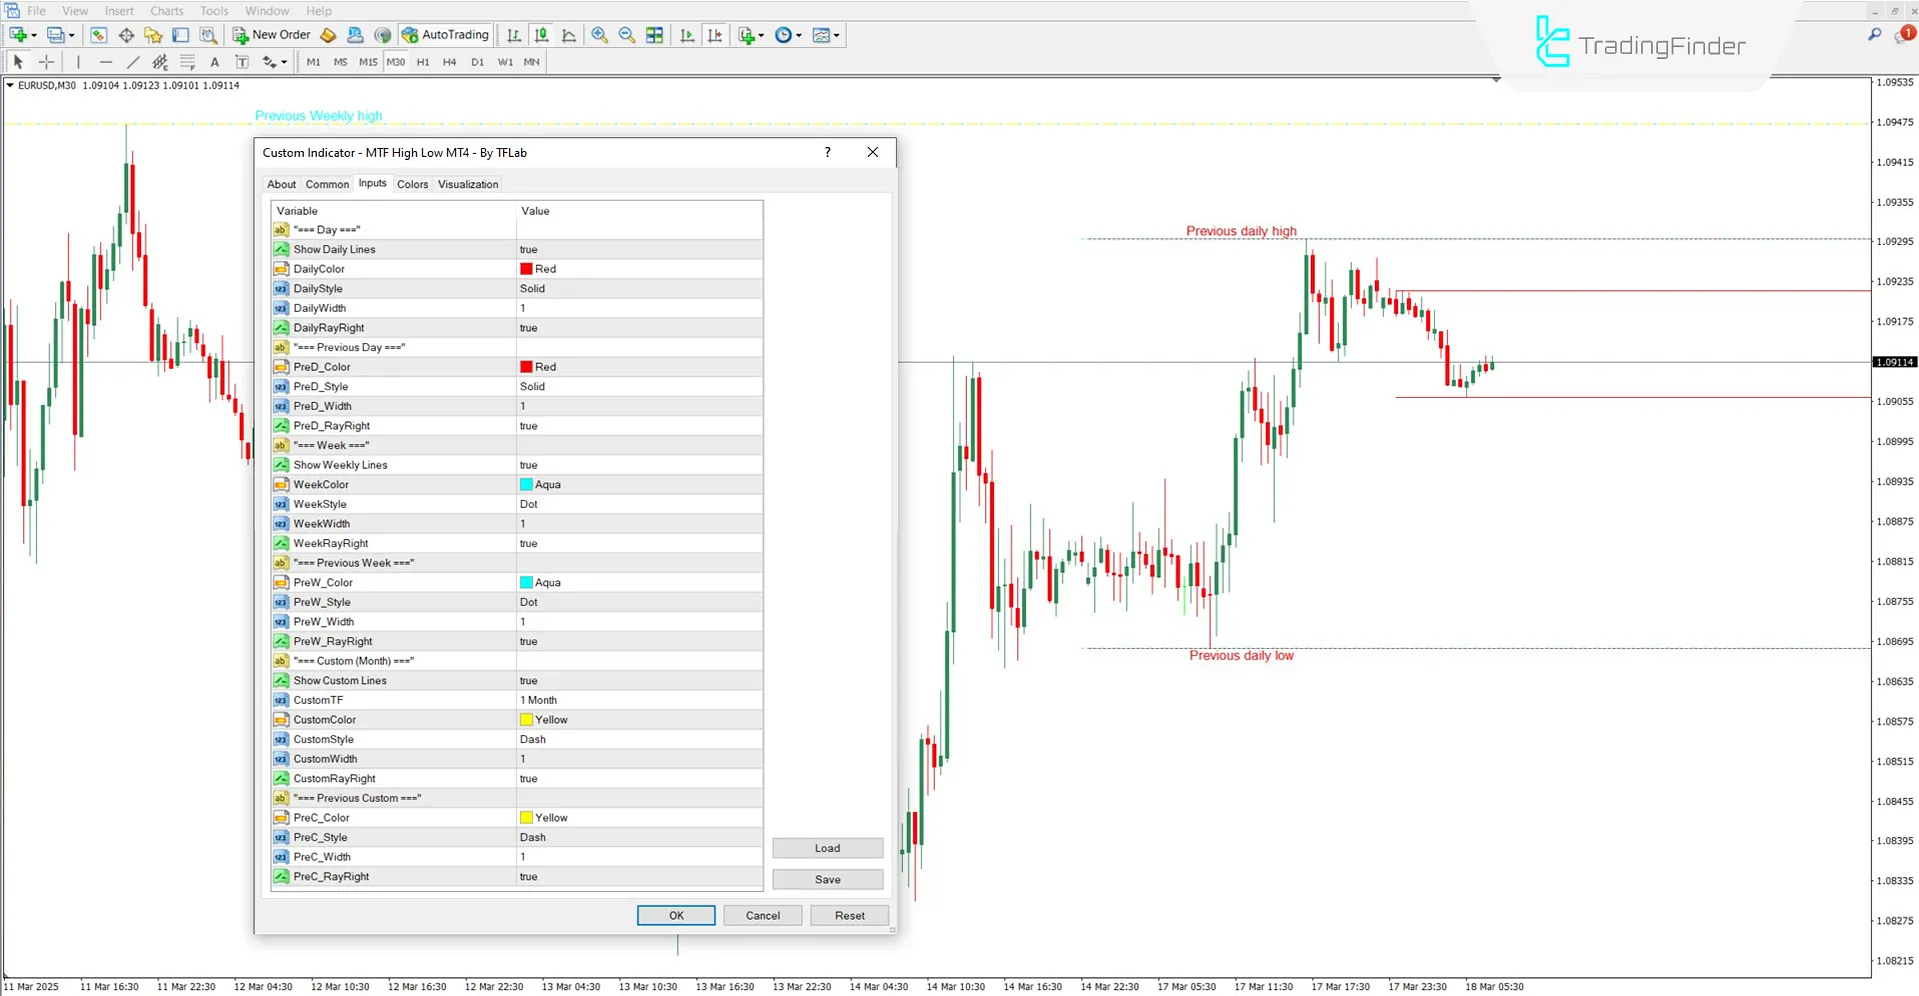
The image below shows the available settings for the MTF High Low Indicator:

- Show Daily Lines: Enable/disable daily high and low lines
- Daily Color: Set the color of daily levels
- Daily Style: Choose line style for daily levels
- Daily Width: Set line thickness
- Daily RayRight: Extend daily lines to the right side of the chart
- PreD_Color: Color of previous daily levels
- PreD_Style: Style of previous daily lines
- PreD_Width: Thickness of previous daily lines
- PreD_RayRight: Extend previous daily lines to the right
- Show Weekly Lines: Enable/disable weekly high and low lines
- Week Color: Set the color of weekly levels
- Week Style: Choose a line style for weekly levels
- Week Width: Set line thickness for weekly levels
- Week RayRight: Extend weekly lines to the right side of the chart
- PreW_Color: Color of previous weekly levels
- PreW_Style: Style of previous weekly lines
- PreW_Width: Thickness of previous weekly lines
- PreW_RayRight: Extend previous weekly lines to the right
- Show Custom Lines: Enable/disable custom timeframe levels
- CustomTF: Define the desired custom timeframe
- Custom Color: Color of custom high and low levels
- Custom Style: Style of custom timeframe lines
- Custom Width: Line thickness for custom timeframe
- Custom RayRight: Extend custom lines to the right
- PreC_Color: Color of previous custom timeframe levels
- PreC_Style: Style of previous custom timeframe lines
- PreC_Width: Thickness of previous custom lines
- PreC_RayRight: Extend previous custom lines to the right
Conclusion
The Multi Timeframe High Low Indicator (MTF High Low) draws daily, weekly, and monthly highs and lows using horizontal colored lines. With this trading assist, traders can analyze price range zones more effectively.
Additionally, the indicator offers full customization for timeframe selection, color, and line style within the settings panel.
Multi Timeframe High Low MT4 PDF
Multi Timeframe High Low MT4 PDF
Click to download Multi Timeframe High Low MT4 PDFDoes the MTF High Low Indicator generate trading signals?
No, this indicator does not generate trading signals
Can the timeframe for level creation be changed?
The daily and weekly levels are fixed by default and cannot be changed. However, the "CustomTF" option allows users to define a custom timeframe for plotting levels.


