


![Multi Meter Indicator (MMI) for Meta Trader 4 Download - Free - [Trading Finder]](https://cdn.tradingfinder.com/image/107383/11-3-en-multi-meter-mt4.webp)
![Multi Meter Indicator (MMI) for Meta Trader 4 Download - Free - [Trading Finder] 1](https://cdn.tradingfinder.com/image/29069/11-03-en-multui-meter-mt4-02.avif)
![Multi Meter Indicator (MMI) for Meta Trader 4 Download - Free - [Trading Finder] 2](https://cdn.tradingfinder.com/image/29073/11-03-en-multui-meter-mt4-03.avif)
![Multi Meter Indicator (MMI) for Meta Trader 4 Download - Free - [Trading Finder] 3](https://cdn.tradingfinder.com/image/29080/11-03-en-multui-meter-mt4-04.avif)
The Multi Meter Indicator (MMI) provided on MetaTrader 4 (MT4) is an optimized graphical indicator that displays nine different volatility indicators for more accessible analysis, such as the Moving Average with a 14-period in the top right corner.
Traders can analyze and assess the buyers' and sellers' strengths on the chart using data from the MMI indicator.
Indicator table (MMI)
Indicator Categories: | Signal & Forecast MT4 Indicators Volatility MT4 Indicators Currency Strength MT4 Indicators Trading Assist MT4 Indicators |
Platforms: | MetaTrader 4 Indicators |
Trading Skills: | Intermediate |
Indicator Types: | Leading MT4 Indicators |
Timeframe: | M15-M30 Time MT4 Indicators H4-H1 Time MT4 Indicators |
Trading Style: | Day Trading MT4 Indicators Intraday MT4 Indicators Scalper MT4 Indicators |
Trading Instruments: | Share Stocks MT4 Indicators Stock Market MT4 Indicators Cryptocurrency MT4 Indicators Forex MT4 Indicators |
Using the MMI Indicator
 1-hour chart of GBP/CHF (British Pound/Swiss Franc)
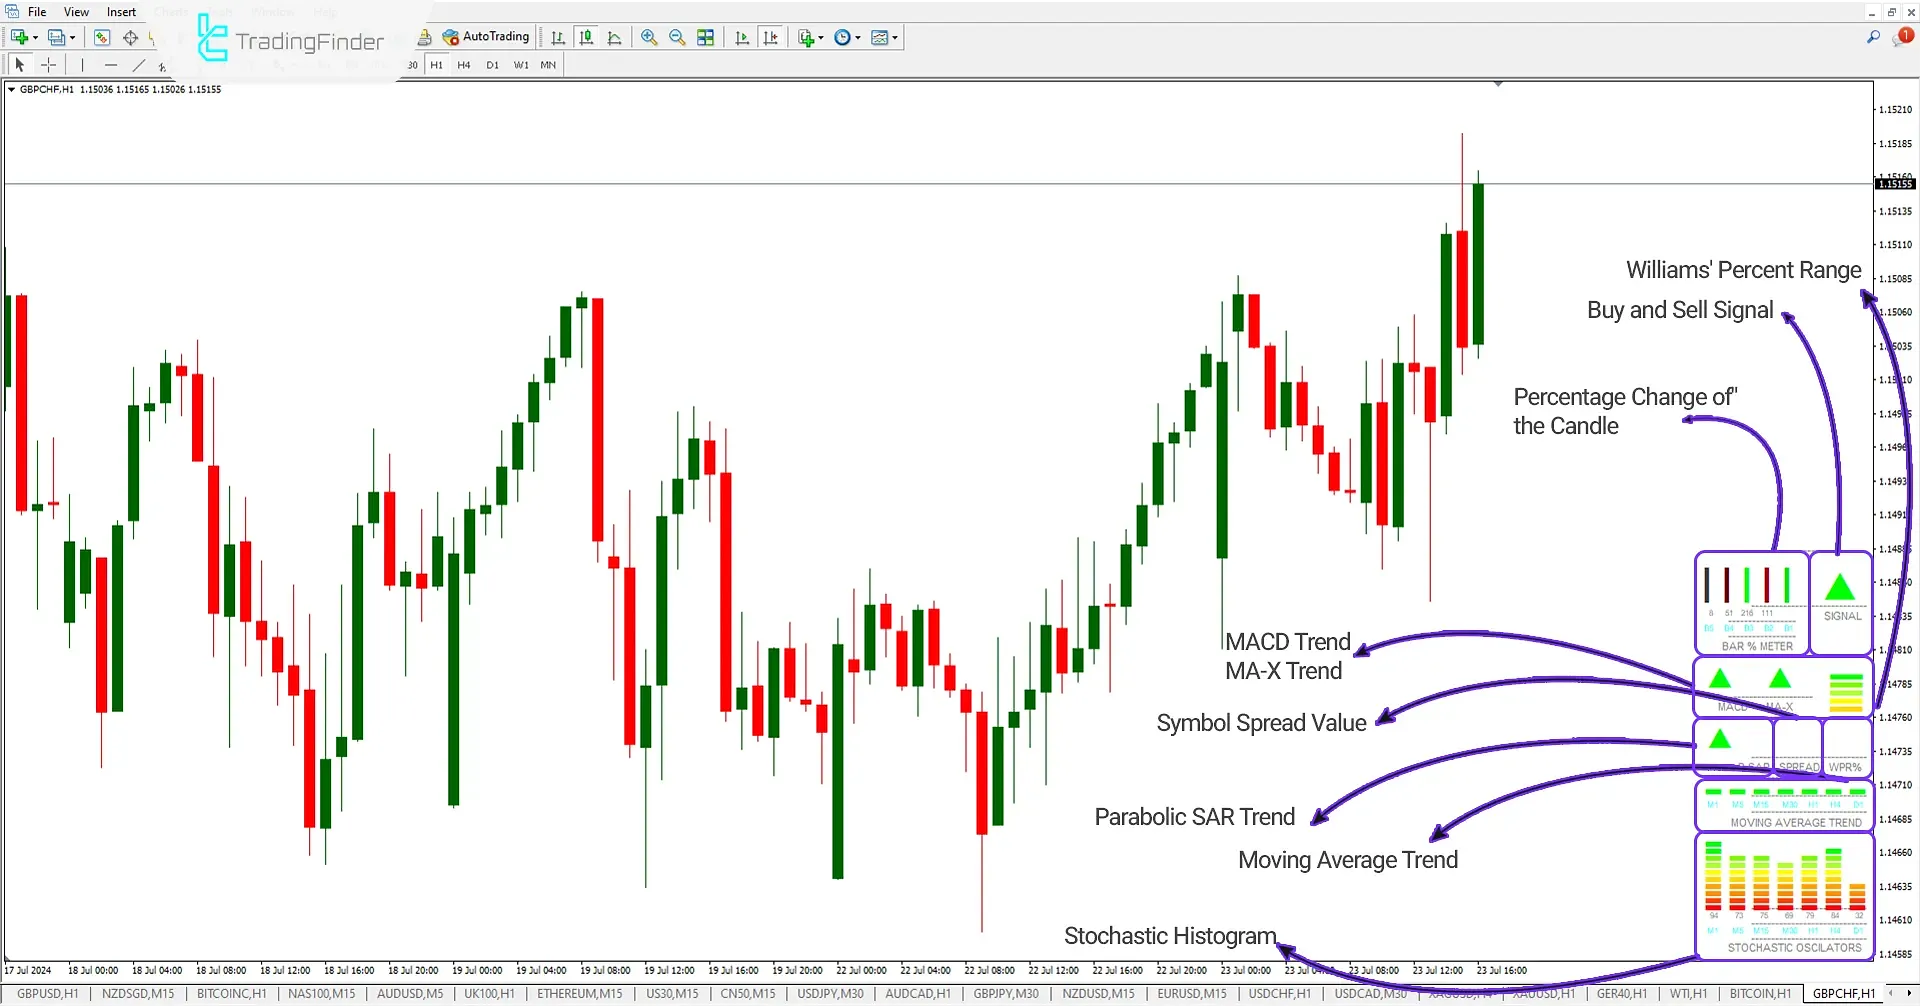
In the 1-hour (GBP/CHF) chart, the MMI indicator simplifies market analysis for traders by combining nine different indicators. This comprehensive trading tool allows traders to quickly use this set of indicators for more precise analysis and better decision-making.
- Williams' Percent Range (WPR%) Range: Displays the Williams' Percent Range (WPR%) level as a histogram;
- Buy and Sell Signal (Signal): This function generates buy signals (green arrow pointing up) or sell signals (red arrow pointing down) based on all available indicators;
- Bar Chart Meter: This shows the percentage increase or decrease of the current price relative to the previous four bars;
- MACD: Indicates the direction of the MACD signal crossing on the current chart;
- Moving Average X (MA-X): Shows the crossing direction of the weighted linear moving average and the simple moving average;
- Parabolic SAR (Parabolic SAR): Indicates the direction of the Parabolic SAR indicator;
- Spread (Spread): Displays the difference between BID and ASK prices;
- Moving Average Trend (Moving Average Trend): Shows the trend direction of the moving average;
- Stochastic Oscillator Histogram (Stochastic Oscillator): Displays the stochastic indicator value as a histogram.
Buy Signal of the MMI Indicator
 1-hour chart of USD/CAD (U.S. Dollar/Canadian Dollar)
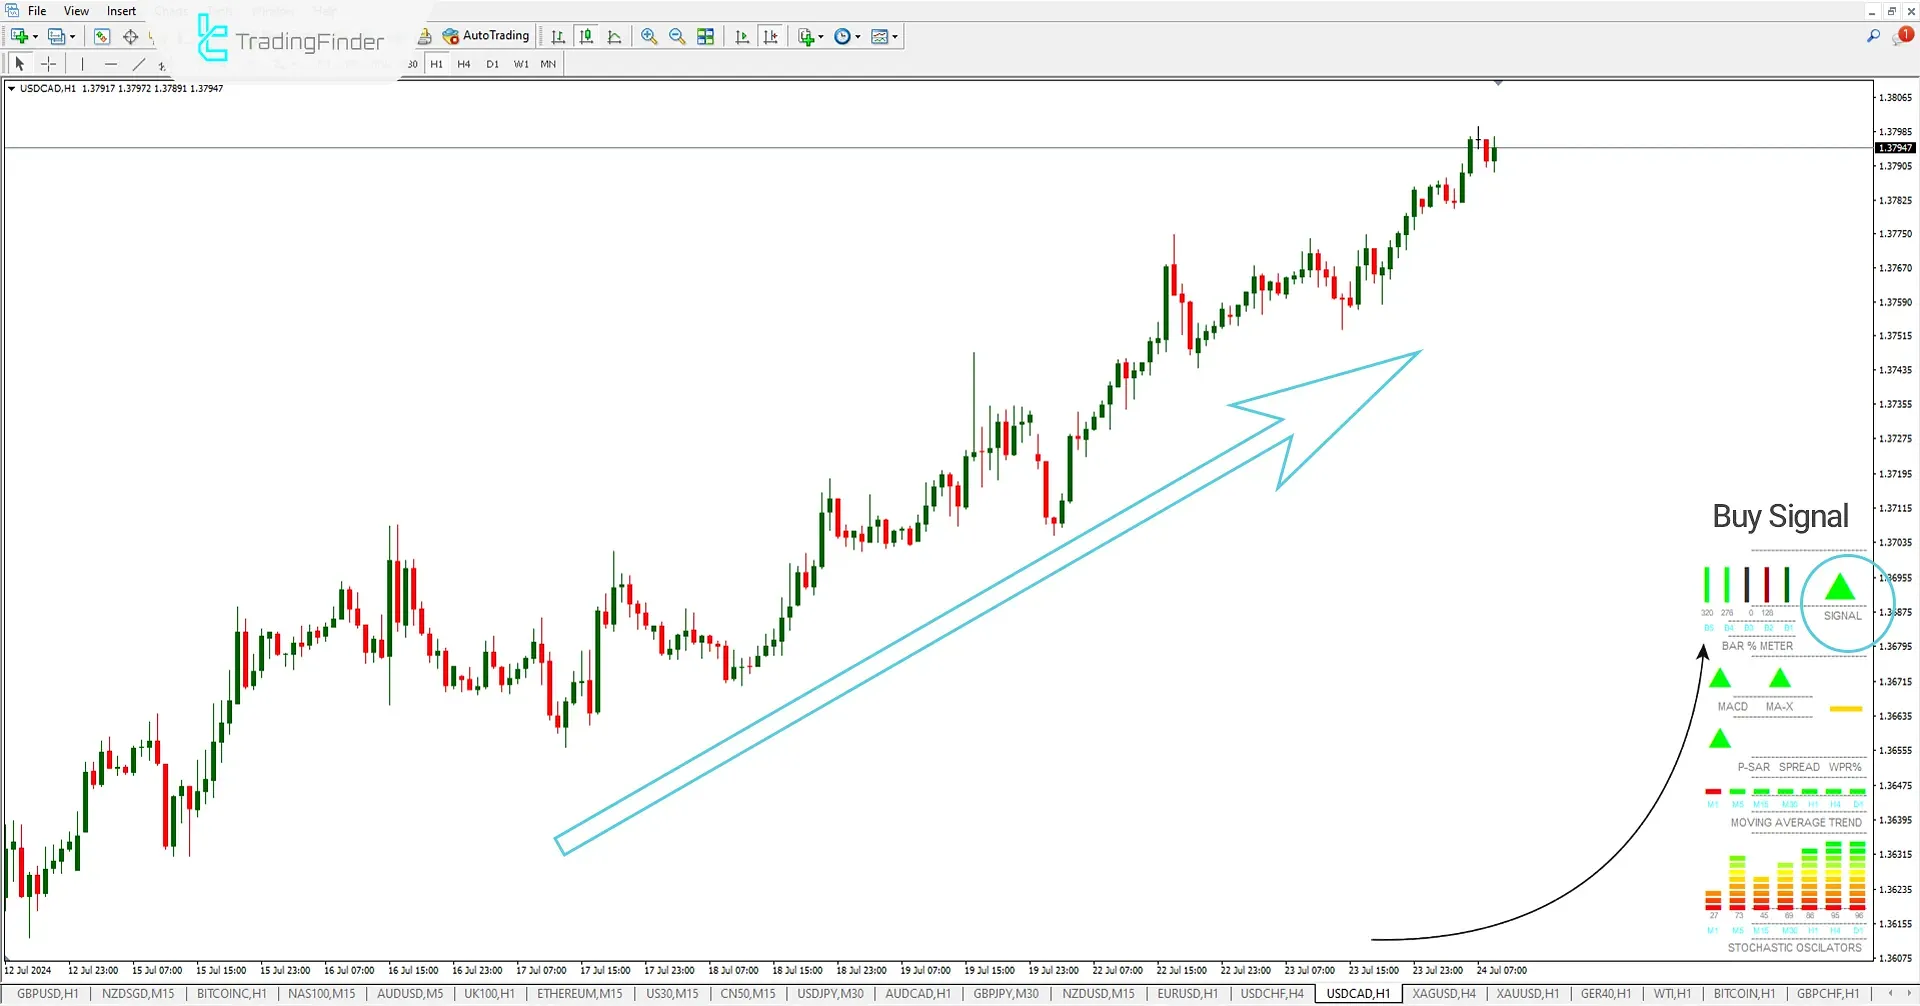
In the USD/CAD pair's one-hour chart, the MMI indicator has issued a buy signal based on the analysis of the available indicators. Upon seeing this signal, the trader can enter a buy trade.
Sell Signal of the MMI Indicator
 Daily chart of NZD/USD (New Zealand Dollar/U.S. Dollar)
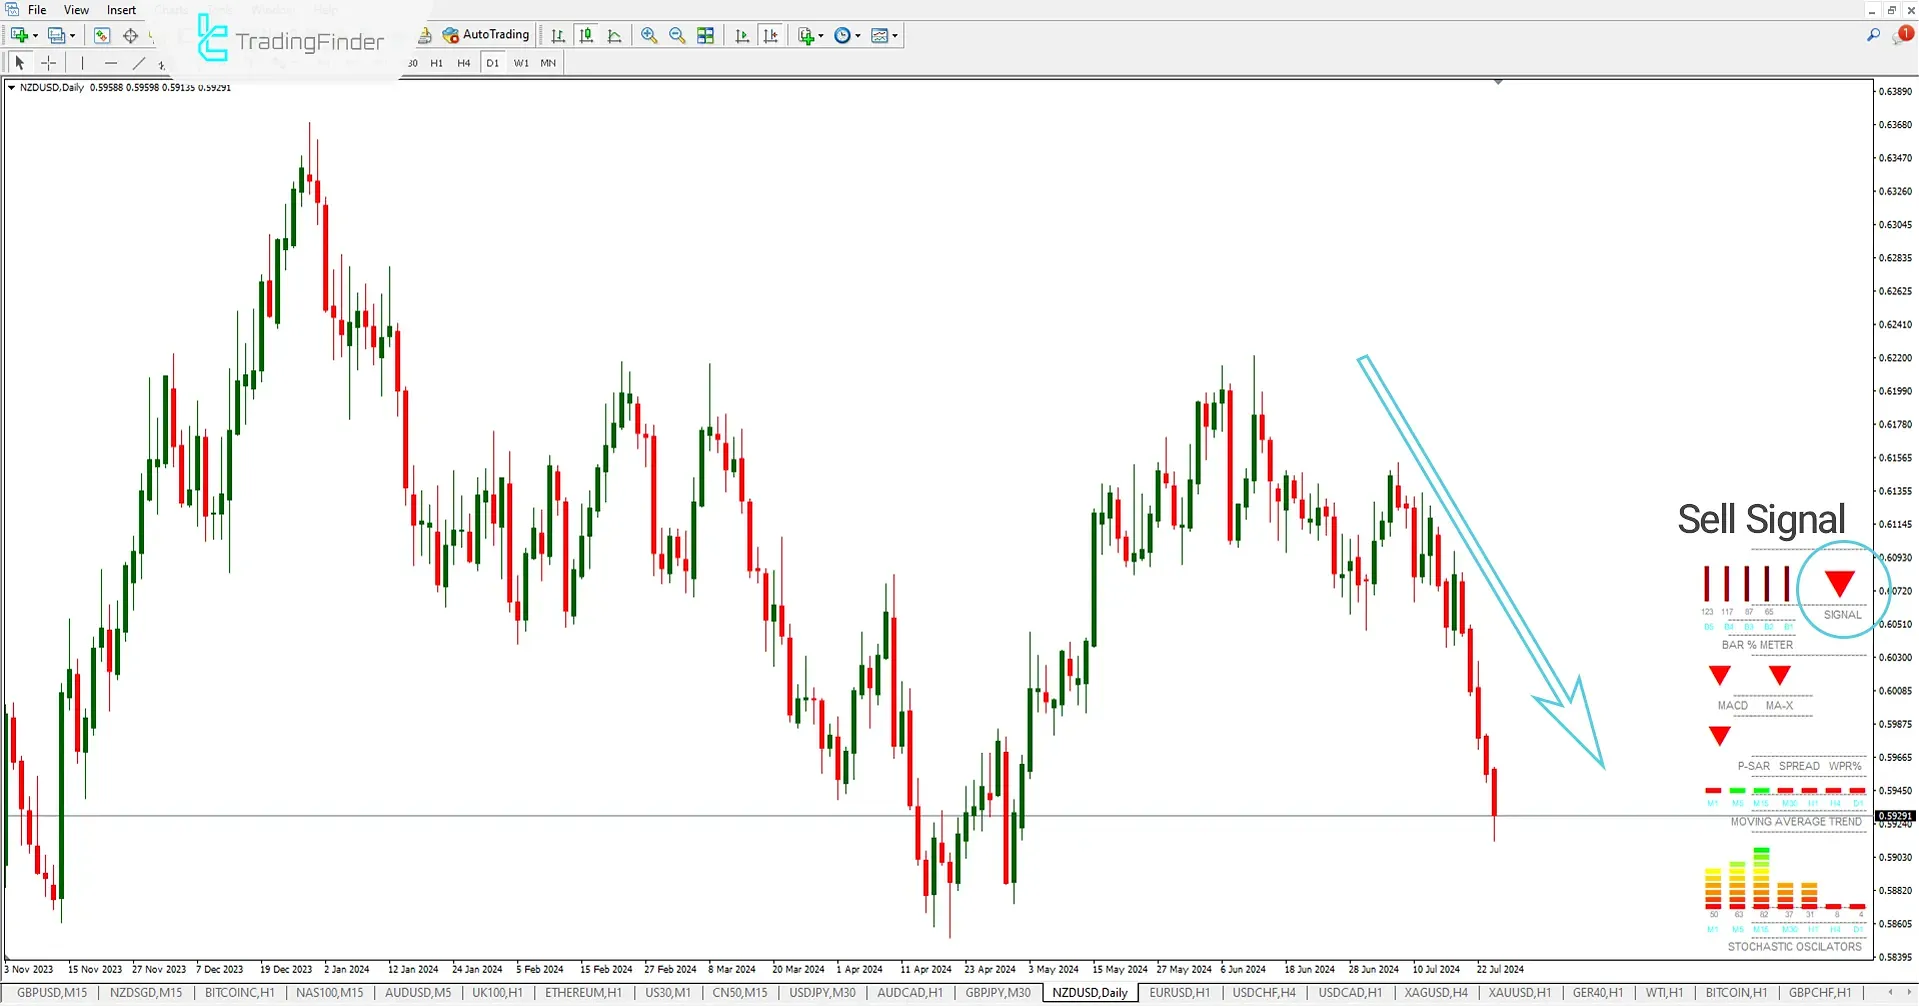
In the 1-hour NZD/USD pair chart, the MMI indicator has issued a sell signal based on the analysis of the available indicators. Upon seeing this signal, the trader can enter a sell trade.
Indicator Setting
 4-Hour Chart of Silver (XAG/USD)
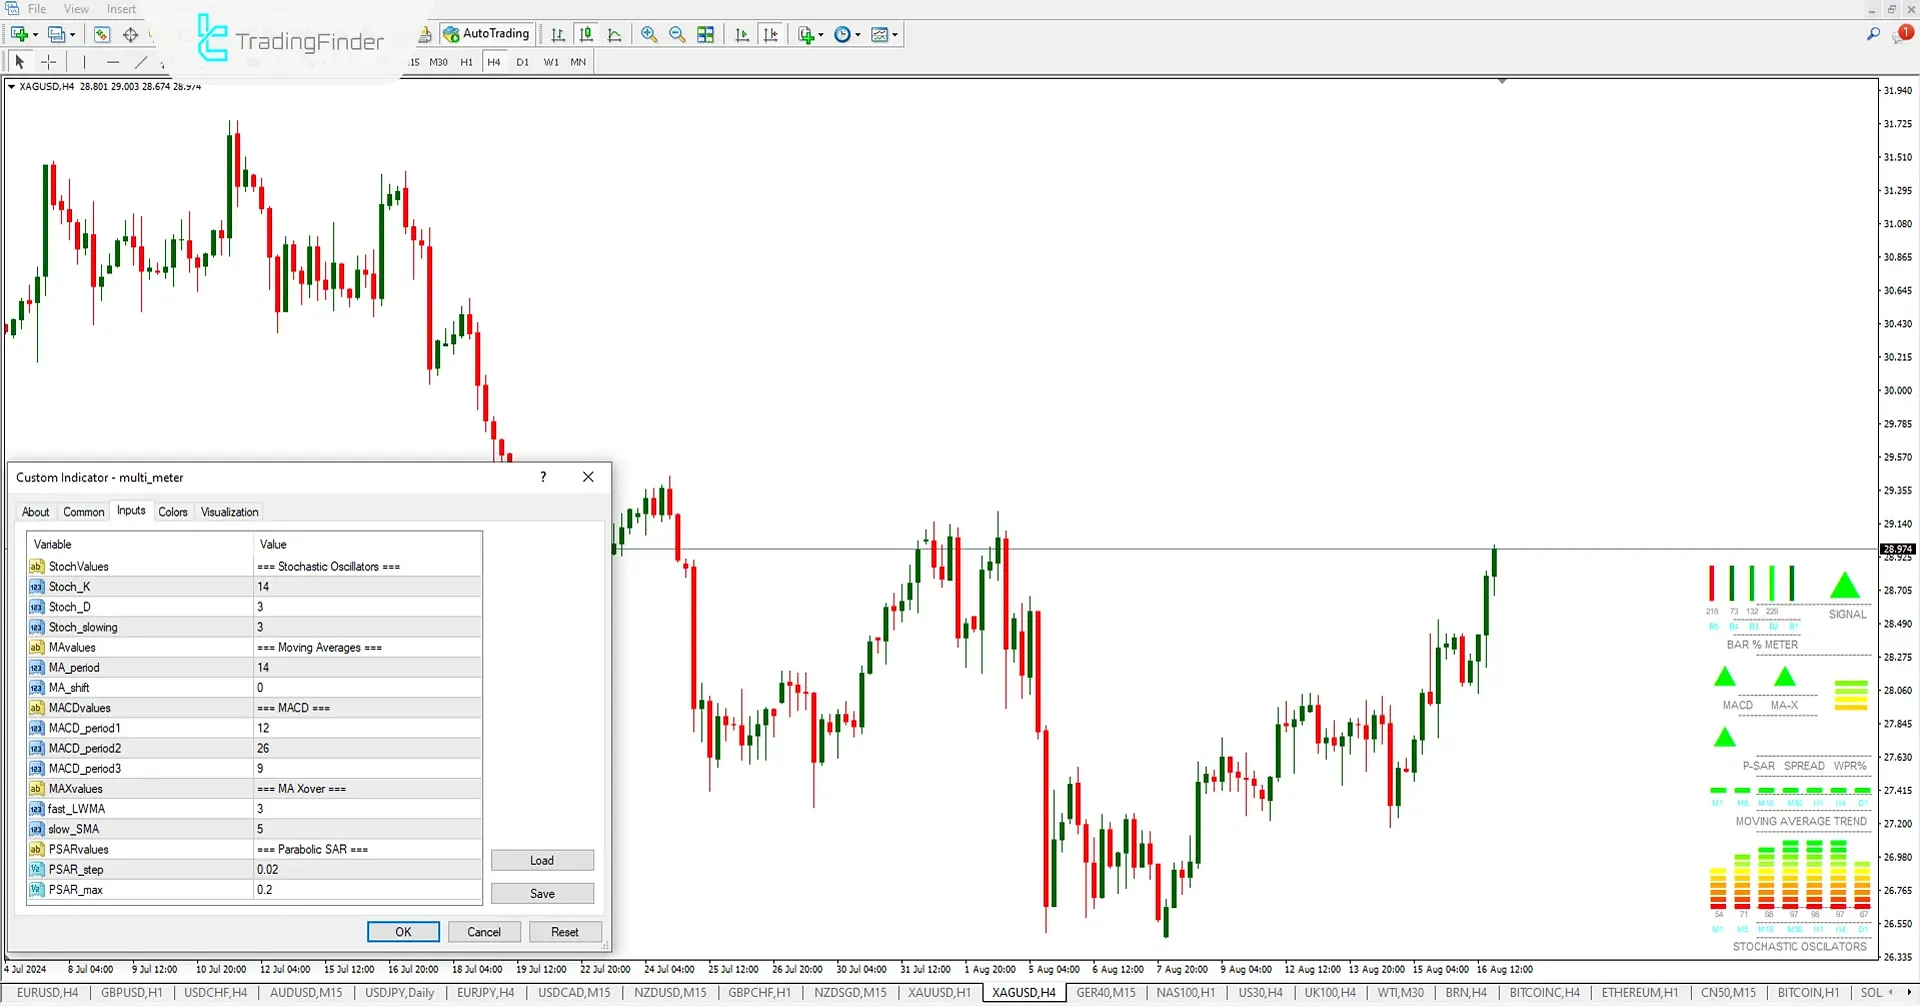
- StockValues: Stochastic Oscillator Indicator;
- Stock_K: Setting for the K value of the Stochastic Oscillator;
- Stock_D: Setting for the D value of the Stochastic Oscillator;
- Stoch_Slowing: Setting for the Slowing value of the Stochastic Oscillator;
- MA_Values: Moving Average Indicator;
- MA_Period: Period of the Moving Average;
- MA_Shift: Shifts the Moving Average by several bars;
- MACD_Values: Moving Average Convergence Divergence Indicator;
- MACD_Period1: Period for MACD FAST MA;
- MACD_Period2: Period for MACD SLOW MA;
- MACD_Period3: Period for MACD Signal;
- MAXVALUES: Weighted Linear Moving Average and Simple Moving Average Indicator;
- FastLWMA: Period for the Weighted Linear Moving Average used in the MA-X indicator;
- SlowSMA: Period for the Simple Moving Average used in the MA-X indicator;
- PSARValues: Parabolic Stop And Reverse (PSAR) Indicator;
- PSAR_STEP: Step value for the Parabolic SAR;
- PSAR_MAX: Maximum value for the Parabolic SAR.
Summary
The Multi Meter Indicator (MMI) is a versatile tool that consolidates nine Metatrader4 indicators into one for more straightforward analysis.
Instead of cluttering the chart, the MMI presents various data in the top right corner, making it accessible for traders.
Multi Meter MMI MT4 PDF
Multi Meter MMI MT4 PDF
Click to download Multi Meter MMI MT4 PDFDoes the MMI indicator provide buy and sell signals?
Yes. Based on the available indicators, a green arrow indicates a buy signal in bullish trends, while a red arrow signals a sell in bearish trends. No signals are issued in ranging or low-volatility markets.
Is the MMI indicator available only on MetaTrader 4?
No. This indicator is available on both MetaTrader 4 and MetaTrader 5 platforms. The MetaTrader 5 version can be easily downloaded from the top of the page.


