![Murrey Math (MM) Indicator in MetaTrader 4 Download - Free - [Trading Finder]](https://cdn.tradingfinder.com/image/106481/11-17-en-murrey-math-indicator-mt4-01.webp)
![Murrey Math (MM) Indicator in MetaTrader 4 Download - Free - [Trading Finder] 0](https://cdn.tradingfinder.com/image/106481/11-17-en-murrey-math-indicator-mt4-01.webp)
![Murrey Math (MM) Indicator in MetaTrader 4 Download - Free - [Trading Finder] 1](https://cdn.tradingfinder.com/image/106484/11-17-en-murrey-math-indicator-mt4-04.webp)
![Murrey Math (MM) Indicator in MetaTrader 4 Download - Free - [Trading Finder] 2](https://cdn.tradingfinder.com/image/106480/11-17-en-murrey-math-indicator-mt4-02.webp)
![Murrey Math (MM) Indicator in MetaTrader 4 Download - Free - [Trading Finder] 3](https://cdn.tradingfinder.com/image/106485/11-17-en-murrey-math-indicator-mt4-03.webp)
The Murrey Math (MM) Indicator consists of six different colors, each with its meaning and application, displayed as support and resistance indicator on the Meta Trader 4 (MT4) chart. The MM Indicator includes a blue pivot line as the main price axis.6 lines are above, and 6 lines are below the pivot line.
If the price is above the pivot line, it signals an uptrend; if it is below the pivot line, it signals a downtrend.
MM Indicator Table
Indicator Categories: | Pivot Points & Fractals MT4 Indicators Support & Resistance MT4 Indicators Levels MT4 Indicators |
Platforms: | MetaTrader 4 Indicators |
Trading Skills: | Elementary |
Indicator Types: | Range MT4 Indicators Leading MT4 Indicators Reversal MT4 Indicators |
Timeframe: | Daily & Weekly Timeframe MT4 Indicators M15-M30 Time MT4 Indicators H4-H1 Time MT4 Indicators |
Trading Style: | Day Trading MT4 Indicators Scalper MT4 Indicators |
Trading Instruments: | Indices Market MT4 Indicators Cryptocurrency MT4 Indicators Forex MT4 Indicators |
Indicator at a Glance
The Murray Math Indicator is a unique tool for identifying support and resistance levels and predicting potential levels where the price may react.
This level indicator draws a pivot line to determine the direction of the price trend; if the price is above the pivot level, an uptrend is expected, while a downtrend is anticipated if the price is below the pivot level in Technical analysis.
Additionally, the indicator plots six levels above and six below the pivot line, which can be used as support and resistance levels.
Role of Support in the MM Indicator
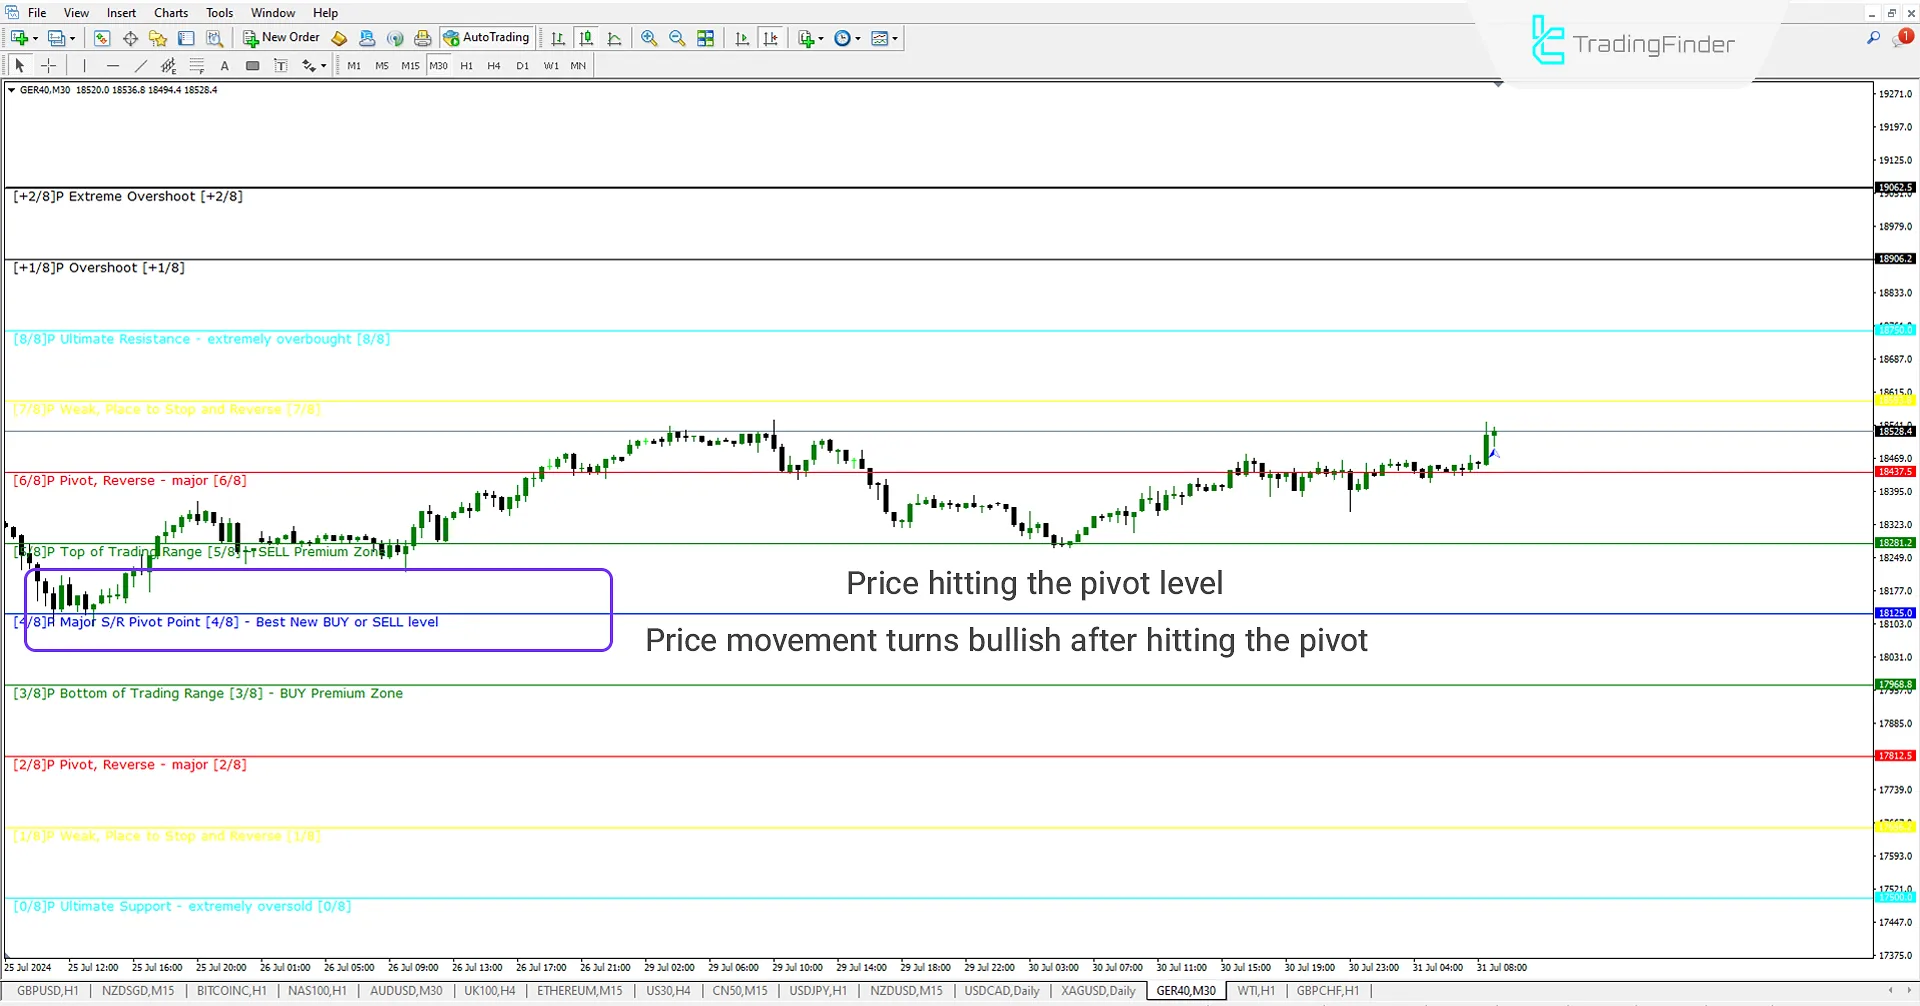
In the 30-minute GER40 index chart, the price hits the pivot line of the MM Indicator at 18125.0 after a downward movement. This pivot level, one of the key price levels, acts effectively as support, changing the downward trend to upward.

Role of Resistance in the MM Indicator
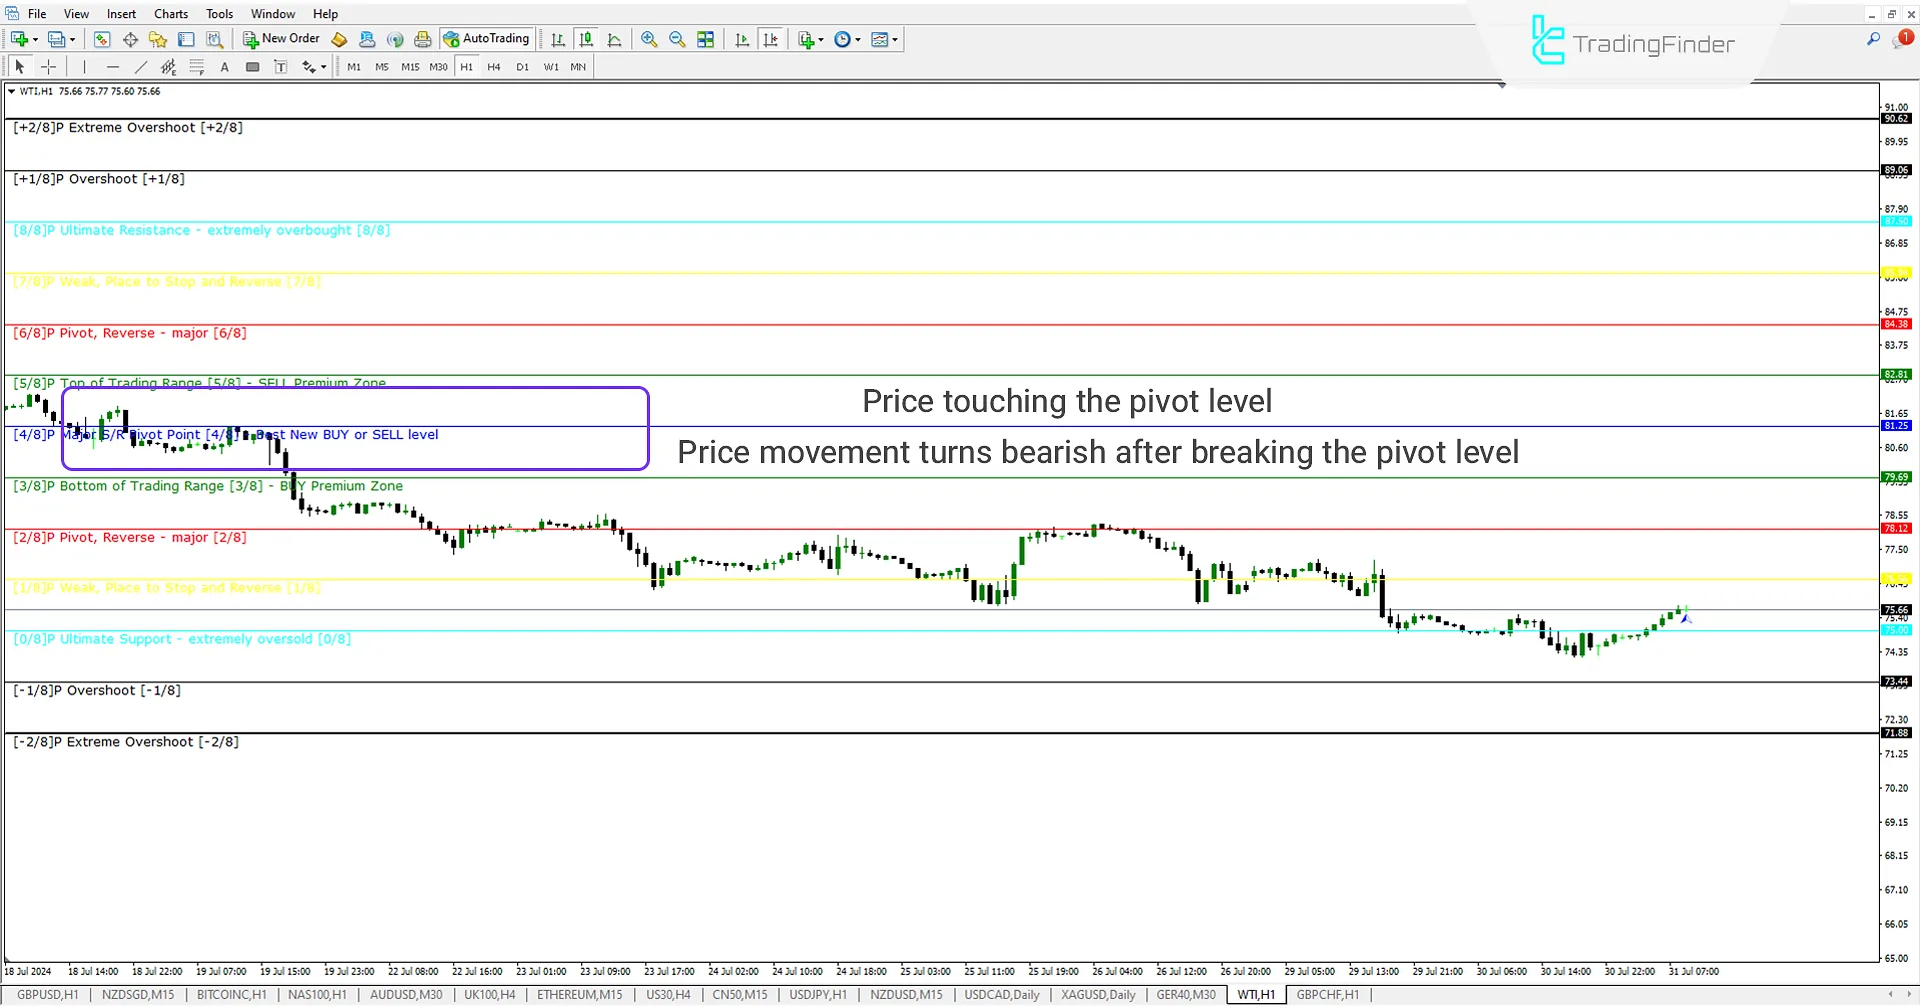
In the 1-hour chart of WTI, after breaking below the pivot level of 81.25, the price moves below the pivot line. Following a range period, it starts its downtrend towards the price levels of the MM Indicator.

MM Indicator Settings

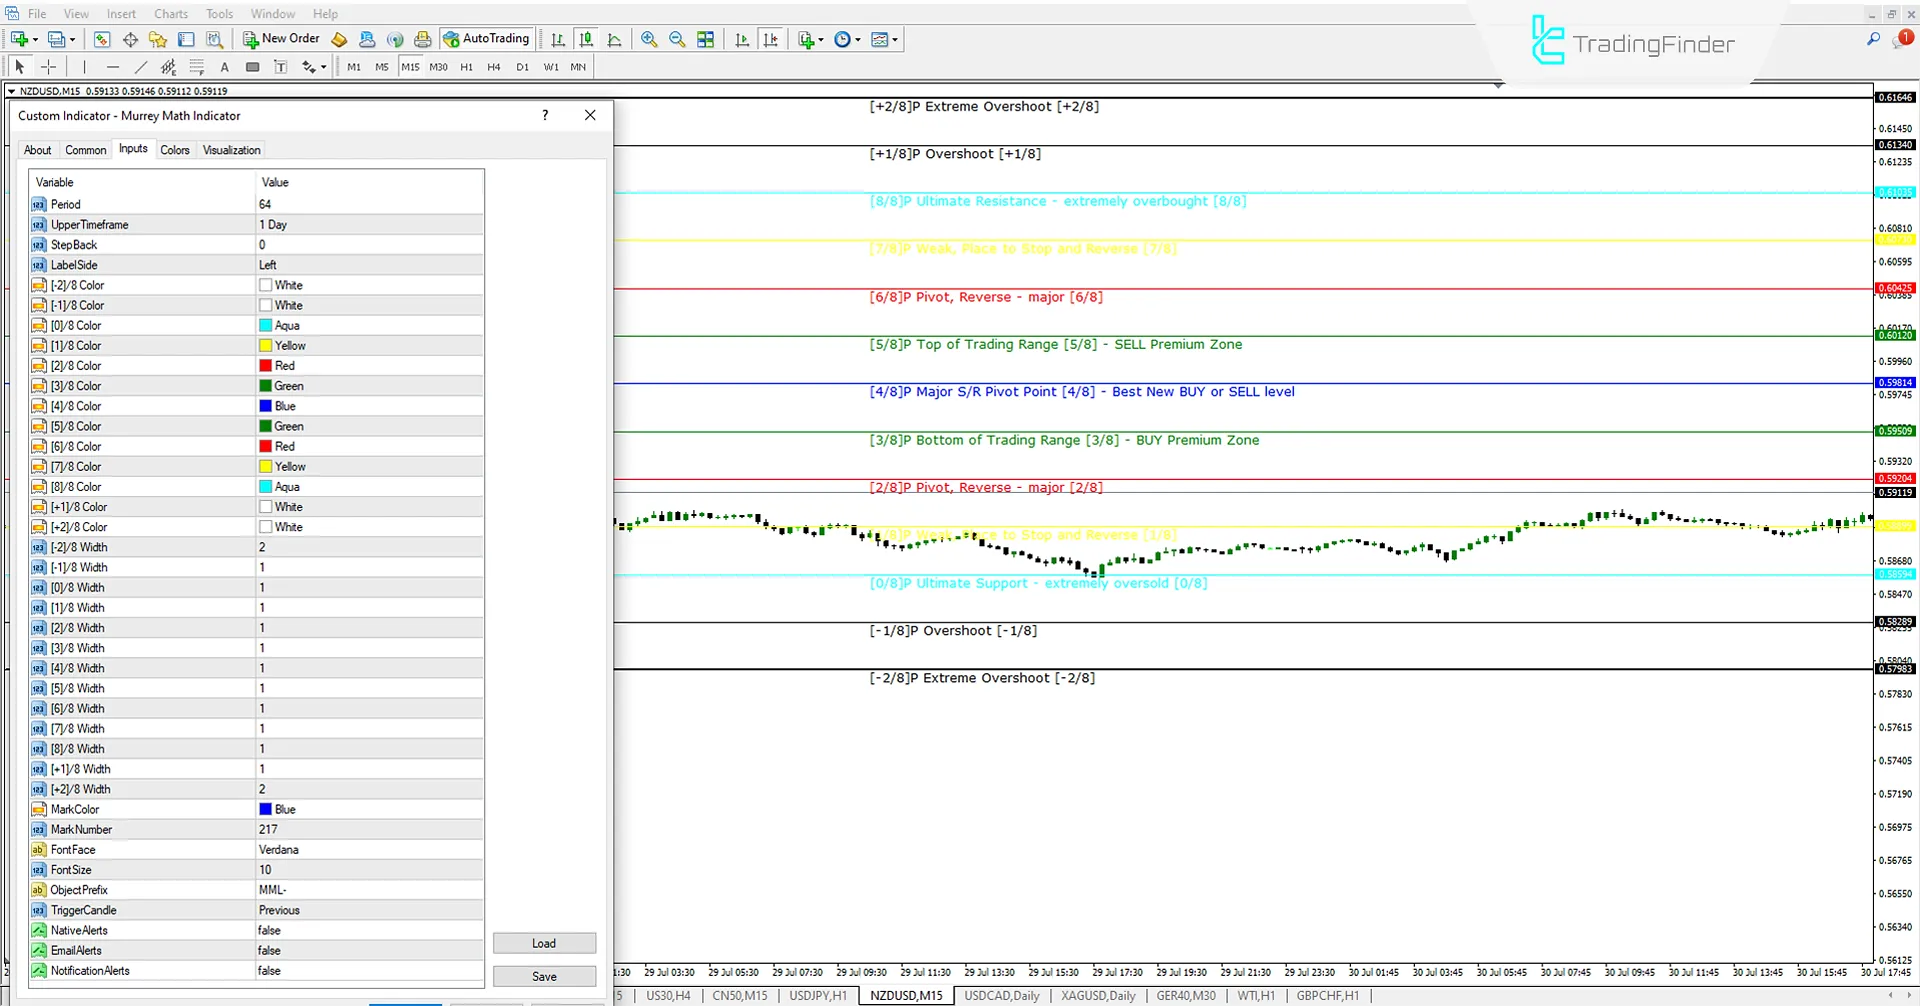
- Period: Period settings;
- Upper Timeframe: Timeframe settings;
- Step Back: Calculation settings based on which candle in the past;
- Label Side: Position settings for labels;
- Color Settings: Color adjustments [from -2 to +2];
- Width: Width settings [from -2 to +2];
- Mark Color: Set marker color;
- Mark Number: Set marker shape (based on indicator codes in MQL);
- Font Face: Set font type;
- Font Size: Set font size;
- Object Prefix: Prefix;
- Trigger Candle: Calculation type settings (based on current price - previous candle price);
- Native Alerts: Set price alert as a popup;
- Email Alerts: Set price alerts via email;
- Notification Alerts: Set price alert as a mobile notification.
Conclusion
The Murrey Math (MM) Indicator draws various price levels to identify support and resistance zones. It also defines the price range and shows traders the market trend.
Murrey Math MM MT4 PDF
Murrey Math MM MT4 PDF
Click to download Murrey Math MM MT4 PDFWhat is the Murrey Math (MM) Indicator?
The Murrey Math (MM) Indicator uses horizontal lines to calculate and display support and resistance levels based on prices. These levels help traders identify potential price reversal or breakout points.
What are the benefits of using the Murrey Math (MM) Indicator?
Identifying price reversal and breakout points helps traders spot potential price reversals or breakouts. This indicator's simplicity and ease of use, based on the defined levels, make it simple for traders to use.


