![Navarro 200 Harmonic Pattern Indicator MT4 Download - Free - [TFlab]](https://cdn.tradingfinder.com/image/363901/13-118-en-navarro-200-harmonic-pattern-mt4-01.webp)
![Navarro 200 Harmonic Pattern Indicator MT4 Download - Free - [TFlab] 0](https://cdn.tradingfinder.com/image/363901/13-118-en-navarro-200-harmonic-pattern-mt4-01.webp)
![Navarro 200 Harmonic Pattern Indicator MT4 Download - Free - [TFlab] 1](https://cdn.tradingfinder.com/image/363899/13-118-en-navarro-200-harmonic-pattern-mt4-02.webp)
![Navarro 200 Harmonic Pattern Indicator MT4 Download - Free - [TFlab] 2](https://cdn.tradingfinder.com/image/363898/13-118-en-navarro-200-harmonic-pattern-mt4-03.webp)
![Navarro 200 Harmonic Pattern Indicator MT4 Download - Free - [TFlab] 3](https://cdn.tradingfinder.com/image/363900/13-118-en-navarro-200-harmonic-pattern-mt4-04.webp)
On July 2, 2025, in version 2, alert/notification and signal functionality was added to this indicator
The Navarro 200 Harmonic Pattern Indicator identifies five-point XABCD patterns, where Fibonacci ratios are analyzed between various legs such as (CD, BC, and AB).
This trading tool main focus is on precise Fibonacci ratios and determining Potential Reversal Zones (PRZ) to make entry and exit points easier to find.
In this indicator, bullish patterns are drawn in pink, while bearish patterns are depicted in dark blue.
Specification Table of the Navarro 200 Harmonic Pattern Indicator
The technical features of the Navarro 200 Harmonic Pattern Indicator are as follows:
Indicator Categories: | Chart & Classic MT4 Indicators Harmonic MT4 Indicators Candle Sticks MT4 Indicators |
Platforms: | MetaTrader 4 Indicators |
Trading Skills: | Intermediate |
Indicator Types: | Reversal MT4 Indicators |
Timeframe: | Multi-Timeframe MT4 Indicators |
Trading Style: | Intraday MT4 Indicators |
Trading Instruments: | Share Stocks MT4 Indicators Indices Market MT4 Indicators Commodity Market MT4 Indicators Stock Market MT4 Indicators Cryptocurrency MT4 Indicators Forex MT4 Indicators |
At a Glance Navarro 200 Harmonic Reversal Pattern Indicator
In the Navarro 200 Harmonic Pattern Indicator, a pattern is recognized as a valid harmonic formation only when the Fibonacci ratios match the predefined standards exactly.
The Fibonacci ratios include:
- AB to XA ratio: Between 0.382 to 0.618
- BC to AB ratio: Between 0.382 to 0.886
- CD to BC ratio: Between 1.618 to 2.618
- CD to XA (overall ratio): Typically 0.786, 1.272, or 1.618 depending on the pattern type
Bullish Navarro 200 Pattern Performance
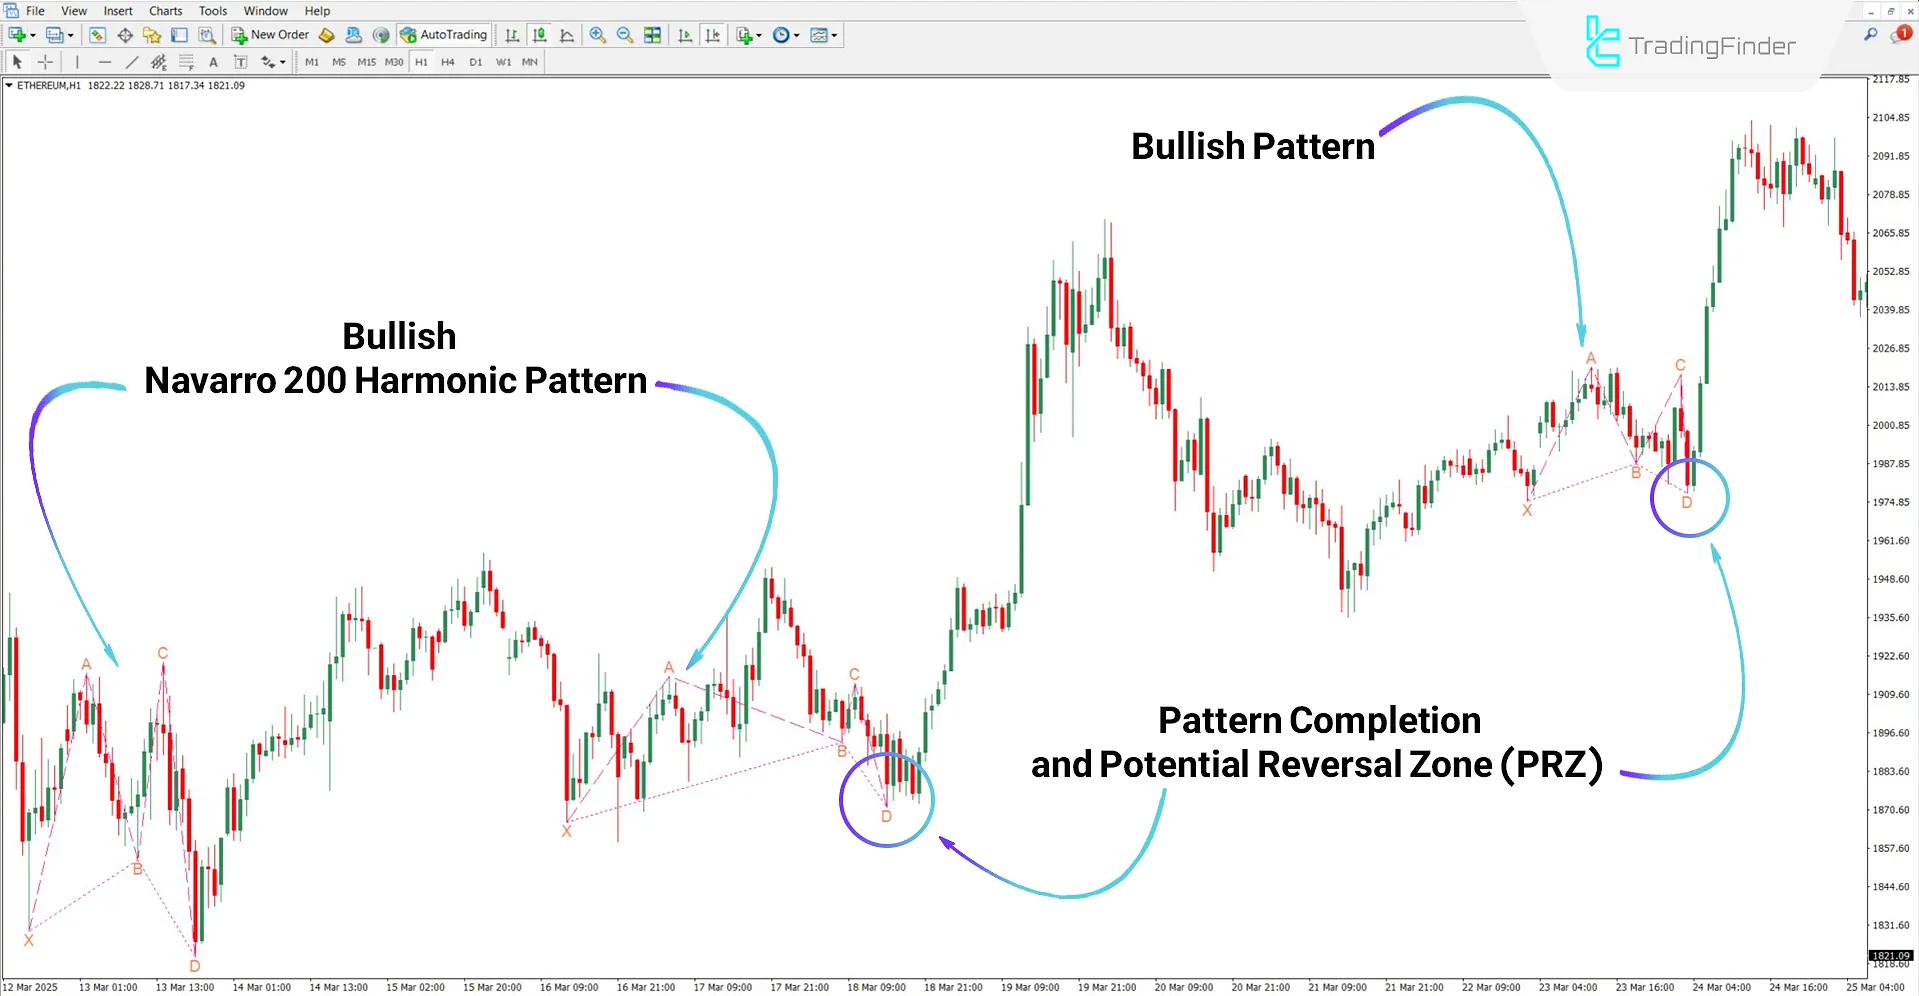
Based on the analysis of Ethereum (ETH) in the 1-hour timeframe, three instances of bullish Navarro 200 harmonic patterns are visible.
In each case, the market reverses to the upside after the pattern completes at point "D."

Bearish Navarro 200 Pattern Performance
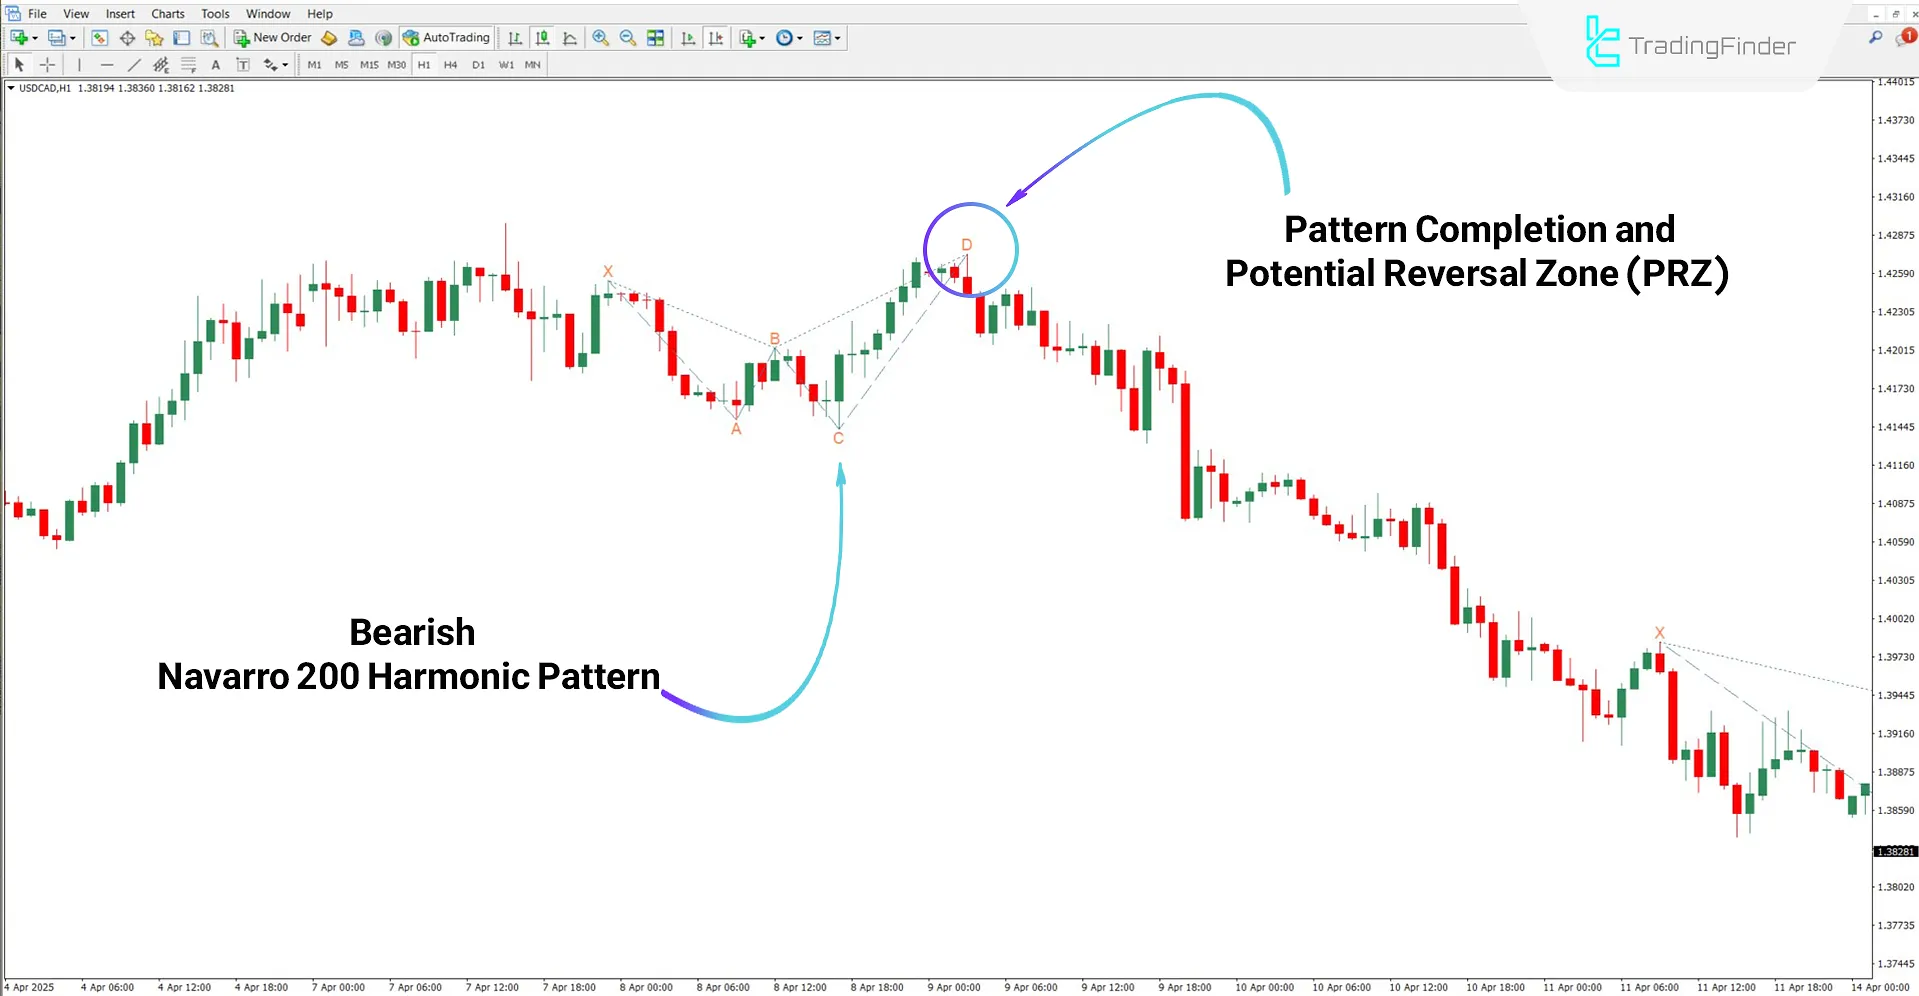
According to the USD/CAD currency pair analysis, the bearish Navarro 200 pattern appears in the shape of a "W" and is drawn in dark blue. The pattern completes at point "D," marking it as a suitable entry point for short trades.

Settings of the Navarro 200 Harmonic Pattern Indicator
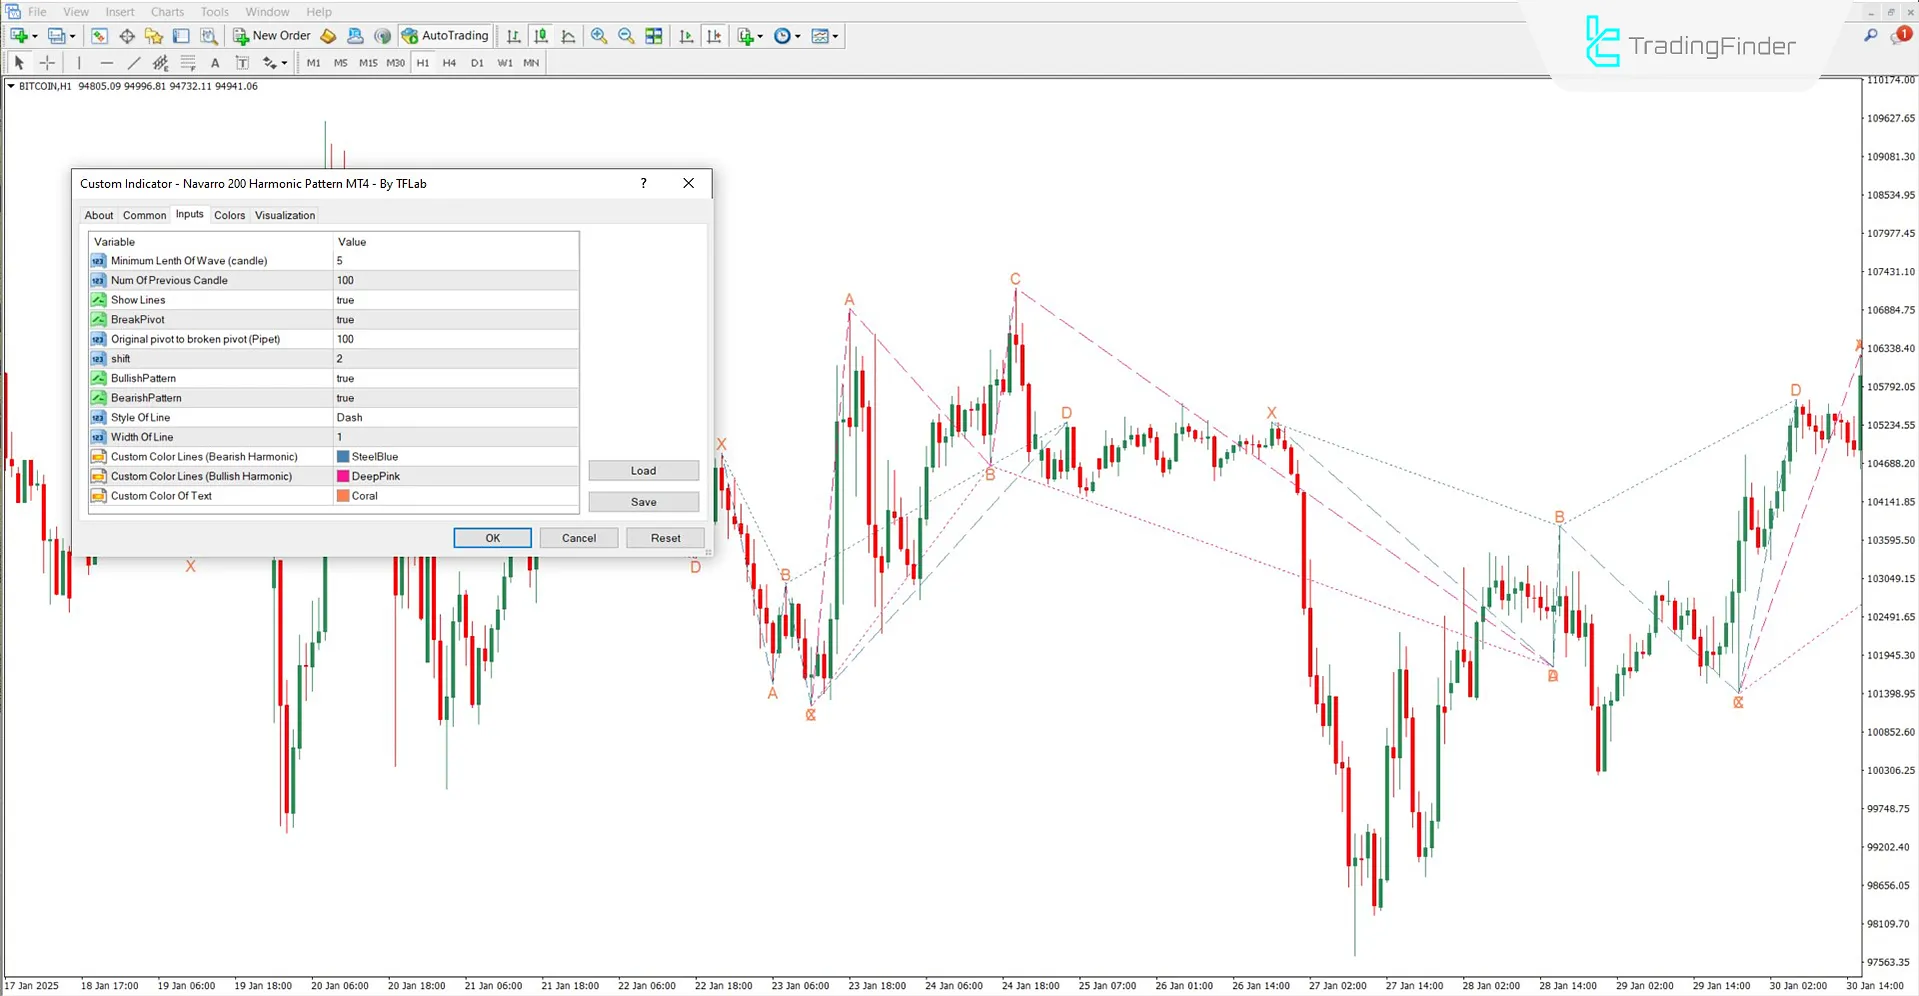
The adjustable parameters in the Navarro 200 Harmonic Pattern Indicator include:

- Minimum Length of Wave (candle): Minimum number of candles required to form each wave
- Num of Previous Candle: Number of historical candles analyzed to detect wave structures
- Show Lines: Enable/disable pattern lines
- Break Pivot: Toggle the display of broken pivot lines
- Original pivot to broken pivot (Pipet): Allowed distance between original and broken pivot
- Shift: Move pattern lines forward or backward on the chart
- Bullish Pattern: Enable display of bullish patterns
- Bearish Pattern: Enable display of bearish patterns
- Style of Line: Type of line connecting pattern points
- Width of Line: Thickness of pattern lines
- Custom Color Lines (Bearish Harmonic): Choose a color for bearish pattern lines
- Custom Color Lines (Bullish Harmonic): Choose a color for bullish pattern lines
- Custom Color of Text: Text and label color
Conclusion
The Navarro 200 Harmonic Pattern Indicator identifies potential reversal zones by forming bullish and bearish Navarro 200 patterns. With this tool, traders can spot optimal entry points and make more confident exit decisions.
This trading tool applies across various markets, including cryptocurrencies, stocks, forex, and commodities.
Navarro 200 Harmonic Pattern MT4 PDF
Navarro 200 Harmonic Pattern MT4 PDF
Click to download Navarro 200 Harmonic Pattern MT4 PDFWhat is the PRZ (Potential Reversal Zone)?
A zone identified by the convergence of multiple Fibonacci ratios, where the probability of a price reversal is very high.
Which timeframes are suitable for using this indicator?
This indicator is capable of drawing patterns across all timeframes.


