![Neuro Trend Indicator MetaTrader 4 Download - [TradingFinder]](https://cdn.tradingfinder.com/image/423744/2-81-en-neuro-trend-mt4-1.webp)
![Neuro Trend Indicator MetaTrader 4 Download - [TradingFinder] 0](https://cdn.tradingfinder.com/image/423744/2-81-en-neuro-trend-mt4-1.webp)
![Neuro Trend Indicator MetaTrader 4 Download - [TradingFinder] 1](https://cdn.tradingfinder.com/image/423743/2-81-en-neuro-trend-mt4-2.webp)
![Neuro Trend Indicator MetaTrader 4 Download - [TradingFinder] 2](https://cdn.tradingfinder.com/image/423742/2-81-en-neuro-trend-mt4-3.webp)
![Neuro Trend Indicator MetaTrader 4 Download - [TradingFinder] 3](https://cdn.tradingfinder.com/image/423741/2-81-en-neuro-trend-mt4-4.webp)
The Neurotrend Indicator is a technical analysis tool that leverages artificial neural networks to analyze market price behavior and forecast its future movements. This indicator displays entry and exit signals through colored dots (blue and red).
Additionally, the indicator outputs two colored lines on the chart:
- The blue line indicates a bullish trend and the market's dominance by buyers
- The red line signals a bearish trend and the presence of selling pressure
Neuro Trend Indicator Table
The general specifications of the Neurotrend Indicator are presented in the following table.
Indicator Categories: | Price Action MT4 Indicators Trading Assist MT4 Indicators Bands & Channels MT4 Indicators |
Platforms: | MetaTrader 4 Indicators |
Trading Skills: | Intermediate |
Indicator Types: | Reversal MT4 Indicators |
Timeframe: | Multi-Timeframe MT4 Indicators |
Trading Style: | Intraday MT4 Indicators |
Trading Instruments: | Stock Market MT4 Indicators Cryptocurrency MT4 Indicators Forex MT4 Indicators |
Overview of the Neuro Trend Indicator
The Neuro Trend Indicator is based on a series of designed algorithms. These algorithms analyze historical price data in depth and compare it with real-time market conditions to predict potential future trends.
The output of this analysis is displayed as colored dots on the chart, indicating key areas for trend continuation or reversal.
Uptrend Conditions
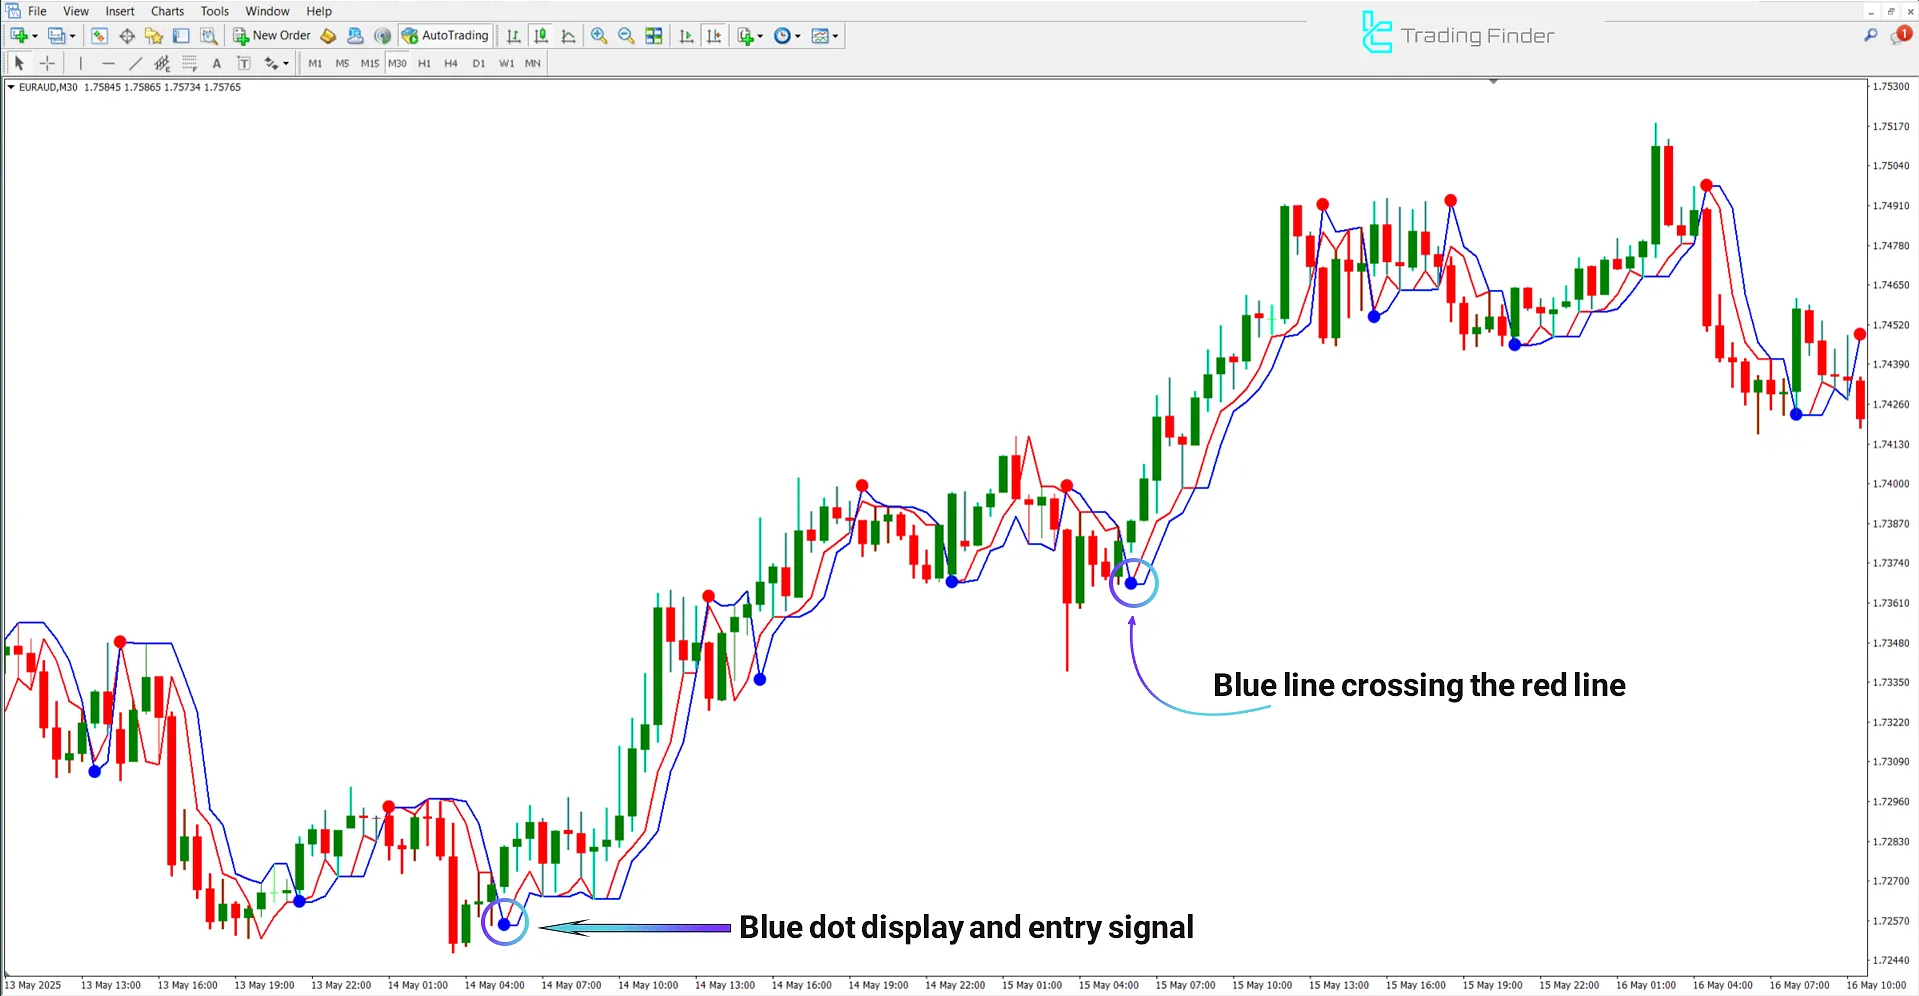
In the 30-minute chart of the EUR/AUD currency pair, when the blue line of the indicator exhibits an upward curvature, it signifies the start of a bullish phase and a gradual increase in buying strength, creating a zone for Buy entries.

Downtrend Conditions
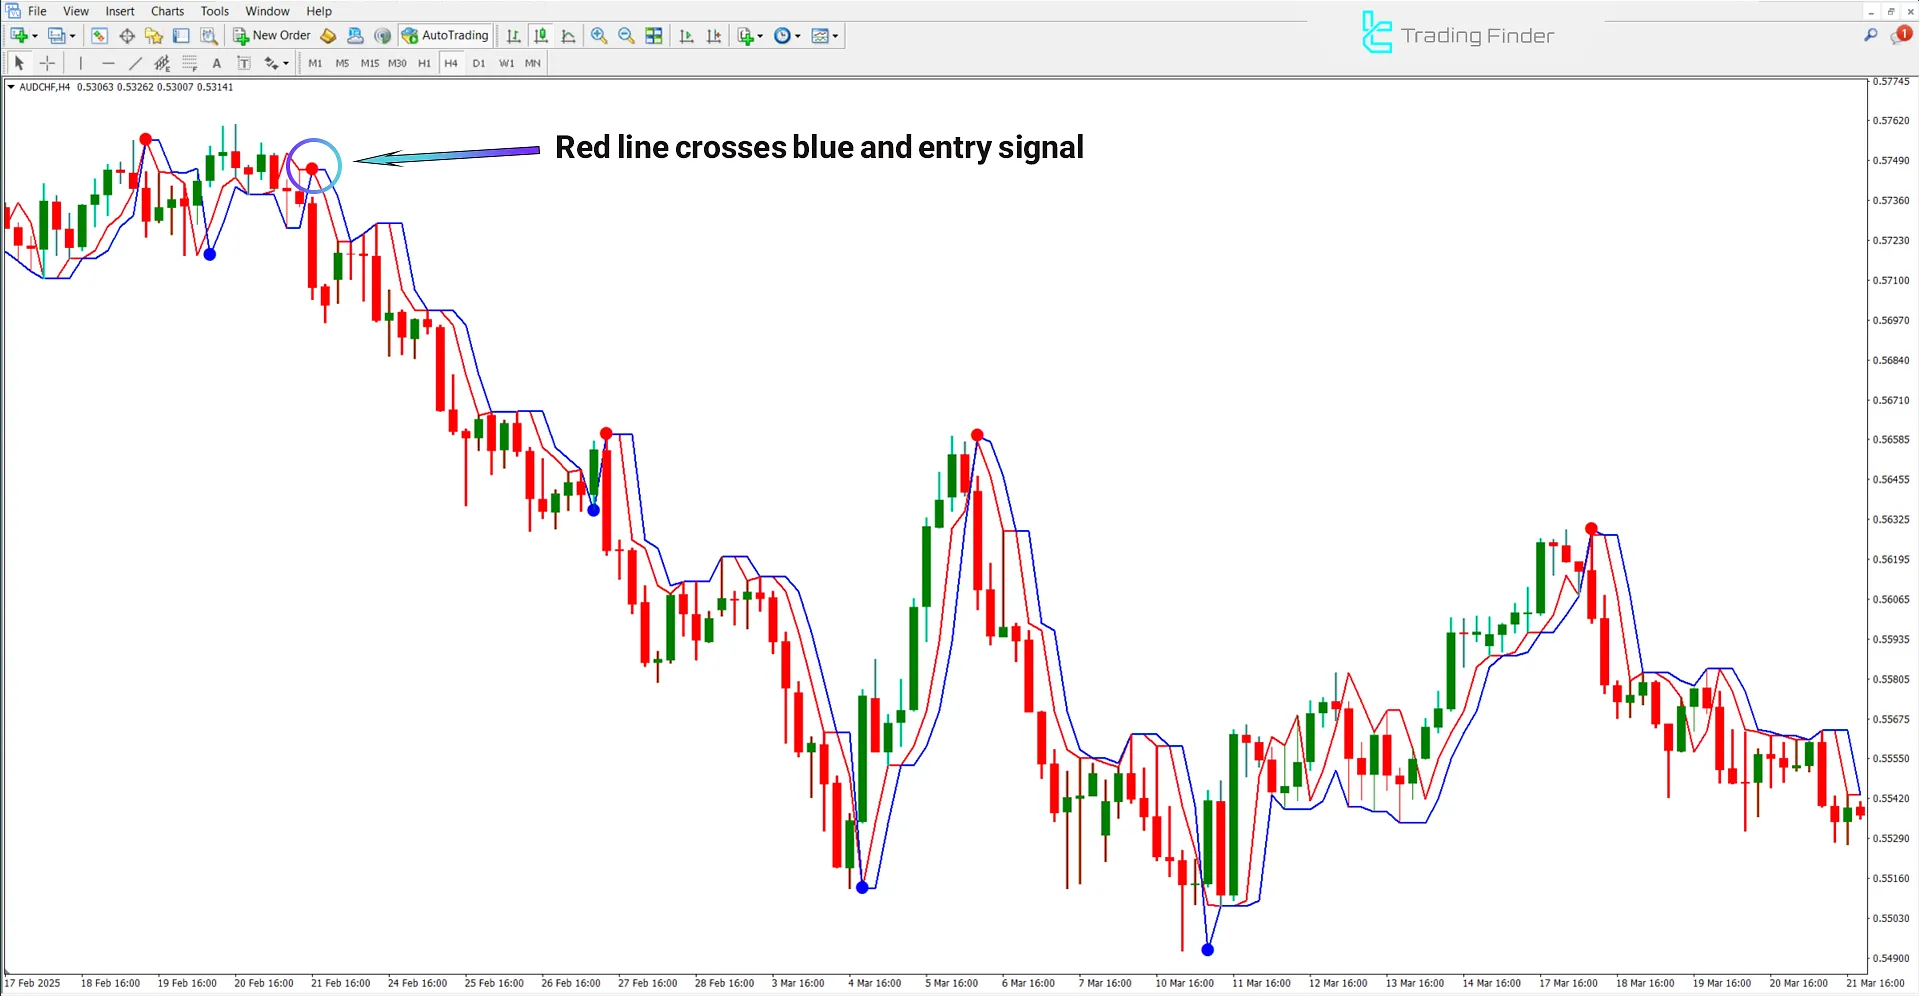
The price chart below shows the AUD/CHF currency pair in the 4-hour timeframe. When the red line of this trading tool appears with a downward curvature and subsequently crosses the blue line from top to bottom, it indicates the beginning of a bearish trend and increasing selling pressure.
The appearance of a red dot on the chart further confirms seller dominance.

Neurotrend Indicator Settings
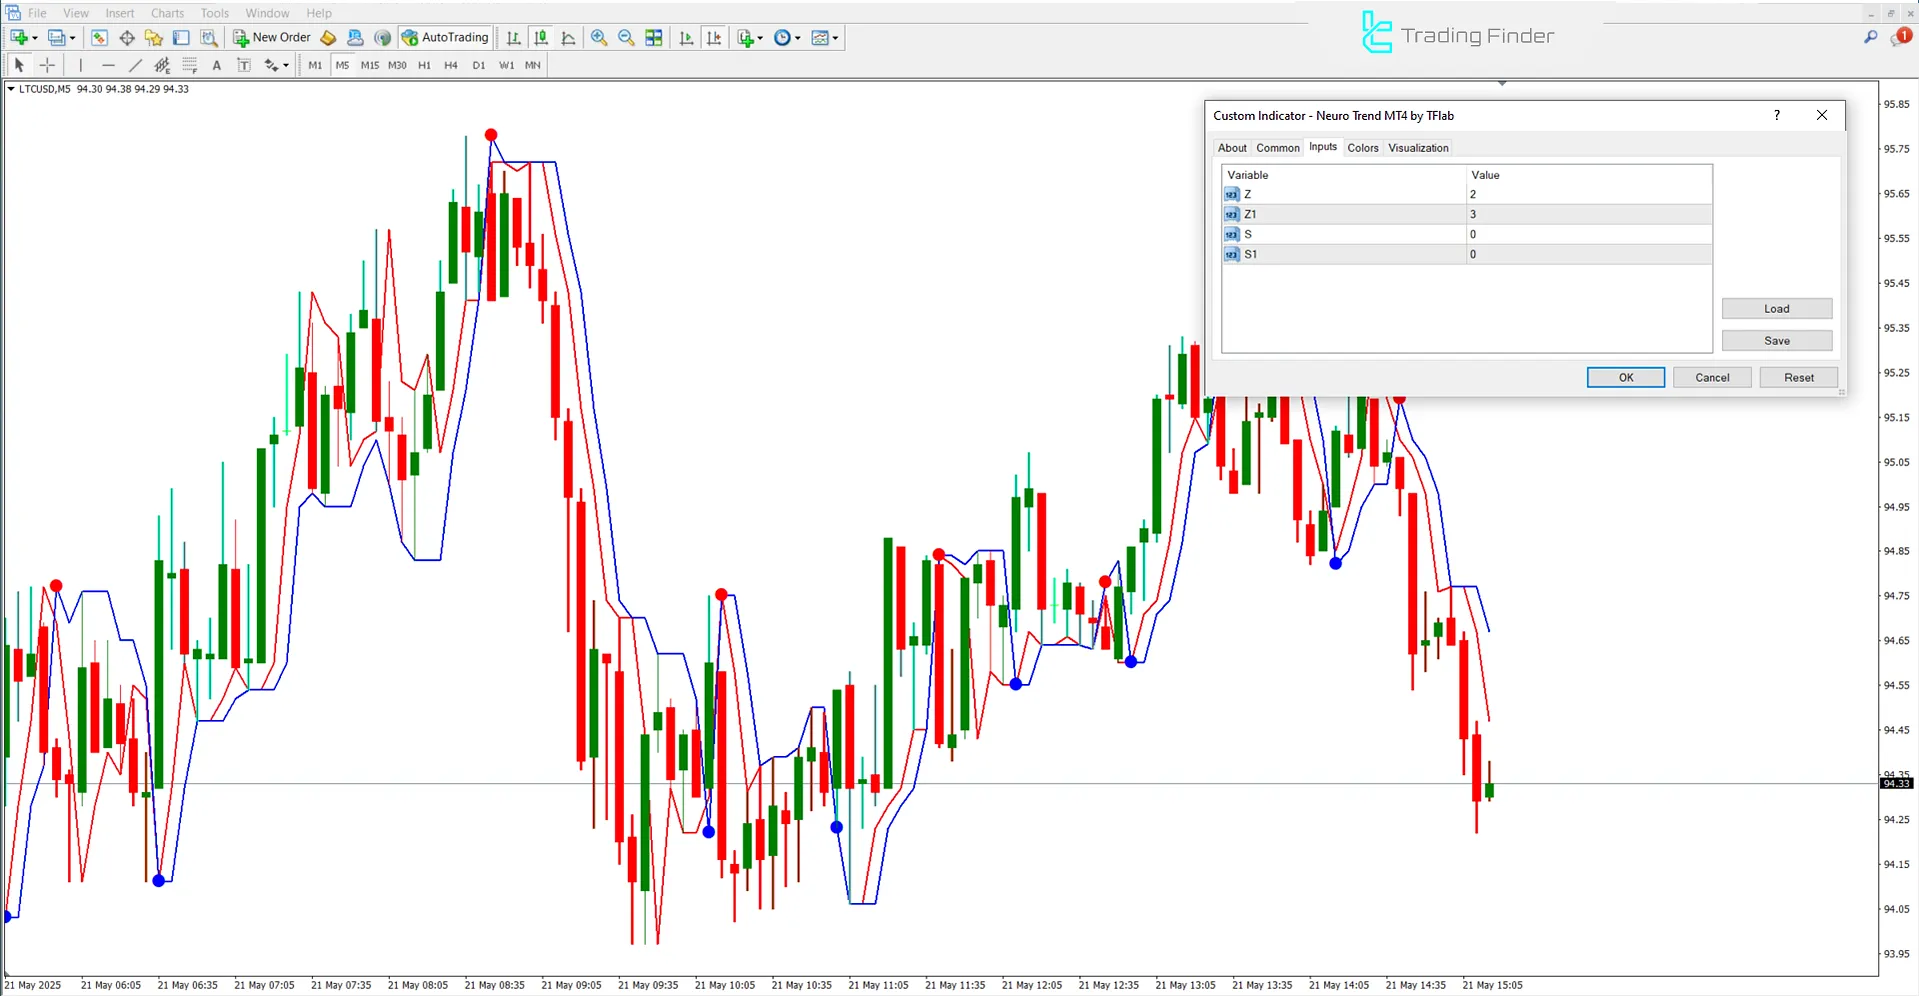
The Neurotrend Indicator settings panel is shown in the image below:

- Z: Smoothing coefficient Z;
- Z1: Smoothing coefficient Z1;
- S: Signal sensitivity S;
- S1: Signal sensitivity S1.
Conclusion
The Neuro Trend Indicator, using neural networks, identifies bullish and bearish market trends by analyzing price patterns. It confirms entry and exit signals through the crossover of the blue and red lines, as well as the appearance of colored dots.
What is the role of colored dots in the Neuro Trend Indicator?
In this trading tool, blue and red dots, respectively, signal the continuation of bullish or bearish trends and serve as confirmation for primary crossovers.
What does the red line in the Neuro Trend Indicator represent?
The red line indicates a bearish market trend, showcasing seller dominance and the onset of a negative market phase.


