![On-Balance Volume (OBV) Divergence Indicator for MT4 Download - Free - [TFLab]](https://cdn.tradingfinder.com/image/106370/10-9-en-obv-divergence-mt4.webp)
![On-Balance Volume (OBV) Divergence Indicator for MT4 Download - Free - [TFLab] 0](https://cdn.tradingfinder.com/image/106370/10-9-en-obv-divergence-mt4.webp)
![On-Balance Volume (OBV) Divergence Indicator for MT4 Download - Free - [TFLab] 1](https://cdn.tradingfinder.com/image/31737/10-09-en-obv-divergence-mt4-02.avif)
![On-Balance Volume (OBV) Divergence Indicator for MT4 Download - Free - [TFLab] 2](https://cdn.tradingfinder.com/image/31740/10-09-en-obv-divergence-mt4-03.avif)
![On-Balance Volume (OBV) Divergence Indicator for MT4 Download - Free - [TFLab] 3](https://cdn.tradingfinder.com/image/31745/10-09-en-obv-divergence-mt4-04.avif)
On June 22, 2025, in version 2, alert/notification functionality was added to this indicator
The Automatic On Balance Volume Divergence (OBV Divergence) Indicator is part of the momentum Technical analysis indicators series in MetaTrader 4 that automatically detects divergences between trading volume and price.
It allows traders to identify these divergences and potential trend reversal points without manual analysis. This Metatrader4 oscillator marks buy signals in blue and sell signals in pink.
Indicator Table
Indicator Categories: | Oscillators MT4 Indicators Signal & Forecast MT4 Indicators Volatility MT4 Indicators |
Platforms: | MetaTrader 4 Indicators |
Trading Skills: | Elementary |
Indicator Types: | Reversal MT4 Indicators Non-Repainting MT4 Indicators |
Timeframe: | M1-M5 Time MT4 Indicators M15-M30 Time MT4 Indicators H4-H1 Time MT4 Indicators |
Trading Style: | Day Trading MT4 Indicators Intraday MT4 Indicators Scalper MT4 Indicators |
Trading Instruments: | Share Stocks MT4 Indicators Stock Market MT4 Indicators Cryptocurrency MT4 Indicators Forex MT4 Indicators |
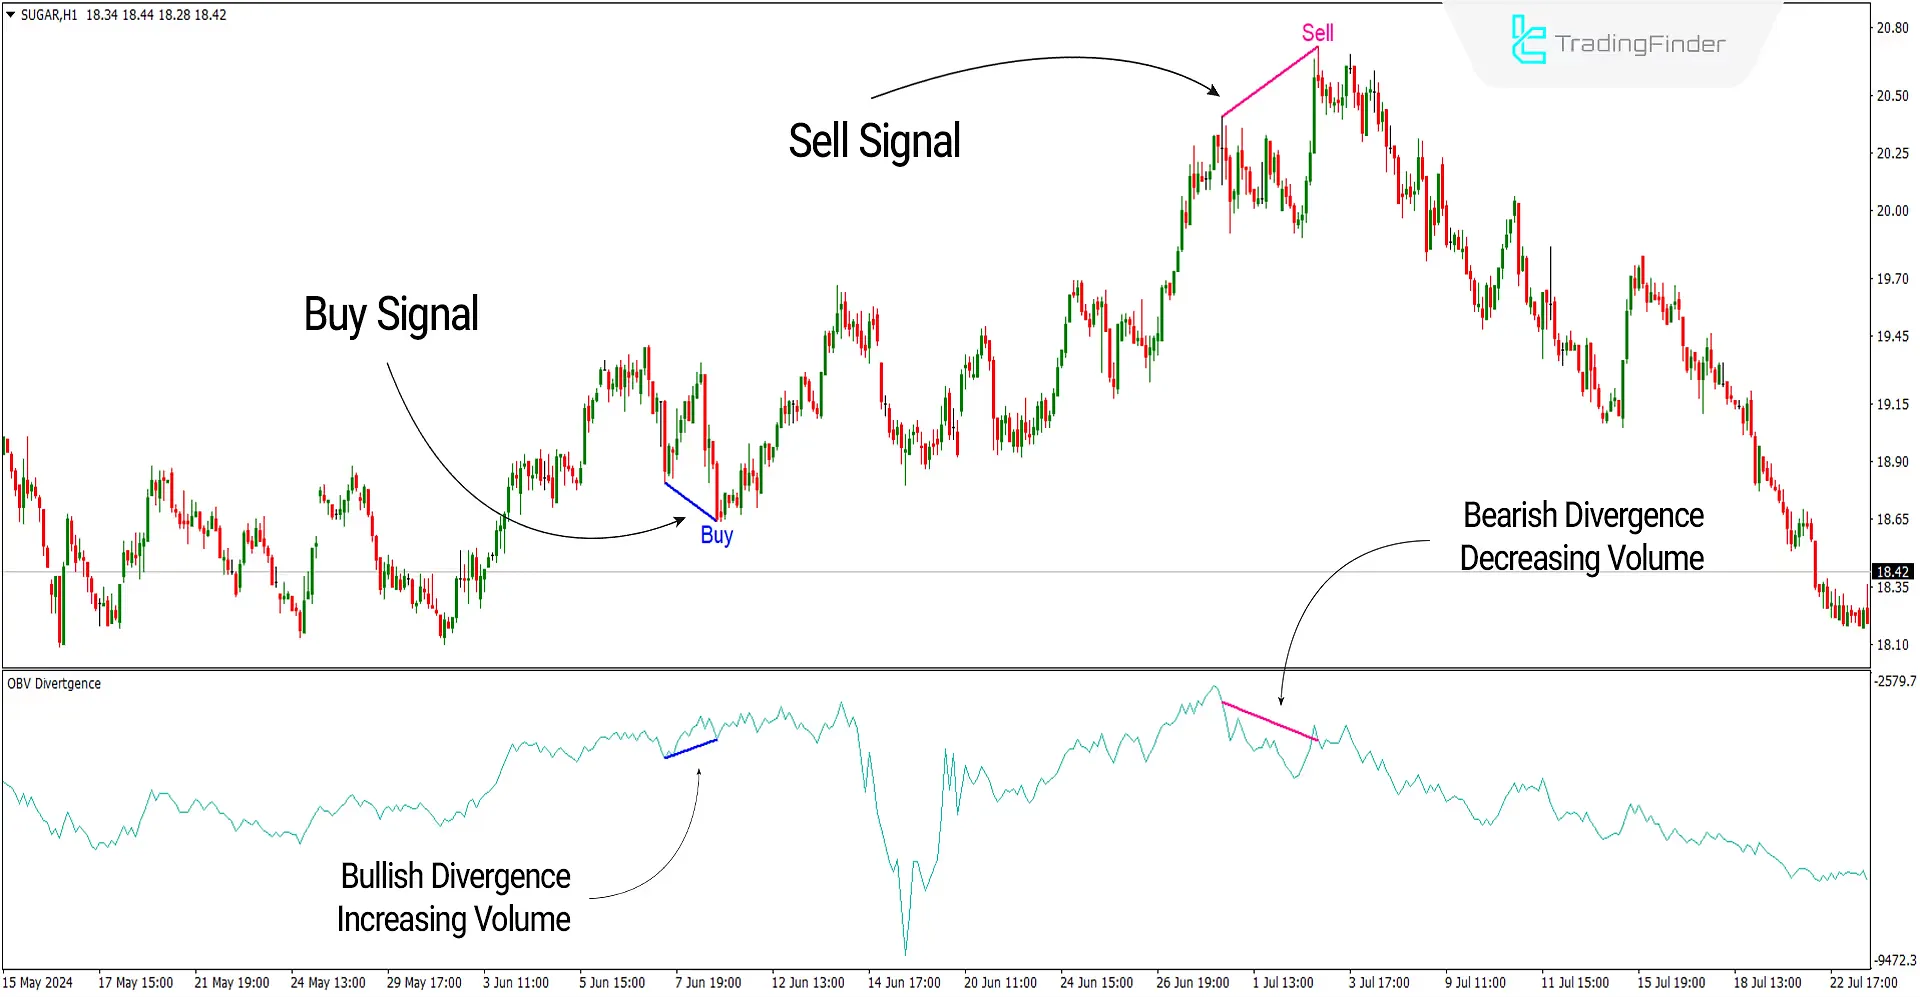
In the image below, the price chart of Sugar with the symbol [SUGAR] is shown in a 1-hour timeframe. At the end of a downward correction, the last low is lower than the previous low (LL), but the OBV Divergence curve is rising, showing a bullish (positive) divergence.
In this situation, a buy signal is displayed on the chart. Similarly, at the end of an uptrend, the last high goes beyond the previous high (HH), but the indicator curve is decreasing, showing a bearish (negative) divergence. In this condition, a sell signal is issued, indicating a reversal from an uptrend to a downtrend.

Overview
The Automatic Divergence Indicator (OBV Divergence) is a Trading tool that identifies potential market trend changes by detecting discrepancies between the indicator's direction and the price.
Comparing trading volume with price changes identifies the flow of incoming and outgoing funds, making divergences a good indicator for trend reversals.
Buy Signal (Buy Position)
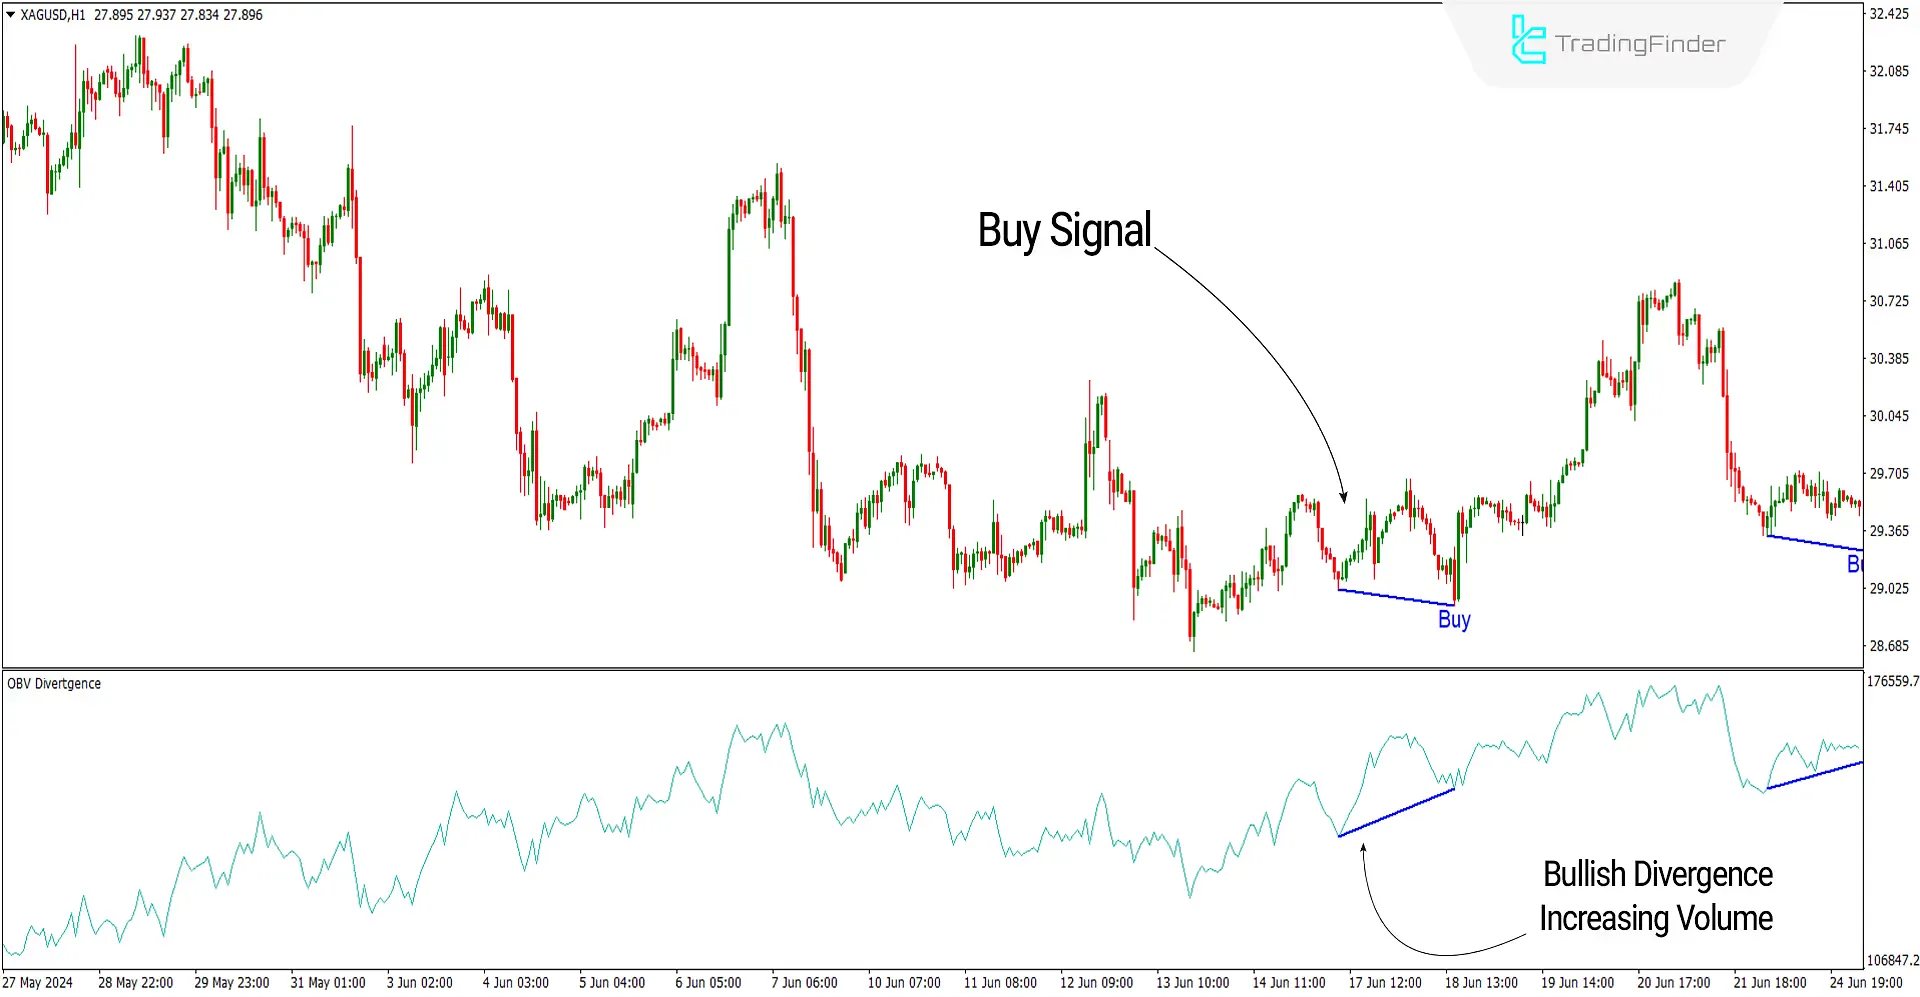
In the image below, the price chart of Silver with the symbol (XAGUSD) is shown in a 1-hour timeframe. The price registers a new lower low at the end of a downtrend, but the indicator curve is rising.
This condition indicates buying pressure and the possibility of a trend reversal to the upside, and the indicator displays a buy signal on the chart.Top of FormBottom of Form

Sell Signal (Sell Position)
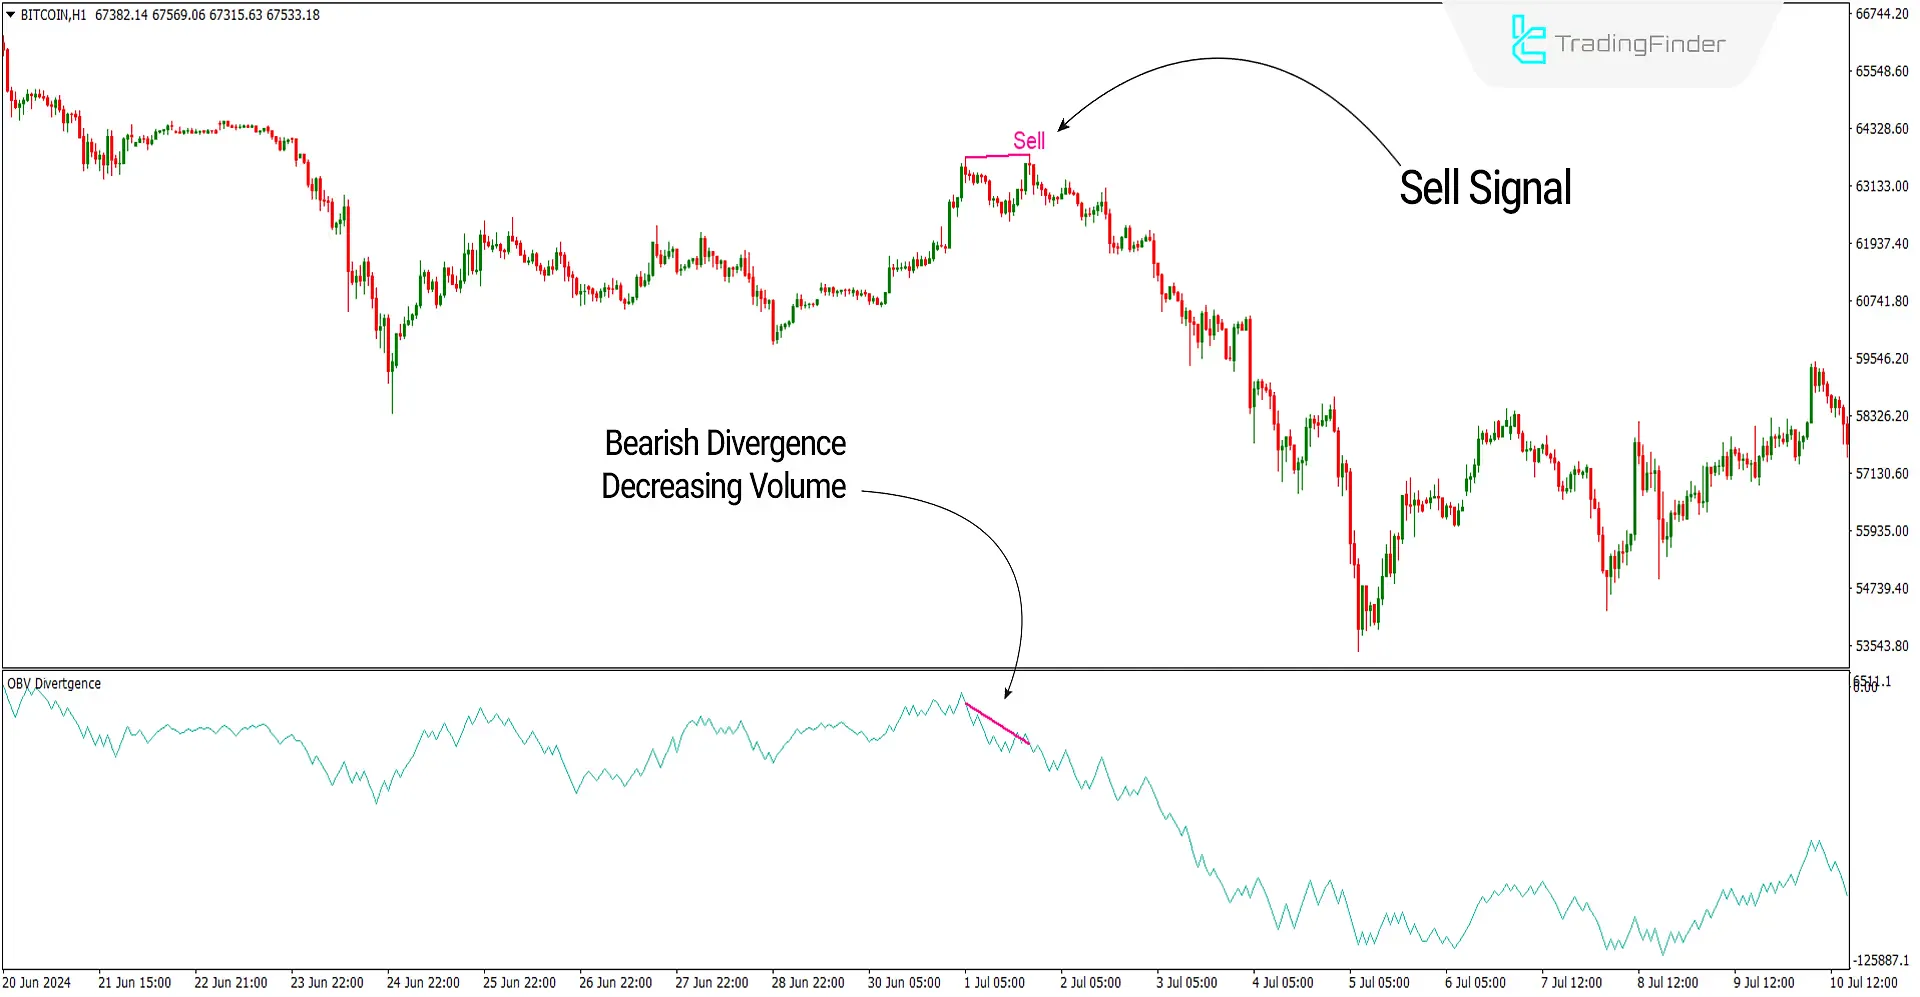
In the image below, the price chart of Bitcoin with the symbol (BITCOIN) is shown in a 1-hour timeframe. At the end of an uptrend, the price registers a new higher high, but the indicator curve is decreasing.
This situation indicates selling pressure and the possibility of a trend reversal to the downside, and the indicator displays a sell signal on the chart.

Settings of the OBV Divergence Indicator

- OBV Period: The OBV period is set to 14;
- Number of candles for Pivots calculation: The number for pivot calculation is set to 8;
- Maximum distance between two pivots: The maximum distance between two pivots is 30;
- Minimum distance between two pivots: The minimum distance between two pivots is 5;
- Number of divergences from pivot: The number of divergences from each pivot is 1;
- Number of OBV that break the line: The number of RSI line breaks is set to 2;
- Shift: The shift is set to 2;
- Sell_Divergence: Set the color for sell signals to pink or any color you choose;
- Buy_Divergence: Set the color for buy signals to blue or any color you choose;
- Width: The width of the divergence line can be set to 2.
Conclusion
The OBV Divergence Indicator is a technical analysis tool that identifies divergence points between price and trading volume across various timeframes. Divergences occur when the price and OBV indicators move in opposite directions.
OBV divergences can provide solid signals for potential trend changes. However, thisVolatility indicator may generate false signals in range-bound markets, so it is best used in trending markets.
On-Balance Volume OBV Divergence MT4 PDF
On-Balance Volume OBV Divergence MT4 PDF
Click to download On-Balance Volume OBV Divergence MT4 PDFHow to Identify OBV Divergences?
Divergences are detected when the price movement direction contrasts with the OBV indicator.
Does the OBV Divergence Indicator Have Any Limitations?
Yes, the OBV indicator may produce false signals in range-bound markets. To improve analysis accuracy, it is recommended that this indicator be used in conjunction with other technical analysis tools.


