![OBV Divergence Indicator for MT4 Download – Free – [TradingFinder]](https://cdn.tradingfinder.com/image/477378/13-178-en-obv-divergence-mt4-01.webp)
![OBV Divergence Indicator for MT4 Download – Free – [TradingFinder] 0](https://cdn.tradingfinder.com/image/477378/13-178-en-obv-divergence-mt4-01.webp)
![OBV Divergence Indicator for MT4 Download – Free – [TradingFinder] 1](https://cdn.tradingfinder.com/image/477377/13-178-en-obv-divergence-mt4-02.webp)
![OBV Divergence Indicator for MT4 Download – Free – [TradingFinder] 2](https://cdn.tradingfinder.com/image/477380/13-178-en-obv-divergence-mt4-03.webp)
![OBV Divergence Indicator for MT4 Download – Free – [TradingFinder] 3](https://cdn.tradingfinder.com/image/477379/13-178-en-obv-divergence-mt4-04.webp)
The OBV Divergence Indicator is a practical tool in MetaTrader 4, used for identifying divergence between price and volume in technical analysis.
This trading tool is based on the On Balance Volume (OBV) indicator and utilizes green and red lines to display OBV divergences on the chart.
OBV Divergence Indicator Specifications Table
The following table presents the specifications of the OBV Divergence Indicator:
Indicator Categories: | Volume MT4 Indicators Signal & Forecast MT4 Indicators Trading Assist MT4 Indicators |
Platforms: | MetaTrader 4 Indicators |
Trading Skills: | Intermediate |
Indicator Types: | Reversal MT4 Indicators |
Timeframe: | Multi-Timeframe MT4 Indicators |
Trading Style: | Day Trading MT4 Indicators Scalper MT4 Indicators Swing Trading MT4 Indicators |
Trading Instruments: | Share Stocks MT4 Indicators Indices Market MT4 Indicators Commodity Market MT4 Indicators Stock Market MT4 Indicators Cryptocurrency MT4 Indicators Forex MT4 Indicators |
OBV Divergence Indicator at a Glance
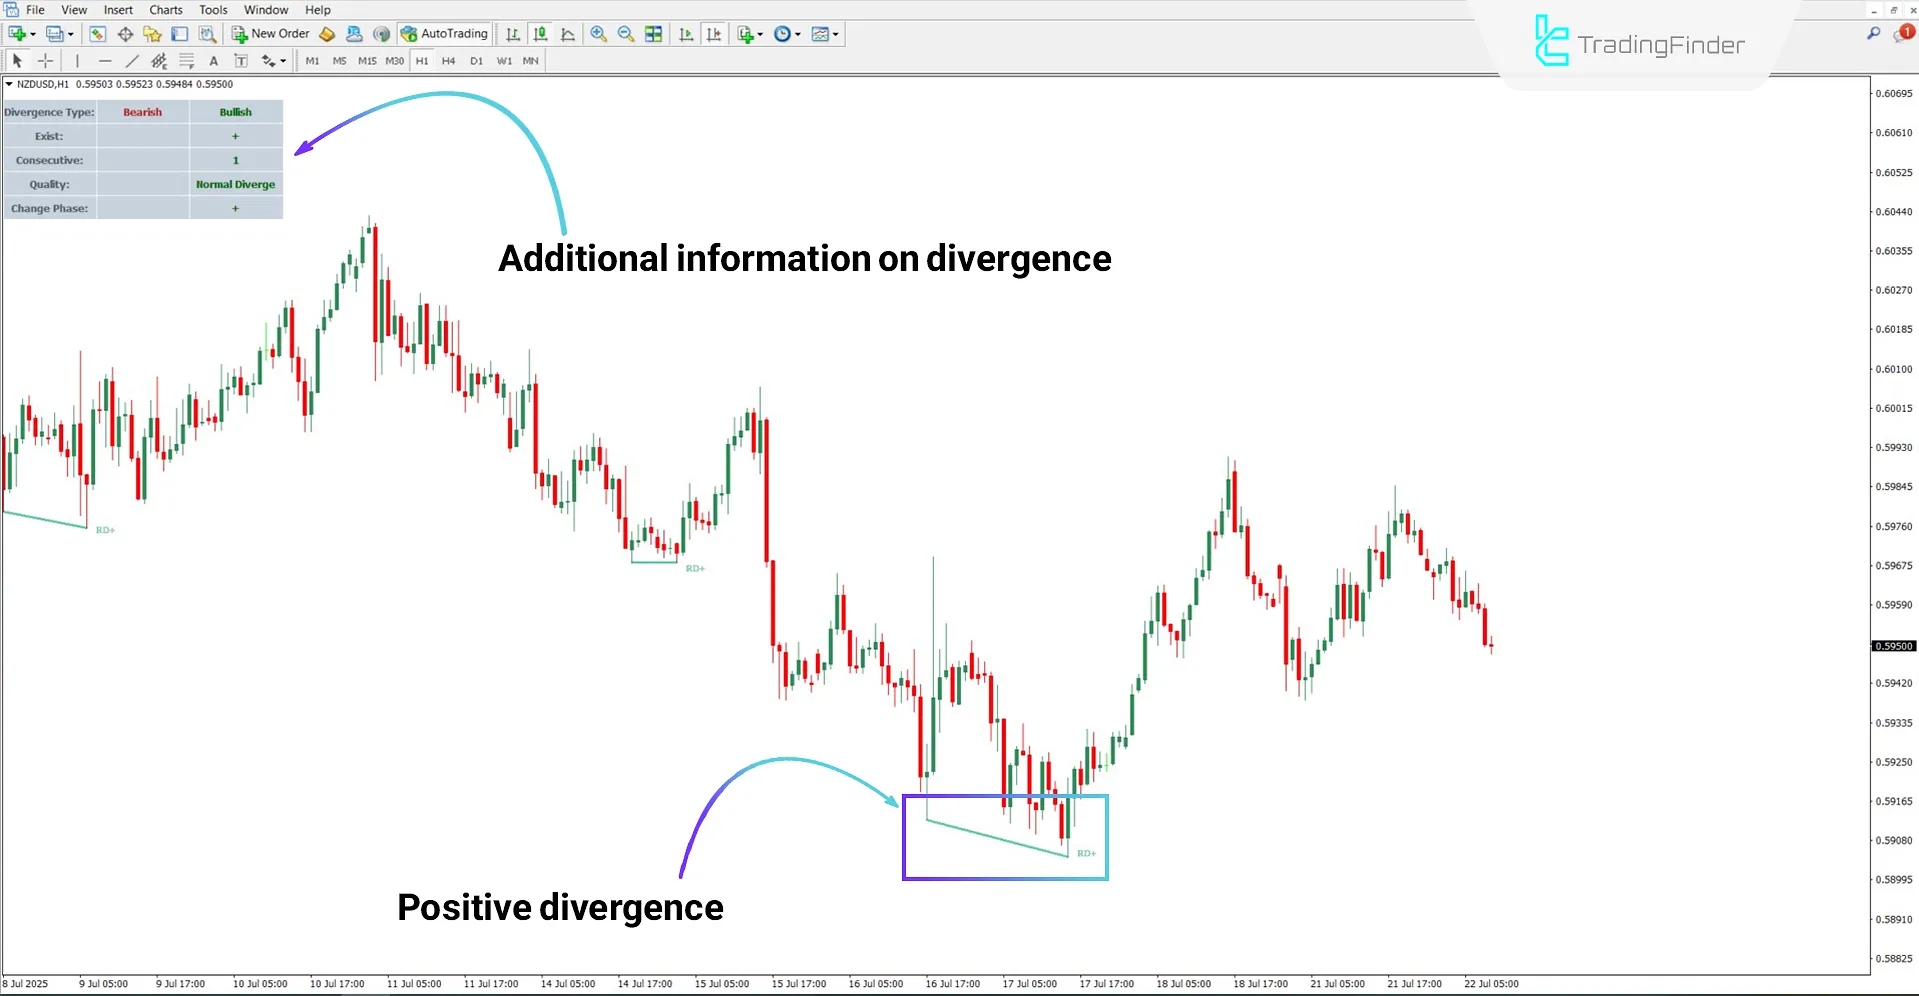
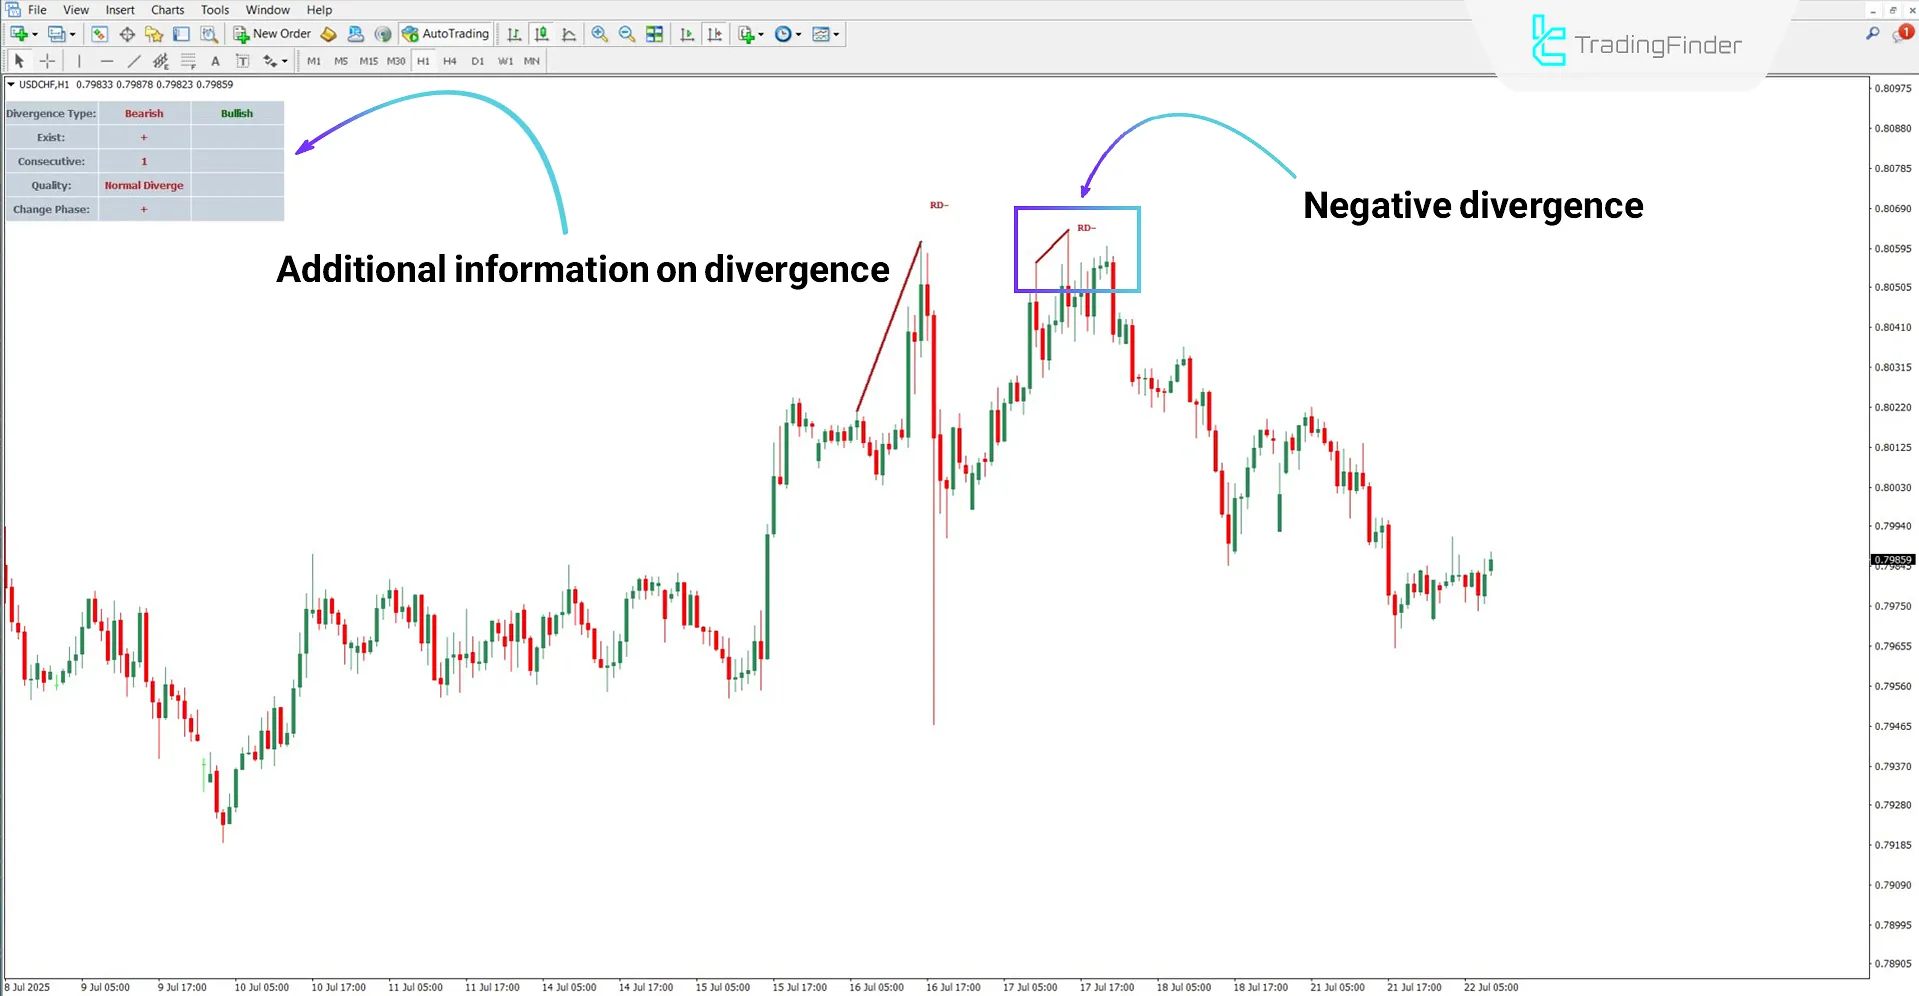
In addition to displaying divergences as lines, the OBV Divergence Indicator draws a table on the chart containing additional information related to the divergences, including:
- Divergence Type: Type of divergence (bullish or bearish)
- Exist: Indicates the presence of divergence with a positive or negative sign
- Consecutive: Number of consecutive divergences
- Quality: Measures the strength and quality of the divergence
- Change Phase: Displays trend phase changes
Note: This information is only analyzed for the current divergence.
Bullish Trend Conditions (Positive Divergence)
In the example of the 1-hour chart of the NZD/USD currency pair, the indicator displays the existing divergence using a green line. As shown in the image, after the formation of the bullish divergence, the price moves higher and becomes bullish.
Additionally, in the upper-left corner of the image, the indicator provides supplementary data in the form of a table for the trader.

Bearish Trend Conditions (Negative Divergence)
According to the USD/CHF chart, after the indicator draws the negative divergence, the price reverses and turns bearish.
In addition, the OBV Divergence Indicator's table displays complementary information about the current divergence.

OBV Divergence Indicator Settings
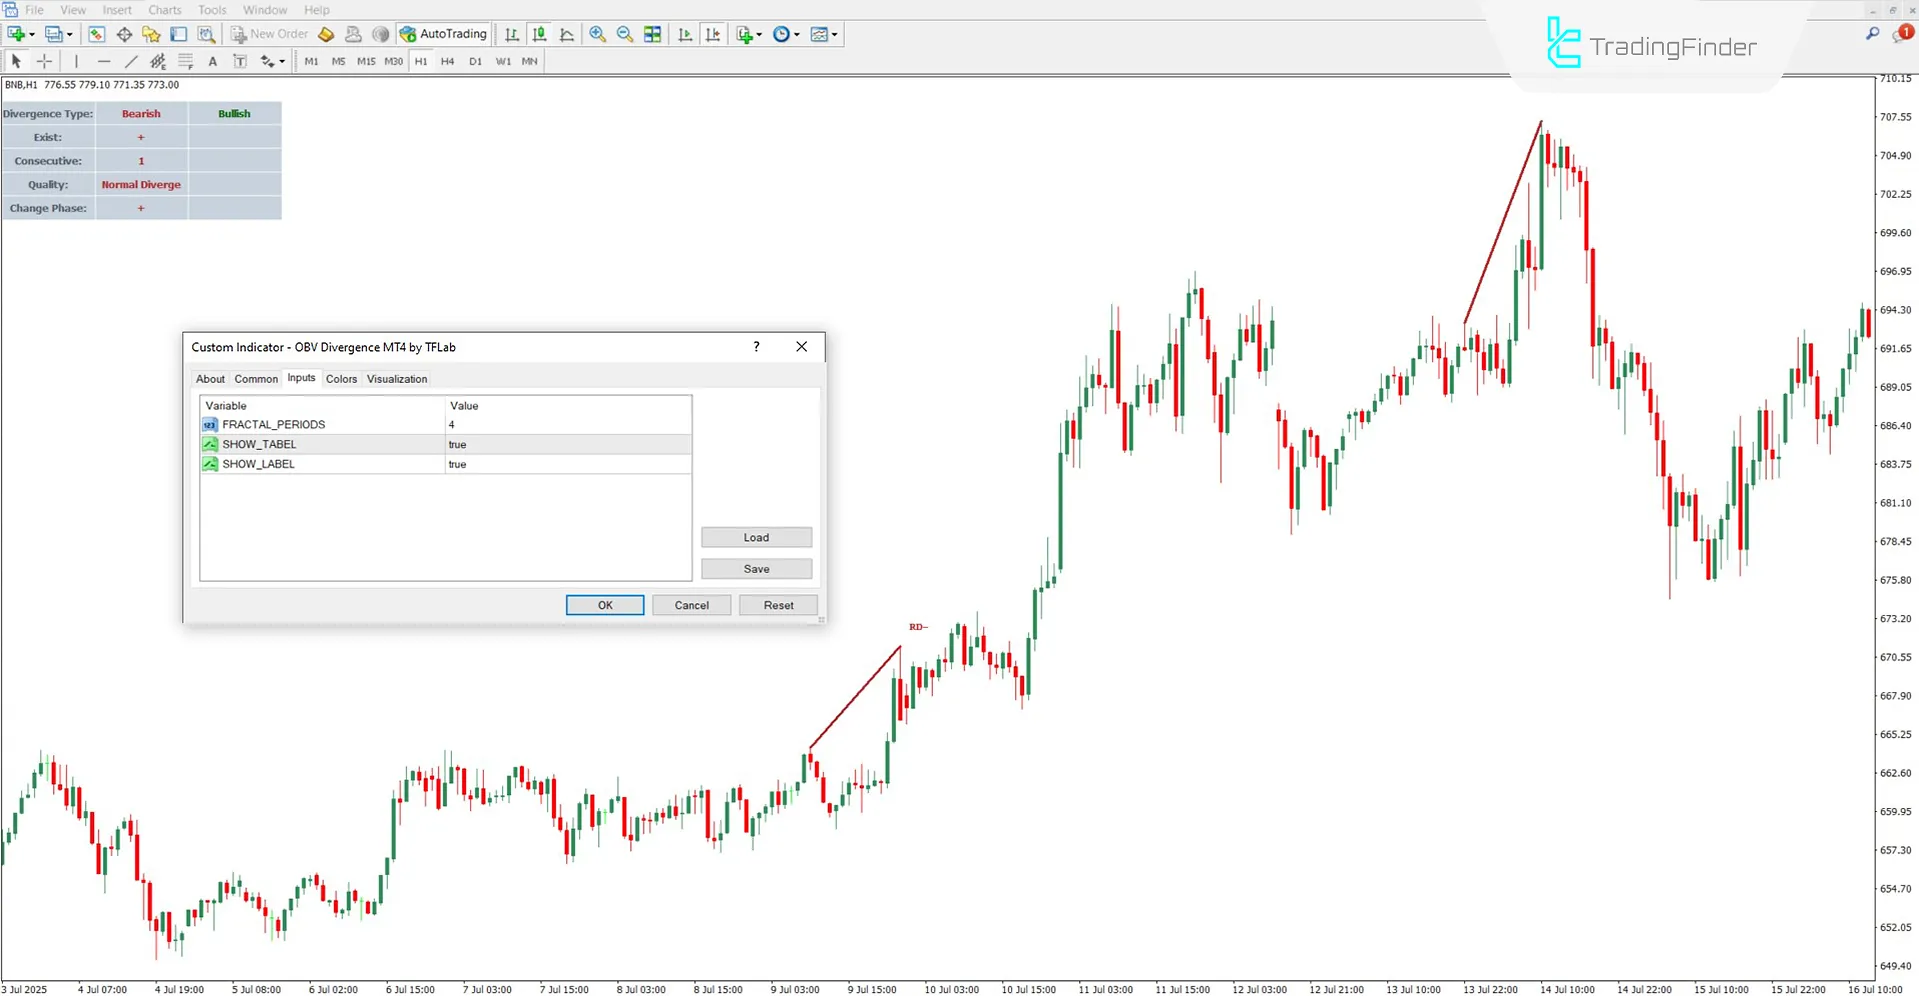
The settings for the OBV Divergence Indicator are as follows:

- FRACTAL_PERIODS: Number of reference candles for identifying peaks and troughs
- SHOW_TABEL: Show or hide the information table
- SHOW_LABEL: Show divergence labels
Conclusion
The OBV Divergence Indicator identifies divergences using a combination of visual and analytical data, plotting potential trend reversal points.
Additionally, this trading tool includes a table that displays complementary information such as the divergence type, number of consecutive divergences, and more.
OBV Divergence Indicator MT4 PDF
OBV Divergence Indicator MT4 PDF
Click to download OBV Divergence Indicator MT4 PDFIs the divergence indicator only usable in the Forex market?
No, this indicator can be used in various markets, including cryptocurrencies, stocks, and commodities.
Can this indicator be used in higher timeframes?
Yes, the OBV Divergence Indicator is a multi-timeframe tool.


