![On Balance Volume Divergence (OBV) Indicator for MT4 Download - Free - [TFlab]](https://cdn.tradingfinder.com/image/185159/4-35-en-obv-divergence-mt4-1.webp)
![On Balance Volume Divergence (OBV) Indicator for MT4 Download - Free - [TFlab] 0](https://cdn.tradingfinder.com/image/185159/4-35-en-obv-divergence-mt4-1.webp)
![On Balance Volume Divergence (OBV) Indicator for MT4 Download - Free - [TFlab] 1](https://cdn.tradingfinder.com/image/185135/4-35-en-obv-divergence-mt4-2.webp)
![On Balance Volume Divergence (OBV) Indicator for MT4 Download - Free - [TFlab] 2](https://cdn.tradingfinder.com/image/185134/4-35-en-obv-divergence-mt4-3.webp)
![On Balance Volume Divergence (OBV) Indicator for MT4 Download - Free - [TFlab] 3](https://cdn.tradingfinder.com/image/185153/4-35-en-obv-divergence-mt4-4.webp)
The On Balance Volume Divergence (OBV) indicator analyzes market buying and selling pressure by combining volume data and price movements.
This Trading Assistant Indicators, developed by Joseph Granville, utilizes cumulative volume changes to identify hidden trends and divergences in the market.
Indicator Specifications
The information related to this indicator is summarized in the table below:
Indicator Categories: | Oscillators MT4 Indicators Signal & Forecast MT4 Indicators Trading Assist MT4 Indicators |
Platforms: | MetaTrader 4 Indicators |
Trading Skills: | Intermediate |
Indicator Types: | Leading MT4 Indicators Trend MT4 Indicators |
Timeframe: | Multi-Timeframe MT4 Indicators |
Trading Style: | Intraday MT4 Indicators |
Trading Instruments: | Share Stocks MT4 Indicators Stock Market MT4 Indicators Cryptocurrency MT4 Indicators Forex MT4 Indicators |
Overview of the Indicator
The OBV Divergence indicator is instrumental in confirming price trends and identifying potential market direction changes. The current trend is confirmed when OBV and price move in the same direction.
For example, simultaneous increases in both Price and OBV indicate an uptrend.
Conversely, Divergence between OBV and Price warns of potential trend reversals. A green arrow represents a Buy signal, while a red arrow represents a Sell signal.
Indicator in an Uptrend
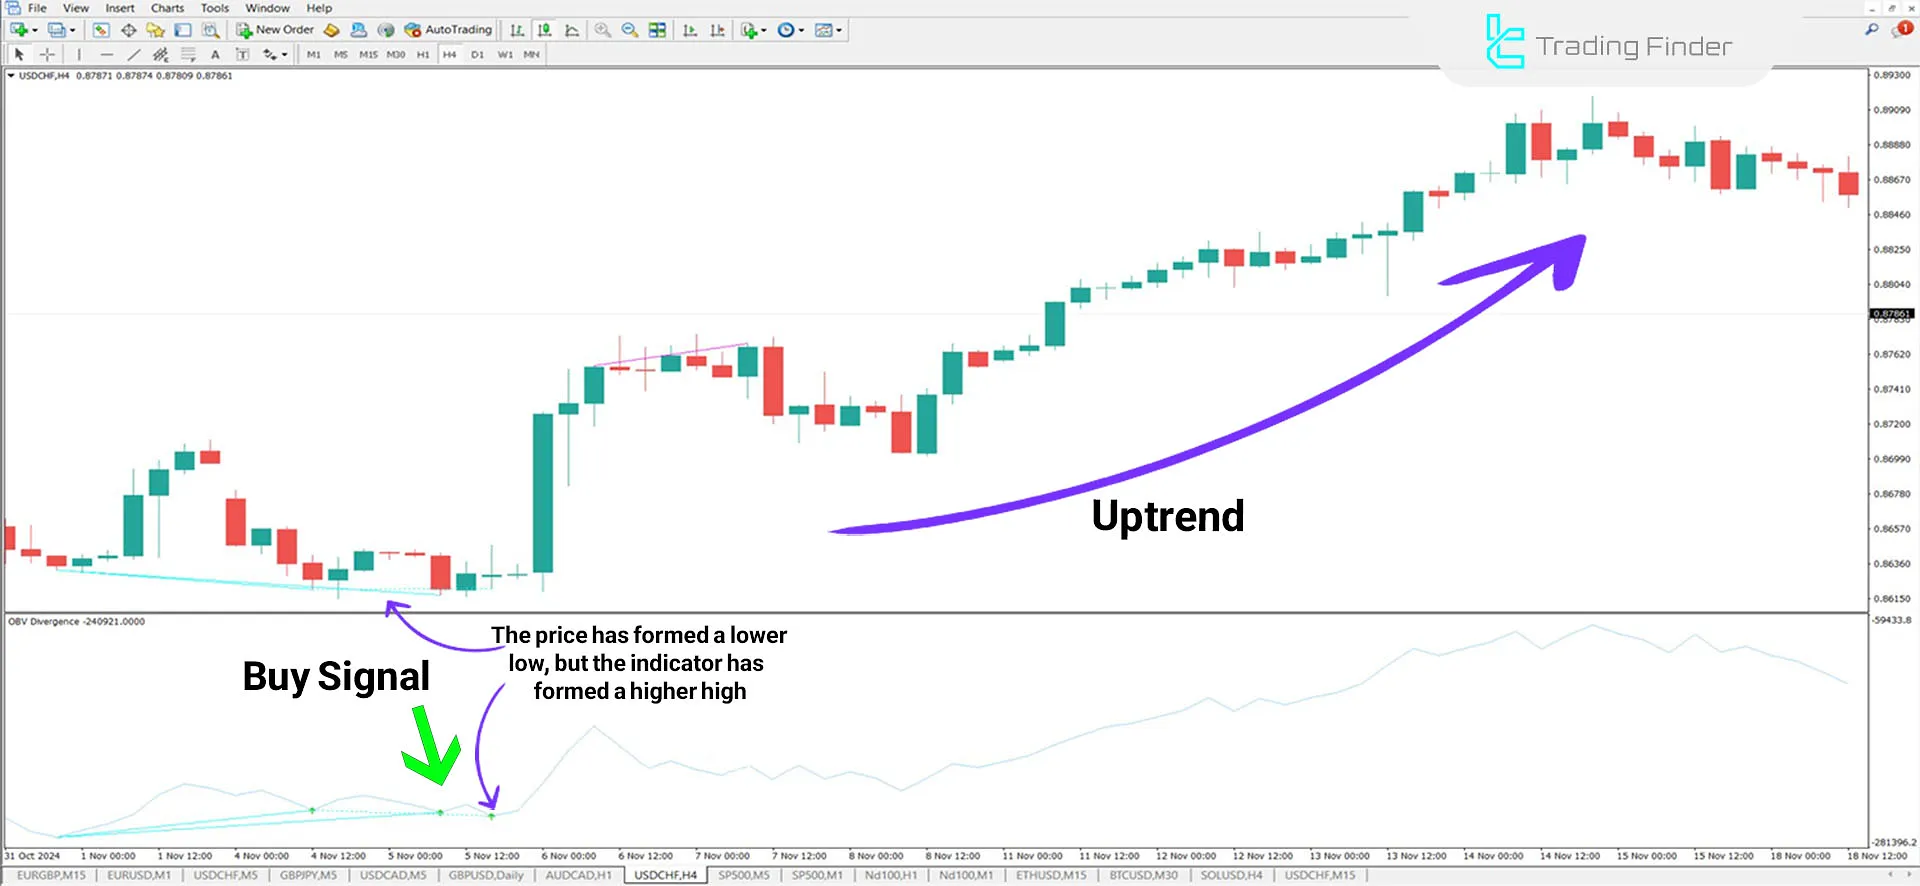
When the price declines but OBV rises, this could indicate a potential reversal to an uptrend.
The indicator highlights such zones by displaying a green arrow as a Buy Signal for traders.

Indicator in a Downtrend
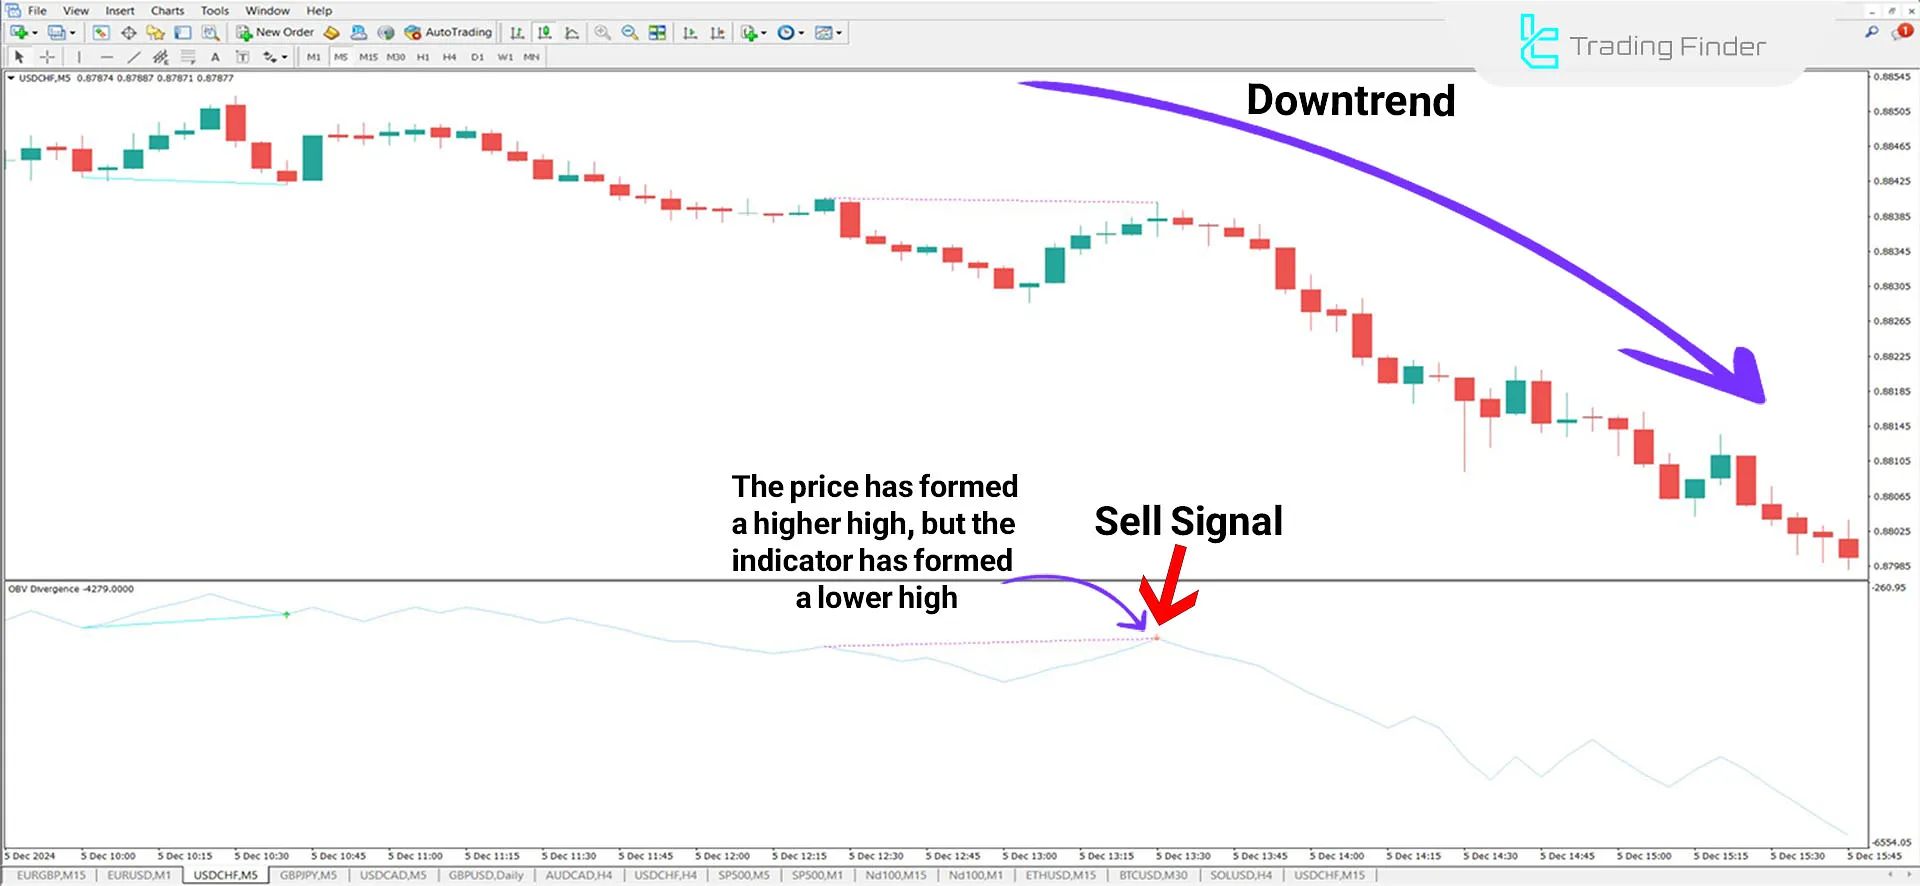
In the price chart for USD/CHF, when the Price is rising but OBV is declining, this could indicate a potential reversal to a downtrend.
Traders can enter a Sell trade after the indicator generates a red arrow signal, which is confirmed by additional validations.

OBV Indicator Settings
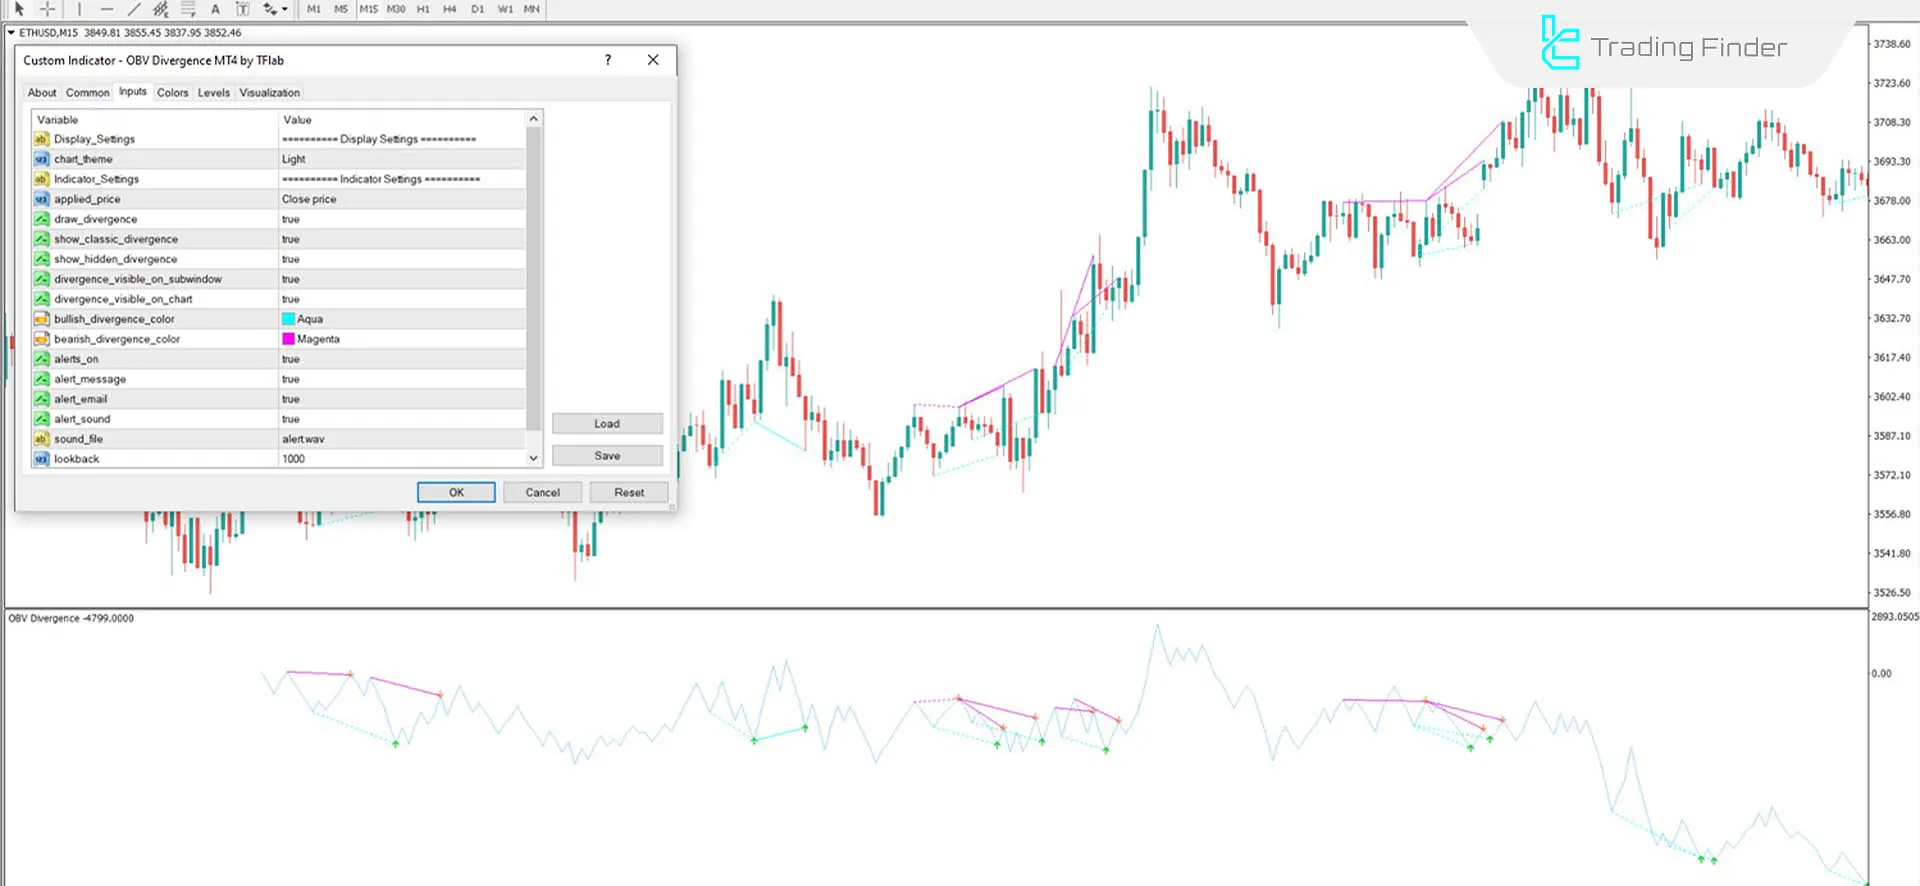
This image shows all the details related to the indicator settings:

- Chart Theme: Adjust the chart theme;
- Applied Price: Select the reference price (e.g., closing price) for indicator calculations;
- Draw Divergence Enable divergence lines on the chart;
- Show Classic Divergence Display classic divergences to identify standard trend changes;
- Show Hidden Divergence Display hidden divergences to uncover hidden trading opportunities;
- Divergence Visible On Subwindow Show divergences in the indicator's subwindow;
- Divergence Visible On Chart Display divergences directly on the price chart;
- Bullish Divergence Color: Choose the color for bullish divergence lines (typically light blue);
- Bearish Divergence Color: Choose the color for bearish divergence lines (typically pinkish purple);
- Alerts On Enable alerts when divergence signals are detected;
- Alert Message: Send alert messages upon signal occurrence;
- Alert Email: Send alerts to the user's registered email address;
- Alert Sound Activate sound alerts when Divergence is identified;
- Sound File: Select a specific sound file.
Conclusion
The OBV indicator, classified as one of the Signal & Forecast Indicators, evaluates buy/sell pressure by analyzing trading volume and price movement.
Additionally, it identifies hidden trends and divergences to determine optimal entry and exit points for trades.
On Balance Volume Divergence MT4 PDF
On Balance Volume Divergence MT4 PDF
Click to download On Balance Volume Divergence MT4 PDFWhat is the On Balance Volume Indicator?
The On Balance Volume (OBV) indicator combines trading volume and Price to identify trends and divergences.
Which time frames does the OBV indicator support?
OBV is a multi-timeframe tool that can be used in various time frames, such as 1-minute, 1-hour, or daily charts.


