![Order Block Indicator for ICT and Smart Money for MetaTrader 4 Download - Free - [TradingFinder]](https://cdn.tradingfinder.com/image/109067/11-44-en-order-block-mt4.webp)
![Order Block Indicator for ICT and Smart Money for MetaTrader 4 Download - Free - [TradingFinder] 0](https://cdn.tradingfinder.com/image/109067/11-44-en-order-block-mt4.webp)
![Order Block Indicator for ICT and Smart Money for MetaTrader 4 Download - Free - [TradingFinder] 1](https://cdn.tradingfinder.com/image/44451/11-02-en-order-block-mt4-03.avif)
![Order Block Indicator for ICT and Smart Money for MetaTrader 4 Download - Free - [TradingFinder] 2](https://cdn.tradingfinder.com/image/44450/11-02-en-order-block-mt4-04.avif)
![Order Block Indicator for ICT and Smart Money for MetaTrader 4 Download - Free - [TradingFinder] 3](https://cdn.tradingfinder.com/image/44447/11-02-en-order-block-mt4-02.avif)
The Order Block Indicator is a valuable tool for traders identifying key order blocks in the ICT and Smart Money trading styles on the Meta Trader 4 (MT4) platform.
The Order Block Indicator helps traders identify key price ranges where significant and impactful market orders are placed, allowing them to spot potential reversals or sensitive points in the market. Bullish order blocks are displayed in green, while bearish order blocks are shown in brown.
When the price reaches these zones, it often reacts, which can help traders determine entry and exit points.
Order Block Indicator Table
Indicator Categories: | ICT MT4 Indicators Smart Money MT4 Indicators Supply & Demand MT4 Indicators Currency Strength MT4 Indicators |
Platforms: | MetaTrader 4 Indicators |
Trading Skills: | Advanced |
Indicator Types: | Leading MT4 Indicators Reversal MT4 Indicators |
Timeframe: | Multi-Timeframe MT4 Indicators |
Trading Style: | Day Trading MT4 Indicators Intraday MT4 Indicators Scalper MT4 Indicators |
Trading Instruments: | Indices Market MT4 Indicators Commodity Market MT4 Indicators Forex MT4 Indicators |
Indicator at a Glance
The Order Block Indicator is a practical tool for identifying and detecting strong order blocks. It displays these order blocks on the chart as rectangles, with bullish blocks highlighted in green and bearish blocks in brown.
Traders can use this indicator to recognize order blocks, perform more precise analyses, and make smarter trading decisions.
Bullish Order Block (OB)

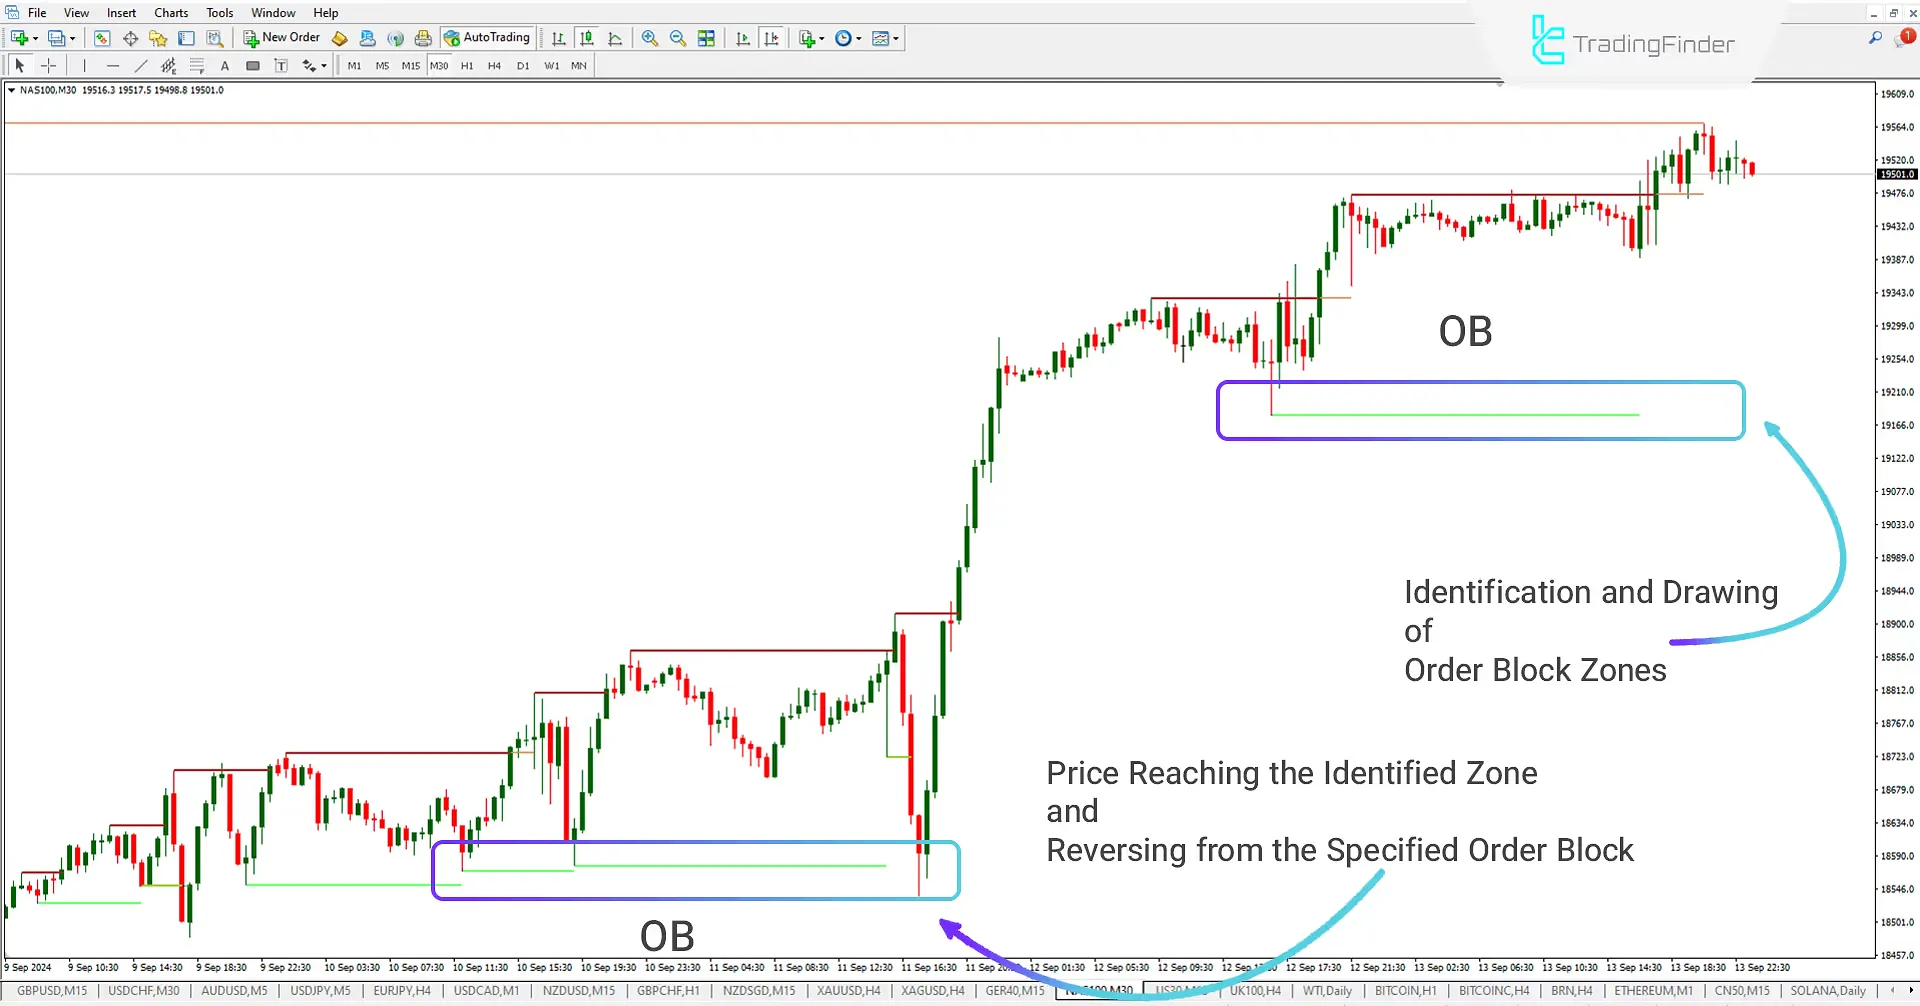
In the 30-minute NASDAQ chart, the Order Block Indicator identifies and marks bullish order blocks in green, highlighting critical and significant price points. When the price hits these essential blocks, it often shows a notable reaction.
In this example, after hitting the area at 18576.5, the price moves strongly upward due to the concentration of liquidity and large orders in this zone. These reactions help traders plan their entry opportunities and adjust their strategies more precisely.
Bearish Order Block (OB)

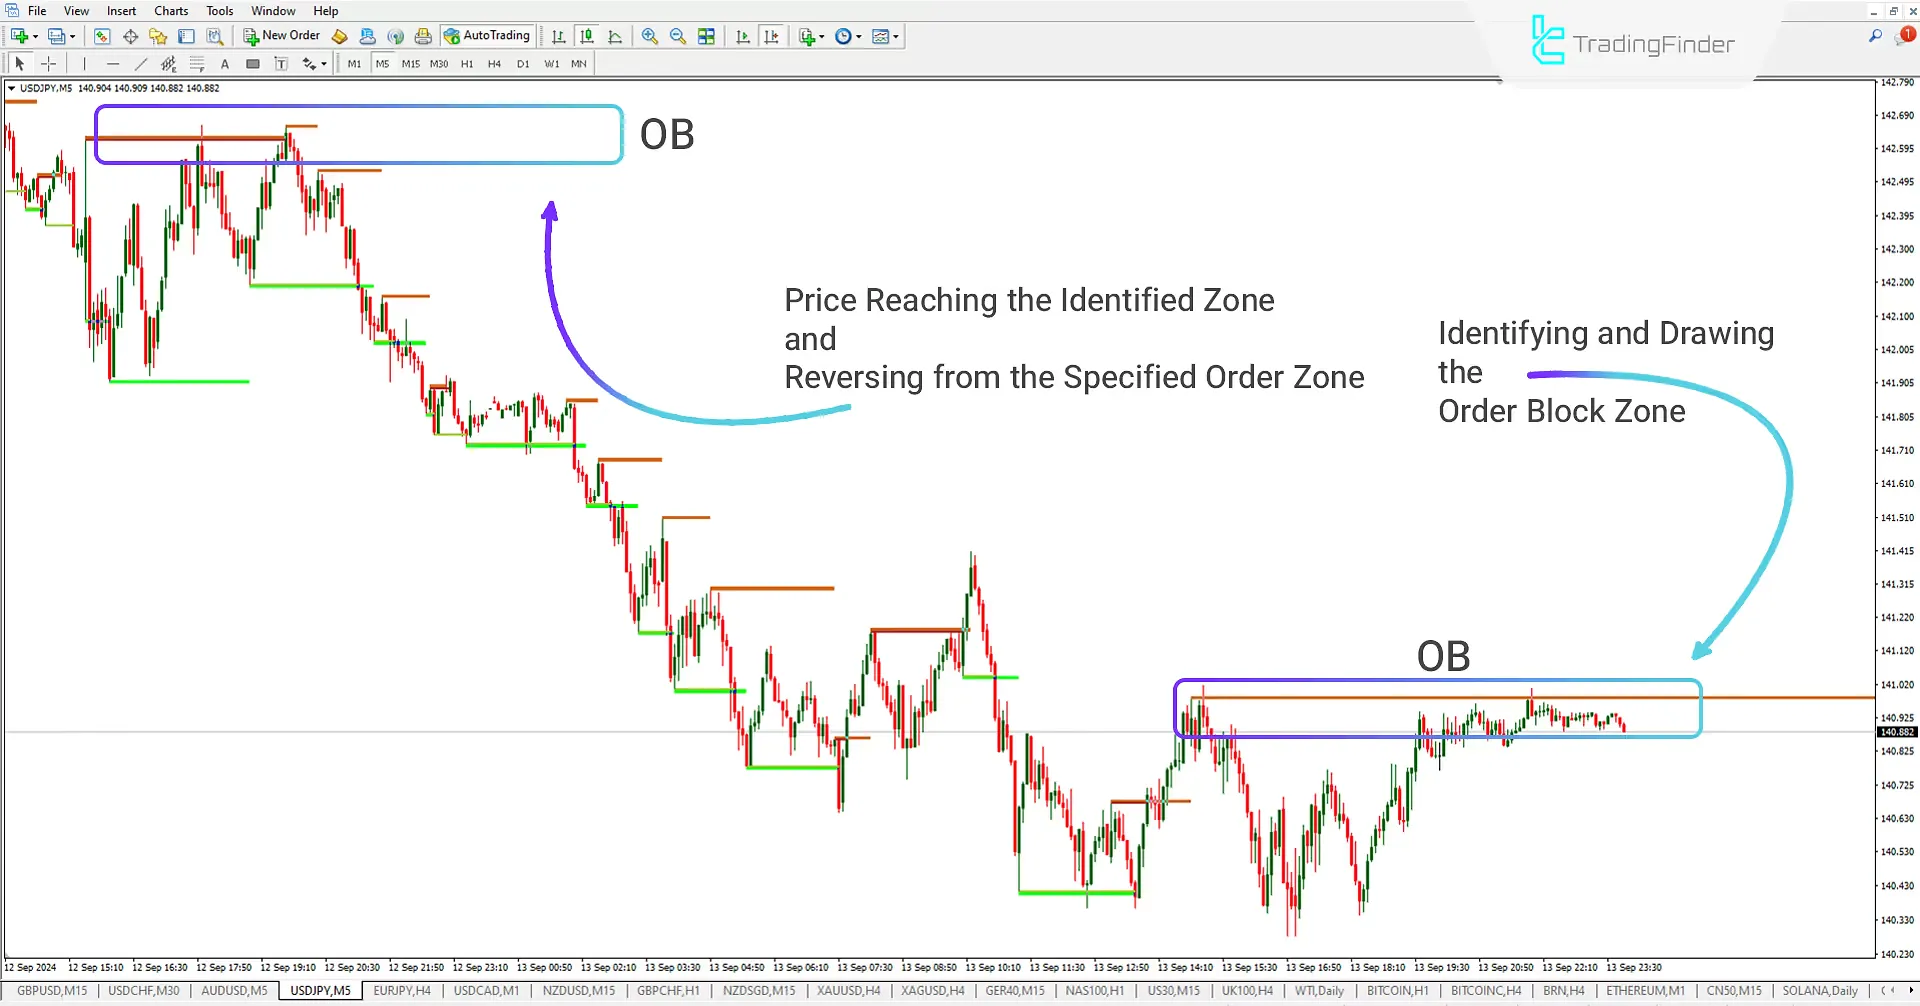
In the 5-minute USD/JPY chart, the Order Block Indicator identifies key bearish order points and marks significant price zones in brown. These zones, known as order blocks, indicate areas where large orders are placed.
In this example, upon reaching the 142.620 zone, a sharp price drop is observed, reflecting a strong market reaction to this significant price area. This analysis helps traders anticipate potential price reversals and sharp changes and manage their trades more accurately.
Order Block Indicator Settings

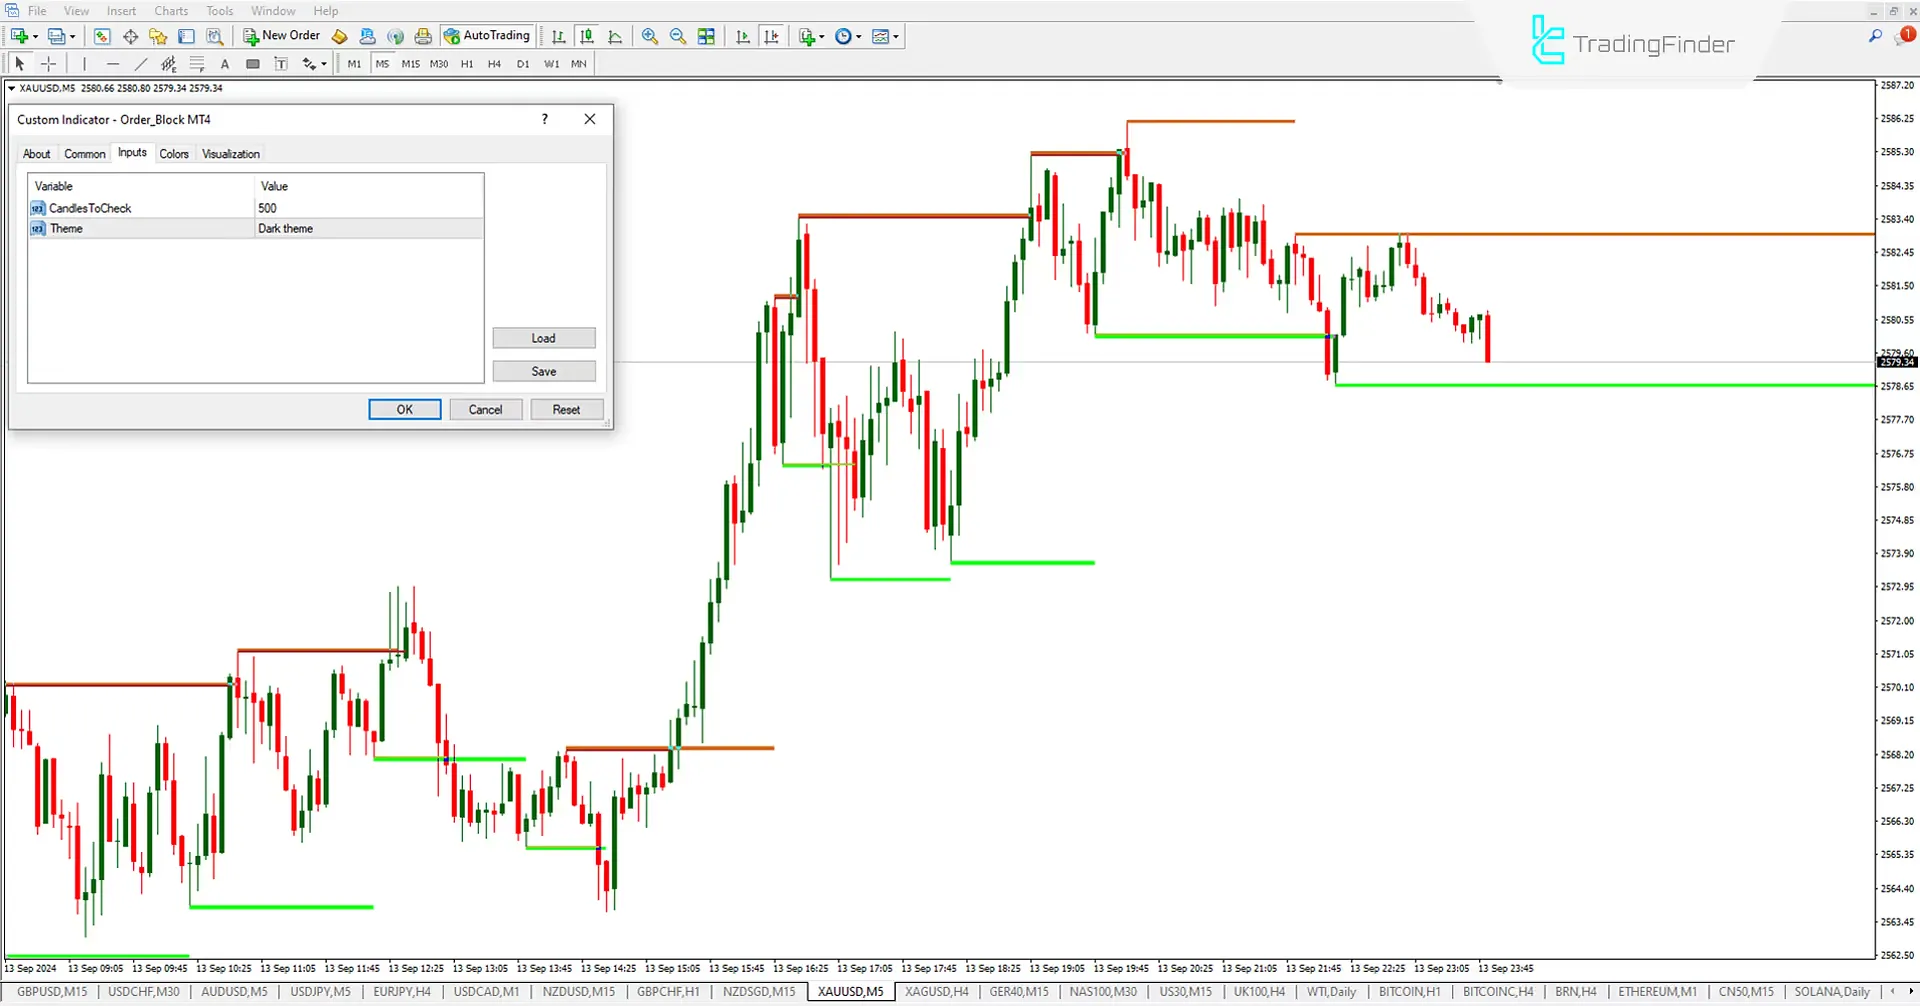
- Candles To Check: Set the number of candles to start the calculation from the past.
- Theme: The theme is based on two modes: Dark and Light.
Conclusion
The Order Block Indicator (OB Indicator) is a powerful tool for identifying important price zones in ICT and Smart Money styles. The OB Indicator identifies key points and displays bullish order blocks in green and bearish order blocks in brown.
Traders can use these zones to take advantage of trading opportunities. The OB Indicator continuously draws price zones until the price reaches these areas and reacts. This feature helps traders identify potential reversal or breakout zones and find suitable trading positions.
Order Block ICT Smart MT4 PDF
Order Block ICT Smart MT4 PDF
Click to download Order Block ICT Smart MT4 PDFWhat is the Order Block Indicator?
The Order Block Indicator is an analytical tool in financial markets used to identify significant price areas where large entities (such as banks or financial institutions) have made substantial buy or sell orders. These areas are usually market reversal points.
How does the Order Block Indicator work?
The Order Block Indicator analyzes price history to identify strong support and resistance areas where large changes in trading volume have occurred. These areas indicate where a price reaction is most likely to happen again.


