![Order Flow Trader Oscillator for MT4 Download – Free – [TradingFinder]](https://cdn.tradingfinder.com/image/394845/13-134-en-order-flow-trader-mt4-01.webp)
![Order Flow Trader Oscillator for MT4 Download – Free – [TradingFinder] 0](https://cdn.tradingfinder.com/image/394845/13-134-en-order-flow-trader-mt4-01.webp)
![Order Flow Trader Oscillator for MT4 Download – Free – [TradingFinder] 1](https://cdn.tradingfinder.com/image/394846/13-134-en-order-flow-trader-mt4-02.webp)
![Order Flow Trader Oscillator for MT4 Download – Free – [TradingFinder] 2](https://cdn.tradingfinder.com/image/394848/13-134-en-order-flow-trader-mt4-03.webp)
![Order Flow Trader Oscillator for MT4 Download – Free – [TradingFinder] 3](https://cdn.tradingfinder.com/image/394850/13-134-en-order-flow-trader-mt4-04.webp)
The Order Flow Trader Indicator is designed to analyze buy and sell order volumes. This oscillator gives users deeper insight into actual market conditions, beyond standard price charts.
This trading tool precisely tracks the volume increase or decrease in each candle through histograms and displays the data within the oscillator panel.
Order Flow Trader Oscillator Specifications Table
The technical specifications of the Order Flow Trader Indicator are outlined below.
Indicator Categories: | Oscillators MT4 Indicators Signal & Forecast MT4 Indicators Currency Strength MT4 Indicators Order Flow Indicators in MetaTrader 4 |
Platforms: | MetaTrader 4 Indicators |
Trading Skills: | Intermediate |
Indicator Types: | Reversal MT4 Indicators |
Timeframe: | Multi-Timeframe MT4 Indicators |
Trading Style: | Day Trading MT4 Indicators Scalper MT4 Indicators Swing Trading MT4 Indicators |
Trading Instruments: | Stock Market MT4 Indicators Cryptocurrency MT4 Indicators Forex MT4 Indicators Forward MT5 Indicators |
Order Flow Trader at a Glance
The Order Flow Trader Oscillator is a key tool in technical analysis. It helps traders identify optimal entry and exit points.
Histogram bars are formed as follows:
- Green Bar: Created when the current candle's volume is higher than the previous candle's volume
- Red Bar: Created when the current candle's volume is lower than the previous candle's volume
Bullish Trend Conditions
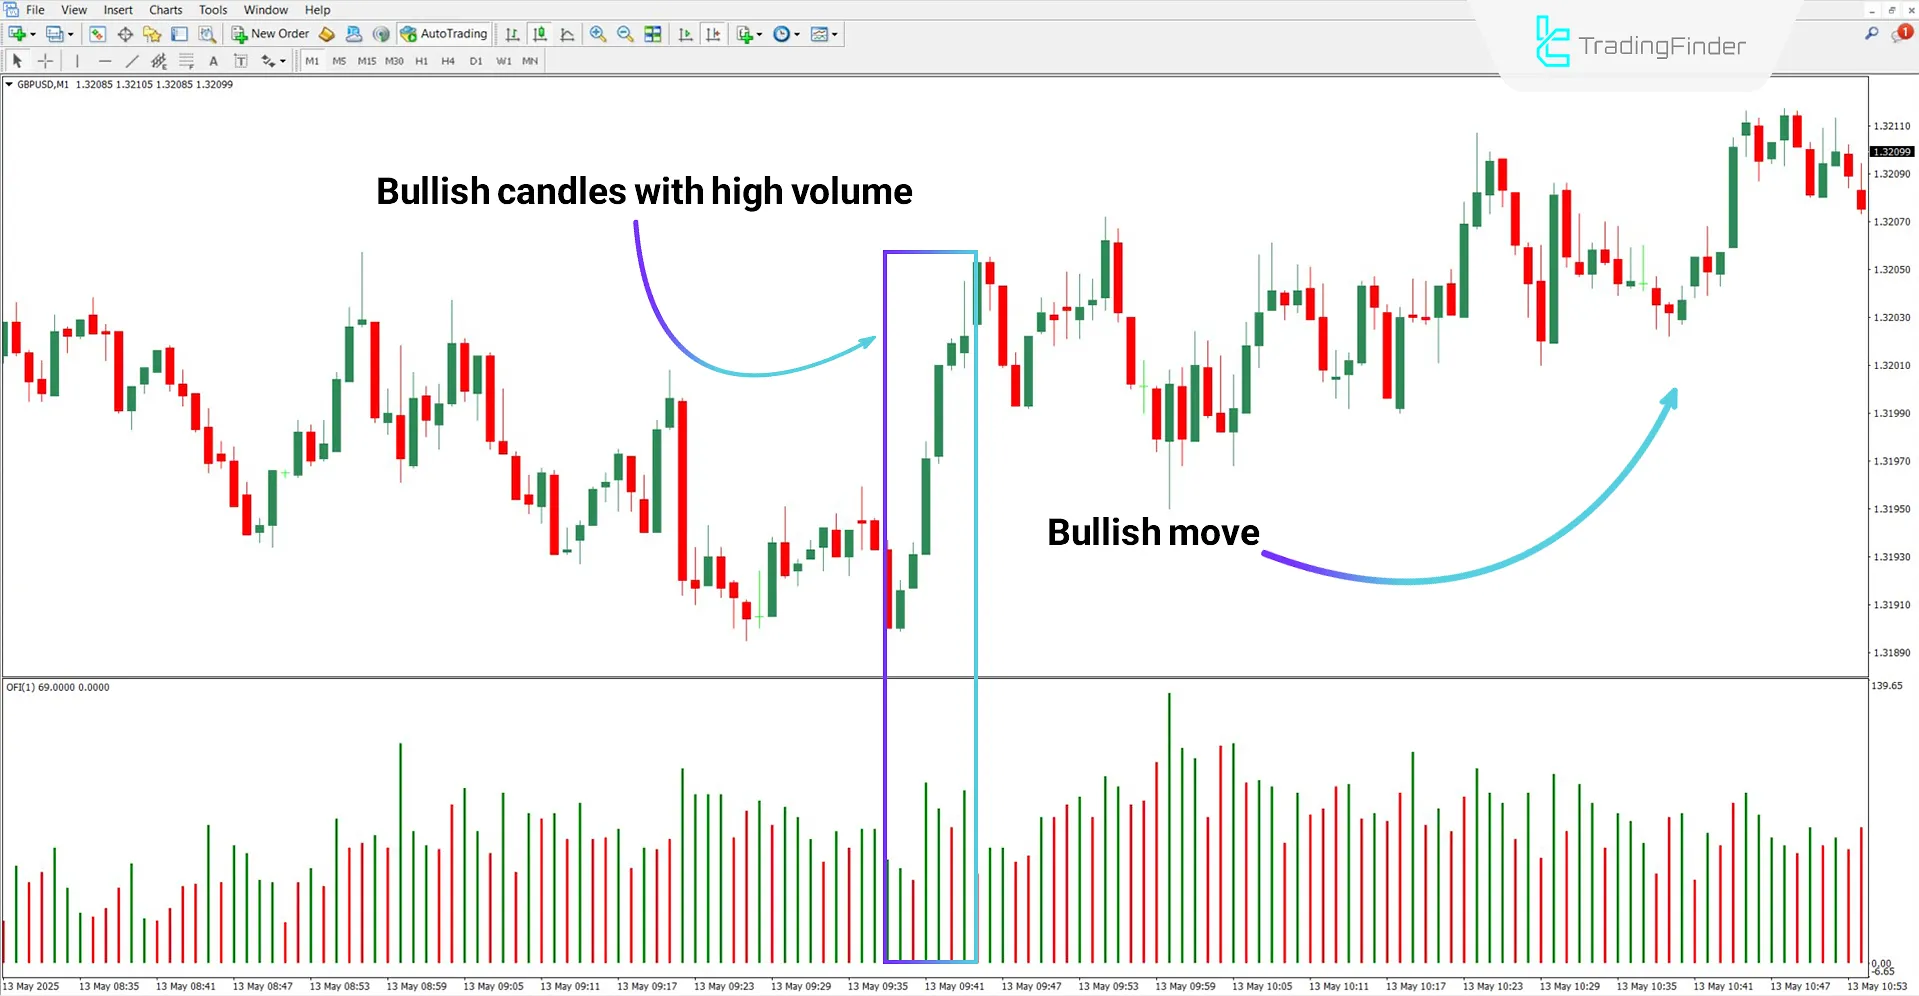
In the 1-minuteGBP/USD chart example, the Order Flow Trader Oscillator's performance in an upward trend is demonstrated. Green histograms beneath bullish candles confirm volume strength and buying pressure.

Bearish Trend Conditions
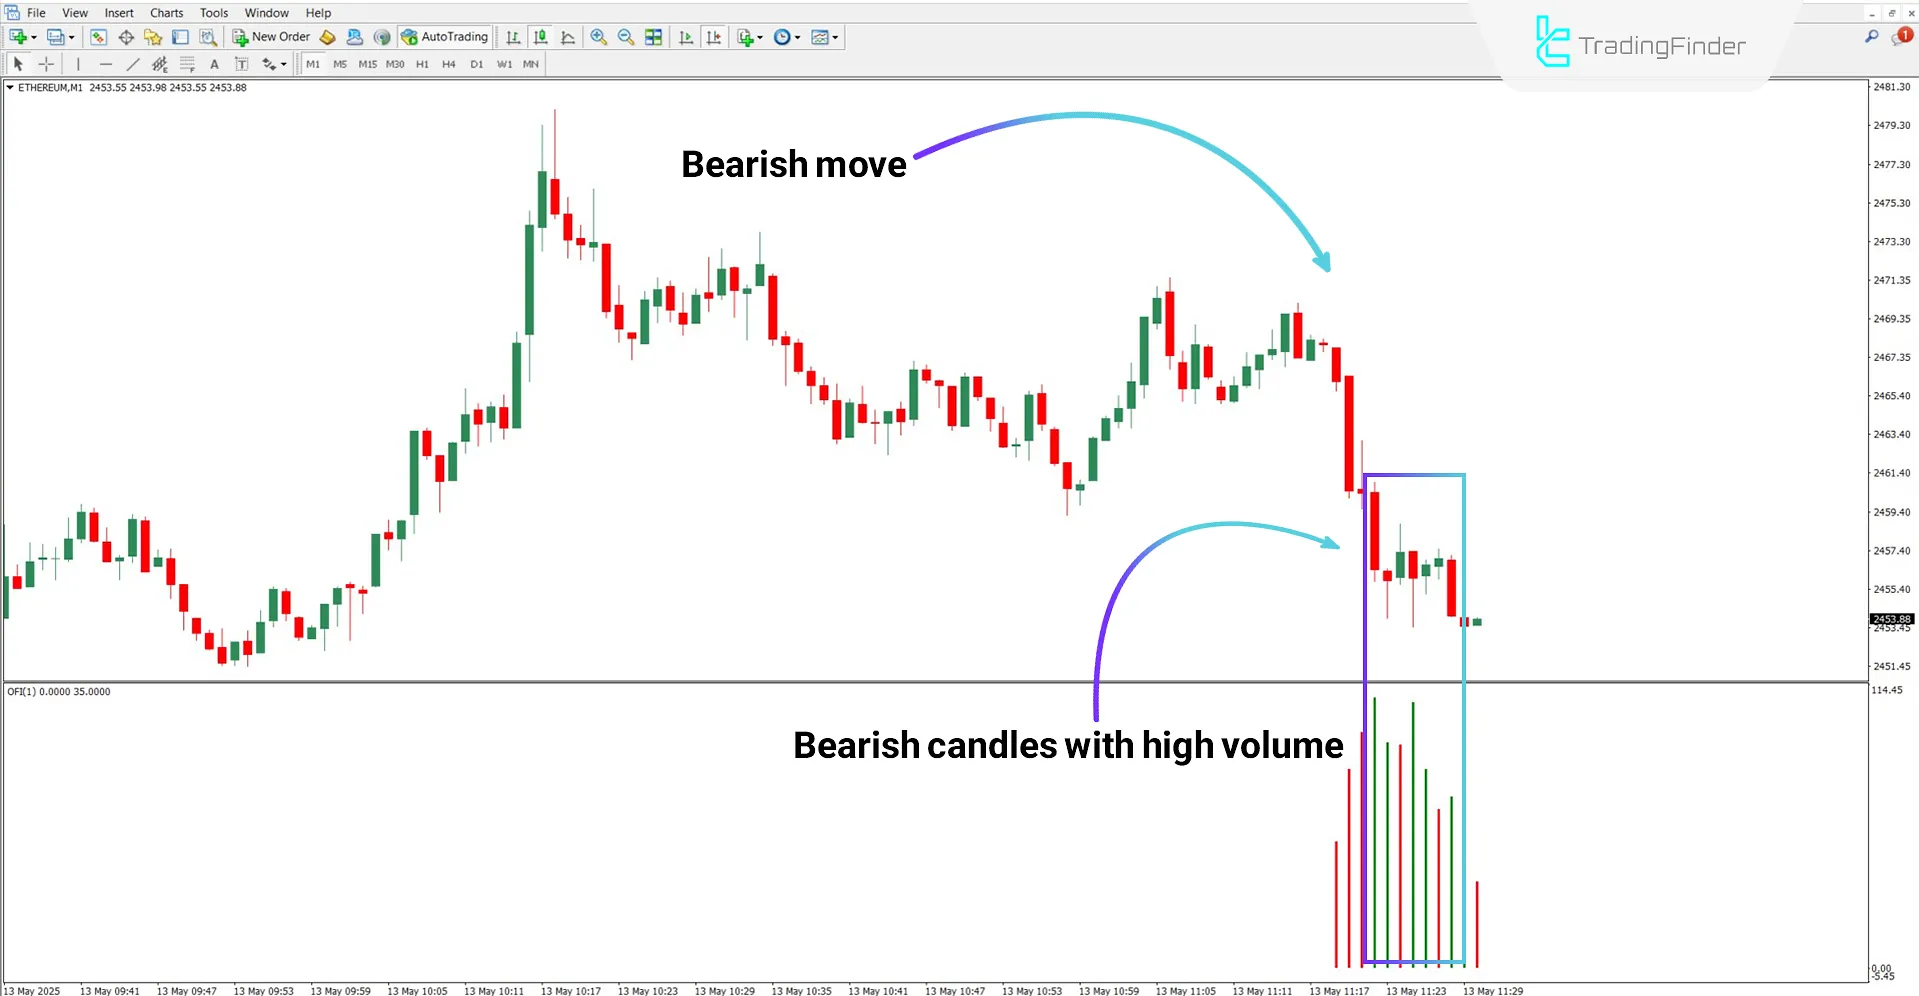
Based on the 1-minute chart analysis of the cryptocurrencyEthereum (ETH),green histograms below bearish candles indicate high volume and strong seller dominance.
Under such conditions, a sell position can be maintained until the volume of the bearishcandles changes.

Order Flow Trader Indicator Settings
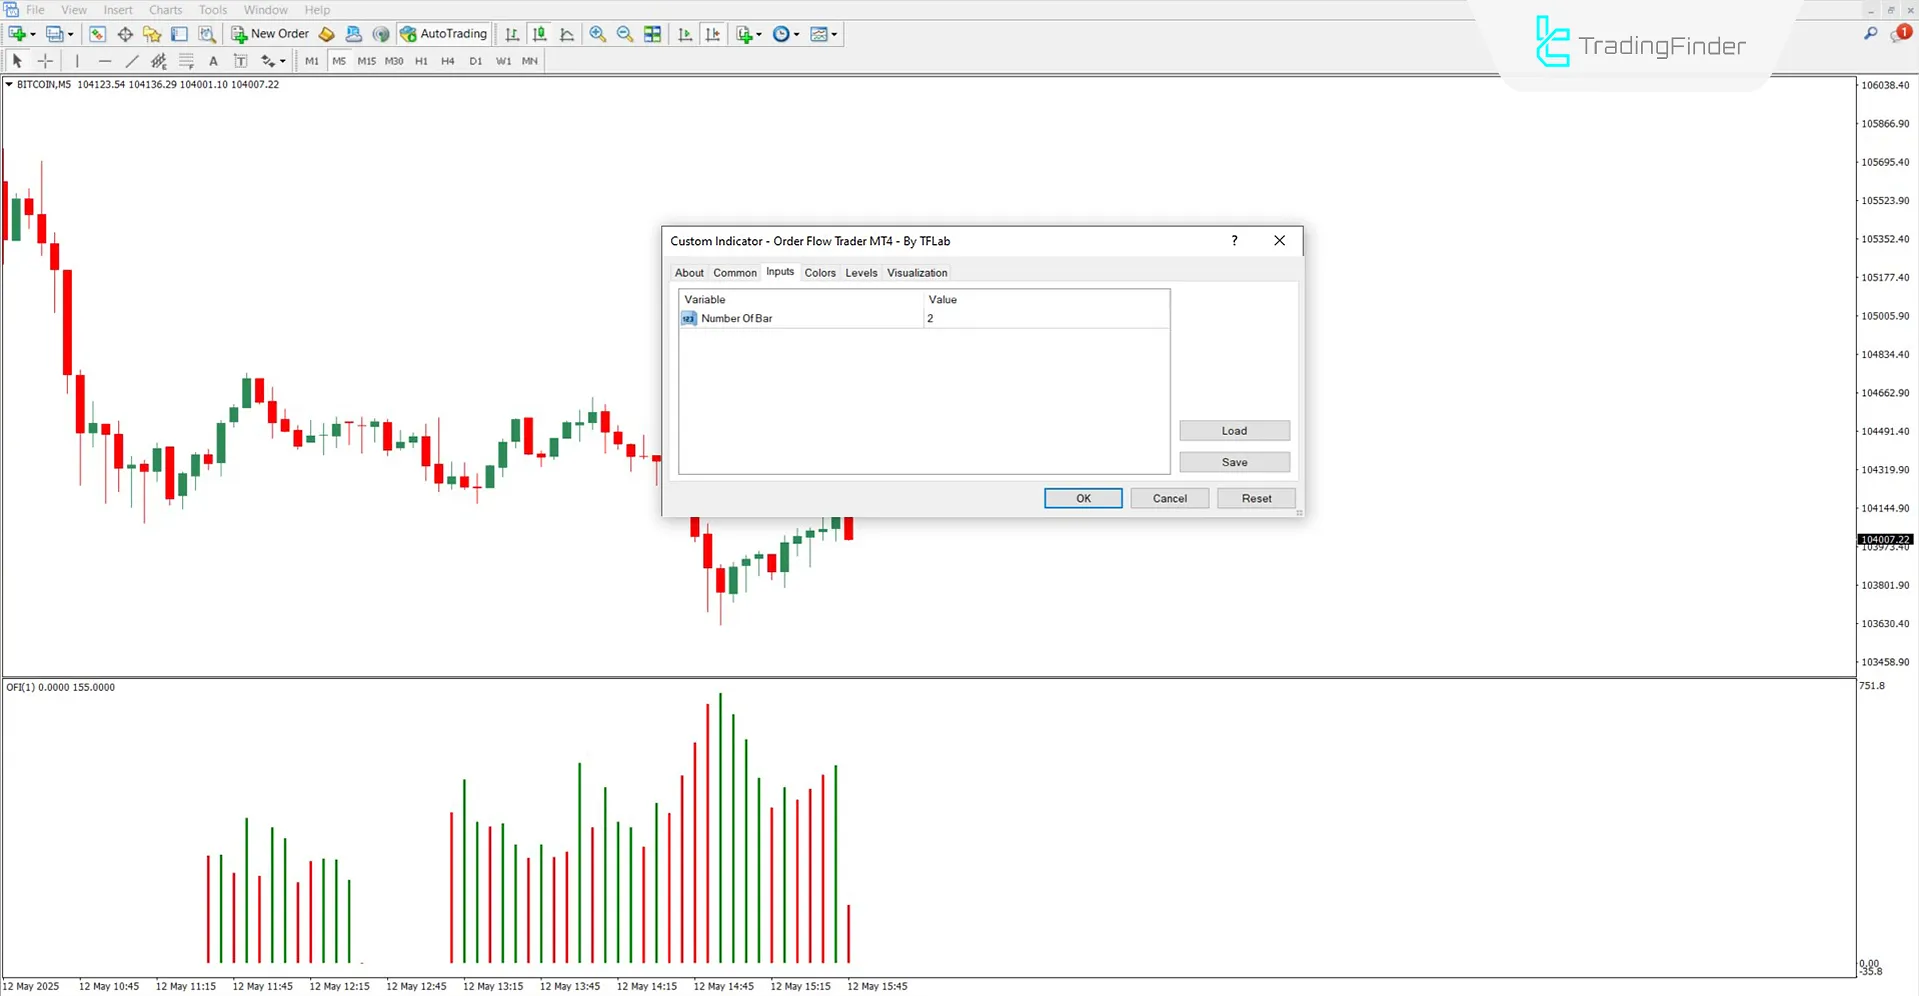
The image below shows the settings of the Order Flow Trader Indicator:

- Number of bars: Number of previous candles used for indicator calculations
Conclusion
TheOrder Flow Trader Indicator is built to display candle by candle volume in the MT4. It compares the current candle's volume with the previous one and visualizes the result using color coded histogram bars.
This indicator applies to all financial markets, including cryptocurrencies, forex, stock indices, and commodities.
Order Flow Trader Oscillator MT4 PDF
Order Flow Trader Oscillator MT4 PDF
Click to download Order Flow Trader Oscillator MT4 PDFWhat is the ideal timeframe for the Order Flow Trader Oscillator?
This tool can be used across all timeframes.
When is a green histogram bar formed?
A green bar is created whenever the current candle's volume exceeds the previous candle's.
Are there more meanings in the color of the bars? Some bars are red when its volume is higher than the previous bar. Some bars are green when its volume is lower than the previous bar.
Hello, please watch the video available on this page.


