![OsMA Divergence Indicator for MetaTrader 4 Download – Free – [TFlab]](https://cdn.tradingfinder.com/image/384425/4-83-en-osma-divergence-indicator-mt4-1.webp)
![OsMA Divergence Indicator for MetaTrader 4 Download – Free – [TFlab] 0](https://cdn.tradingfinder.com/image/384425/4-83-en-osma-divergence-indicator-mt4-1.webp)
![OsMA Divergence Indicator for MetaTrader 4 Download – Free – [TFlab] 1](https://cdn.tradingfinder.com/image/384415/4-83-en-osma-divergence-indicator-mt4-2.webp)
![OsMA Divergence Indicator for MetaTrader 4 Download – Free – [TFlab] 2](https://cdn.tradingfinder.com/image/384427/4-83-en-osma-divergence-indicator-mt4-3.webp)
![OsMA Divergence Indicator for MetaTrader 4 Download – Free – [TFlab] 3](https://cdn.tradingfinder.com/image/384428/4-83-en-osma-divergence-indicator-mt4-4.webp)
The OsMA Divergence Indicator automatically detects bullish and bearish divergences between price action and the OSMA oscillator and visualizes them graphically on the chart.
These divergences occur when price forms a new high or low, but the indicator does not confirm the move often signaling a potential trend reversal.
OsMA Divergence Indicator Specifications Table
The main features of the OsMA Divergence Oscillator are summarized in the table below.
Indicator Categories: | Oscillators MT4 Indicators Signal & Forecast MT4 Indicators Trading Assist MT4 Indicators |
Platforms: | MetaTrader 4 Indicators |
Trading Skills: | Intermediate |
Indicator Types: | Leading MT4 Indicators Reversal MT4 Indicators |
Timeframe: | Multi-Timeframe MT4 Indicators |
Trading Style: | Intraday MT4 Indicators |
Trading Instruments: | Forward Market MT4 Indicators Stock Market MT4 Indicators Cryptocurrency MT4 Indicators Forex MT4 Indicators |
Indicator at a Glance
The OsMA Divergence Oscillator compares price movement with the value of the OsMA indicator to detect both regular divergences automatically, and it clearly displays them on the chart using colored lines.
These divergences often form in sensitive market areas and can provide reliable signals for potential trend reversals.
Indicator in an Uptrend
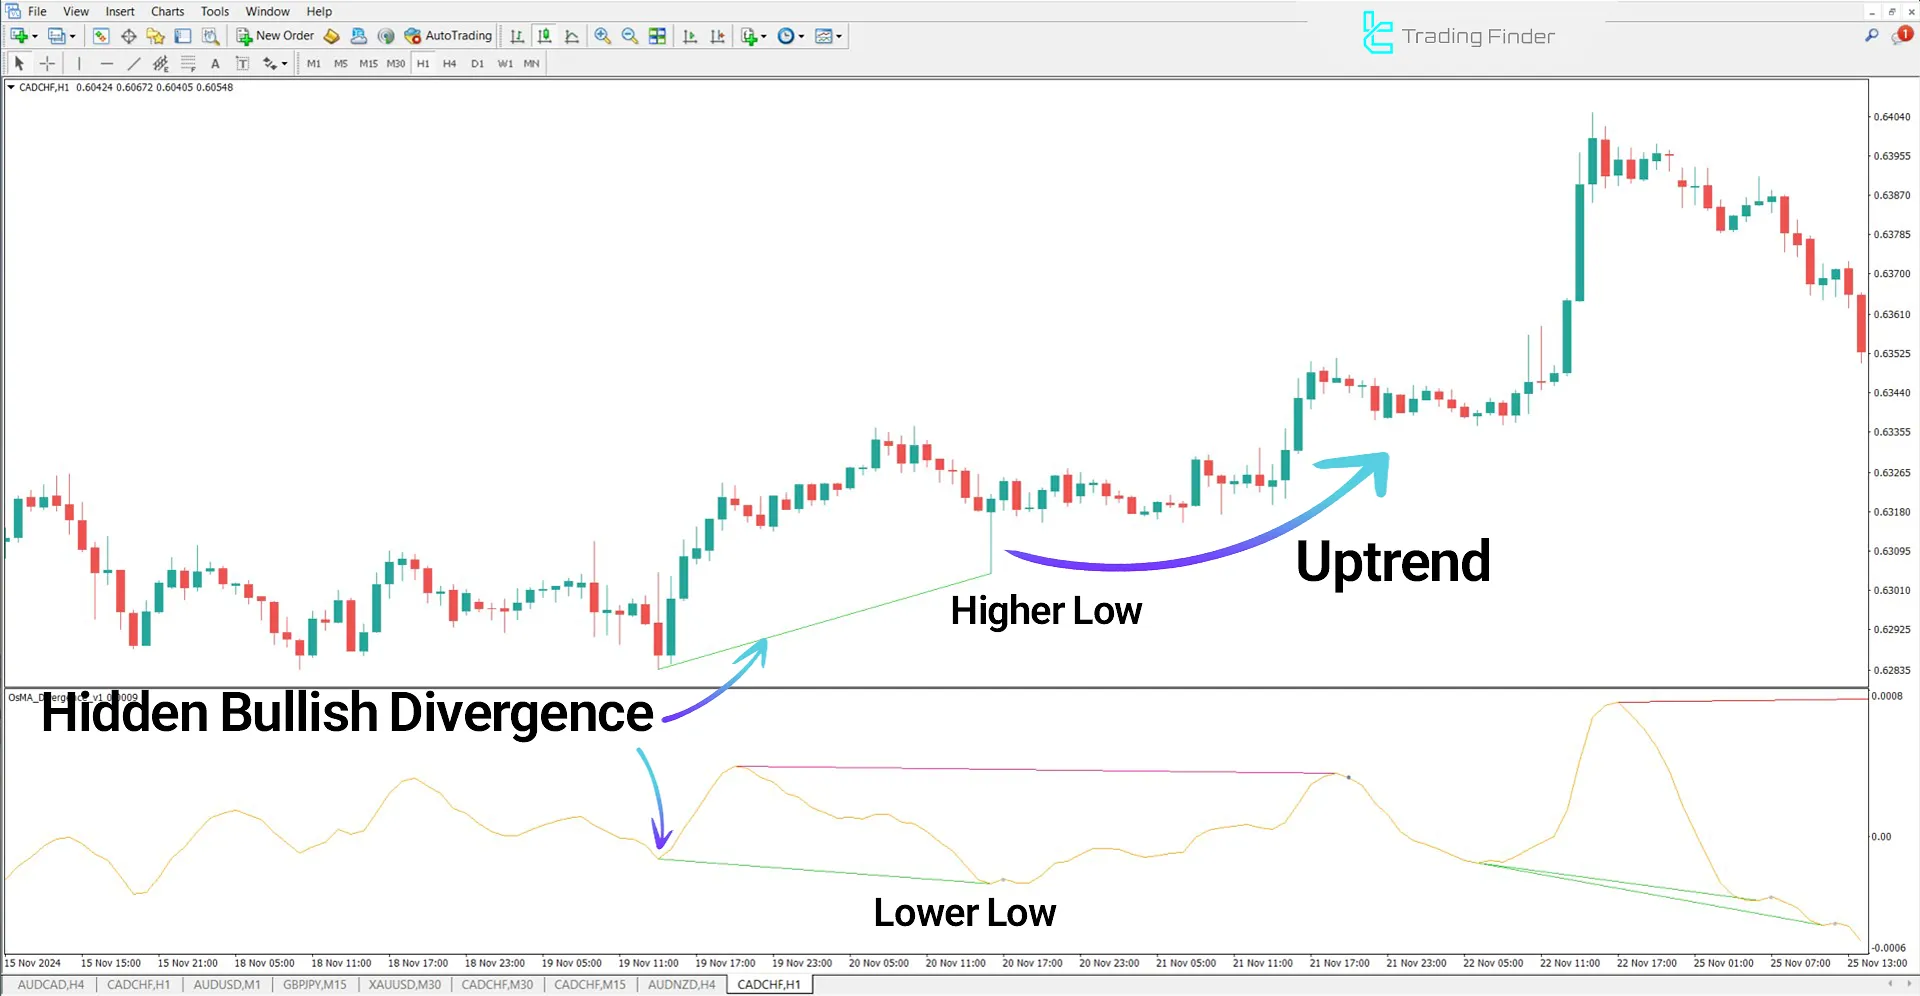
In the 1-hour chart of the CAD/CHF currency pair, the indicator detects a hidden bullish divergence, issuing a signal for the start of an uptrend.
This signal is illustrated by a green line shown on both the oscillator and price chart simultaneously, suggesting a likely reversal to the upside.

Indicator in a Downtrend
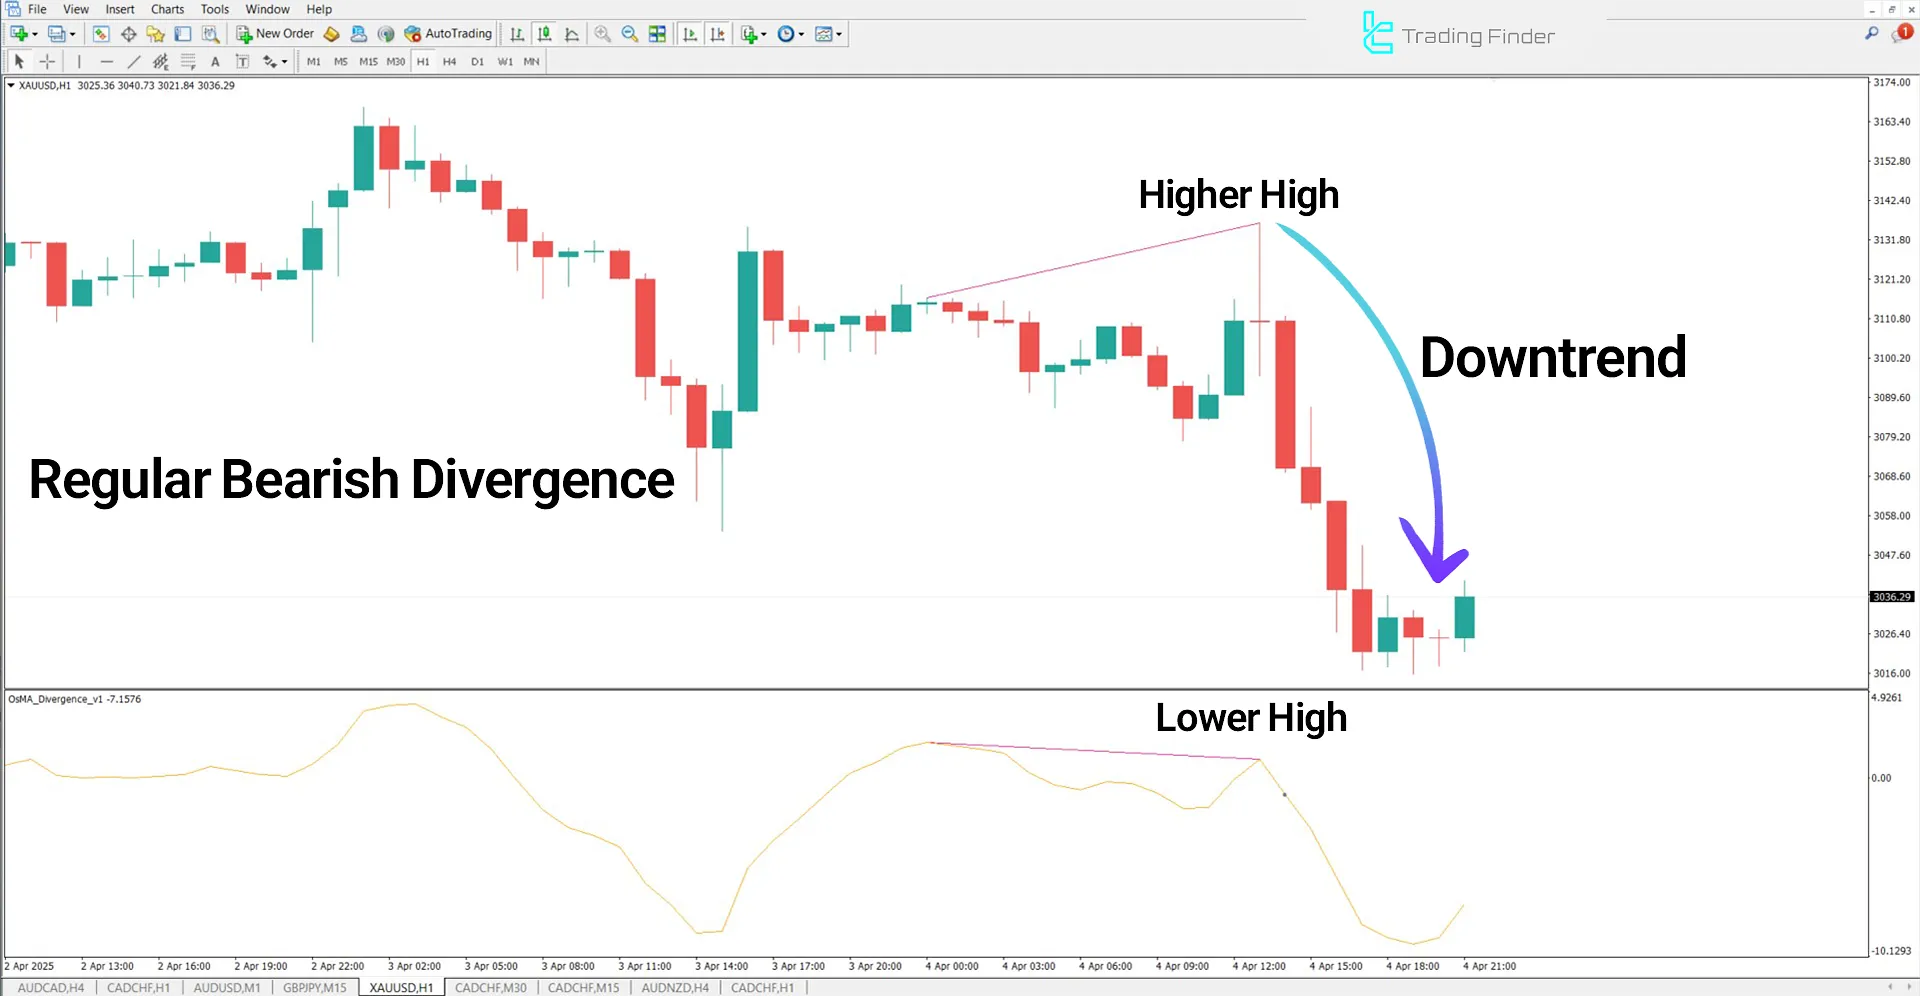
The following image shows the gold price chart in the 1-hour timeframe. The indicator identifies a regular bearish divergence between the price and the OsMA oscillator, and displays a pink line, indicating a possible trend continuation or start of a new downtrend.

OsMA Divergence Indicator Settings
The adjustable parameters of the OsMA Divergence Oscillator are shown in the image below:

- OsMAFast Period: Period for the fast moving average
- OsMASlow Period: Period for the slow moving average
- OsMASignal Period: Period for the signal line
- OsMA Price: Price calculation method for OsMA
- ExtrLeft Bars: Number of bars to extend to the left of the chart
- ExtrRight Bars: Number of bars to extend to the right of the chart
- Plus Sens: Positive sensitivity for trend direction
- Minus Sens: Negative sensitivity for opposite direction
- DrawLinesSW: Enable drawing of trend lines on chart
- DrawLinesCHW: Enable drawing of horizontal lines on chart
- Col_Peak_1: Color of first peak (highest point)
- Col_Peak_2: Color of second peak (second-highest point)
- Col_Trough_1: Color of first trough (lowest point)
- Col_Trough_2: Color of second trough (second-lowest point)
- Short Name: Short label for the indicator
Conclusion
The OsMA Divergence Indicator is a powerful analytical tool used to detect divergences and potential reversal points in the financial markets.
Since the signals are not repainted after formation, combining this indicator with key technical levels, candlestick patterns, and trend analysis can significantly strengthen trading strategies.
OsMA Divergence MT4 PDF
OsMA Divergence MT4 PDF
Click to download OsMA Divergence MT4 PDFWhat types of divergences does the OsMA Divergence Indicator detect?
The indicator can detect both regular and hidden divergences.
Does the OsMA Divergence Indicator automatically draw divergences on the chart?
Yes, the indicator automatically identifies divergences and displays them visually on the chart and oscillator using colored lines.


