![PAFX Secret Indicator for MetaTrader 4 Download - Free - [TFlab]](https://cdn.tradingfinder.com/image/153083/4-22-en-pafx-secret-mt4-1.webp)
![PAFX Secret Indicator for MetaTrader 4 Download - Free - [TFlab] 0](https://cdn.tradingfinder.com/image/153083/4-22-en-pafx-secret-mt4-1.webp)
![PAFX Secret Indicator for MetaTrader 4 Download - Free - [TFlab] 1](https://cdn.tradingfinder.com/image/153062/4-22-en-pafx-secret-mt4-2.webp)
![PAFX Secret Indicator for MetaTrader 4 Download - Free - [TFlab] 2](https://cdn.tradingfinder.com/image/153061/4-22-en-pafx-secret-mt4-3.webp)
![PAFX Secret Indicator for MetaTrader 4 Download - Free - [TFlab] 3](https://cdn.tradingfinder.com/image/153050/4-22-en-pafx-secret-mt4-4.webp)
The PAFX Secret Indicator, among MetaTrader 4 indicators, is designed to identify market trends and divergences. This indicator combines six well-known oscillators, including Momentum, CCI, RSI, Stochastic, MACD, and AO, to assist in detecting chart divergences effectively.
Indicator Table
Indicator Categories: | Price Action MT4 Indicators Oscillators MT4 Indicators Trading Assist MT4 Indicators |
Platforms: | MetaTrader 4 Indicators |
Trading Skills: | Intermediate |
Indicator Types: | Trend MT4 Indicators Reversal MT4 Indicators |
Timeframe: | Multi-Timeframe MT4 Indicators |
Trading Style: | Intraday MT4 Indicators |
Trading Instruments: | Share Stocks MT4 Indicators Forward Market MT4 Indicators Stock Market MT4 Indicators Cryptocurrency MT4 Indicators Forex MT4 Indicators |
Indicator Overview
Price divergence occurs when the movement of the price and the technical oscillator are not aligned, moving in opposite directions. This phenomenon highlights a potential weakness in the prevailing trend, signaling to traders that the price may soon reverse its current direction and shift to an opposite trend.
In the PAFX Secret indicator, divergences are visually distinguished by color: negative divergences are marked in blue, while positive divergences are highlighted in red, making it easier for traders to identify and act on these signals.
Bullish Trend Example
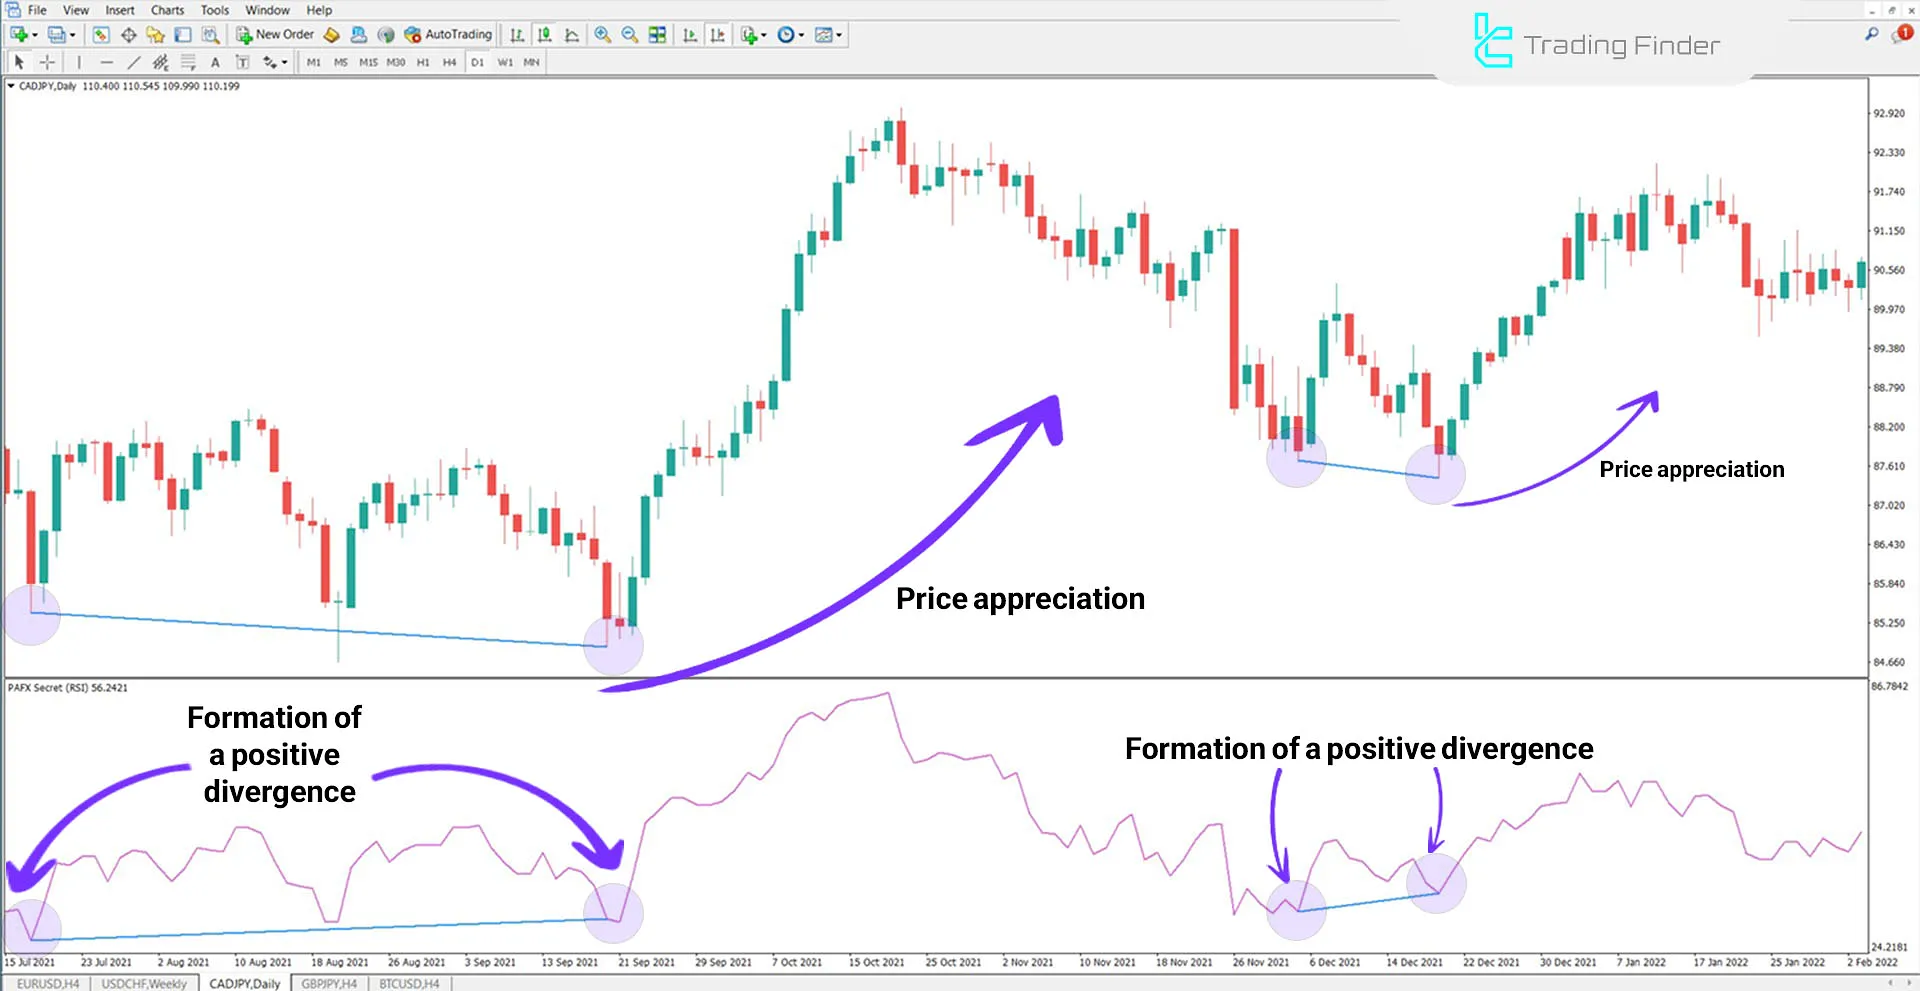
Two positive divergences have formed on the daily chart of the CAD/JPY currency pair. In this case, the new price low is lower than the previous one, but on the indicator, the new low is higher than the previous one. Traders can enter a buy trade after receiving final confirmations based on their trading strategy.

Bearish Trend Example
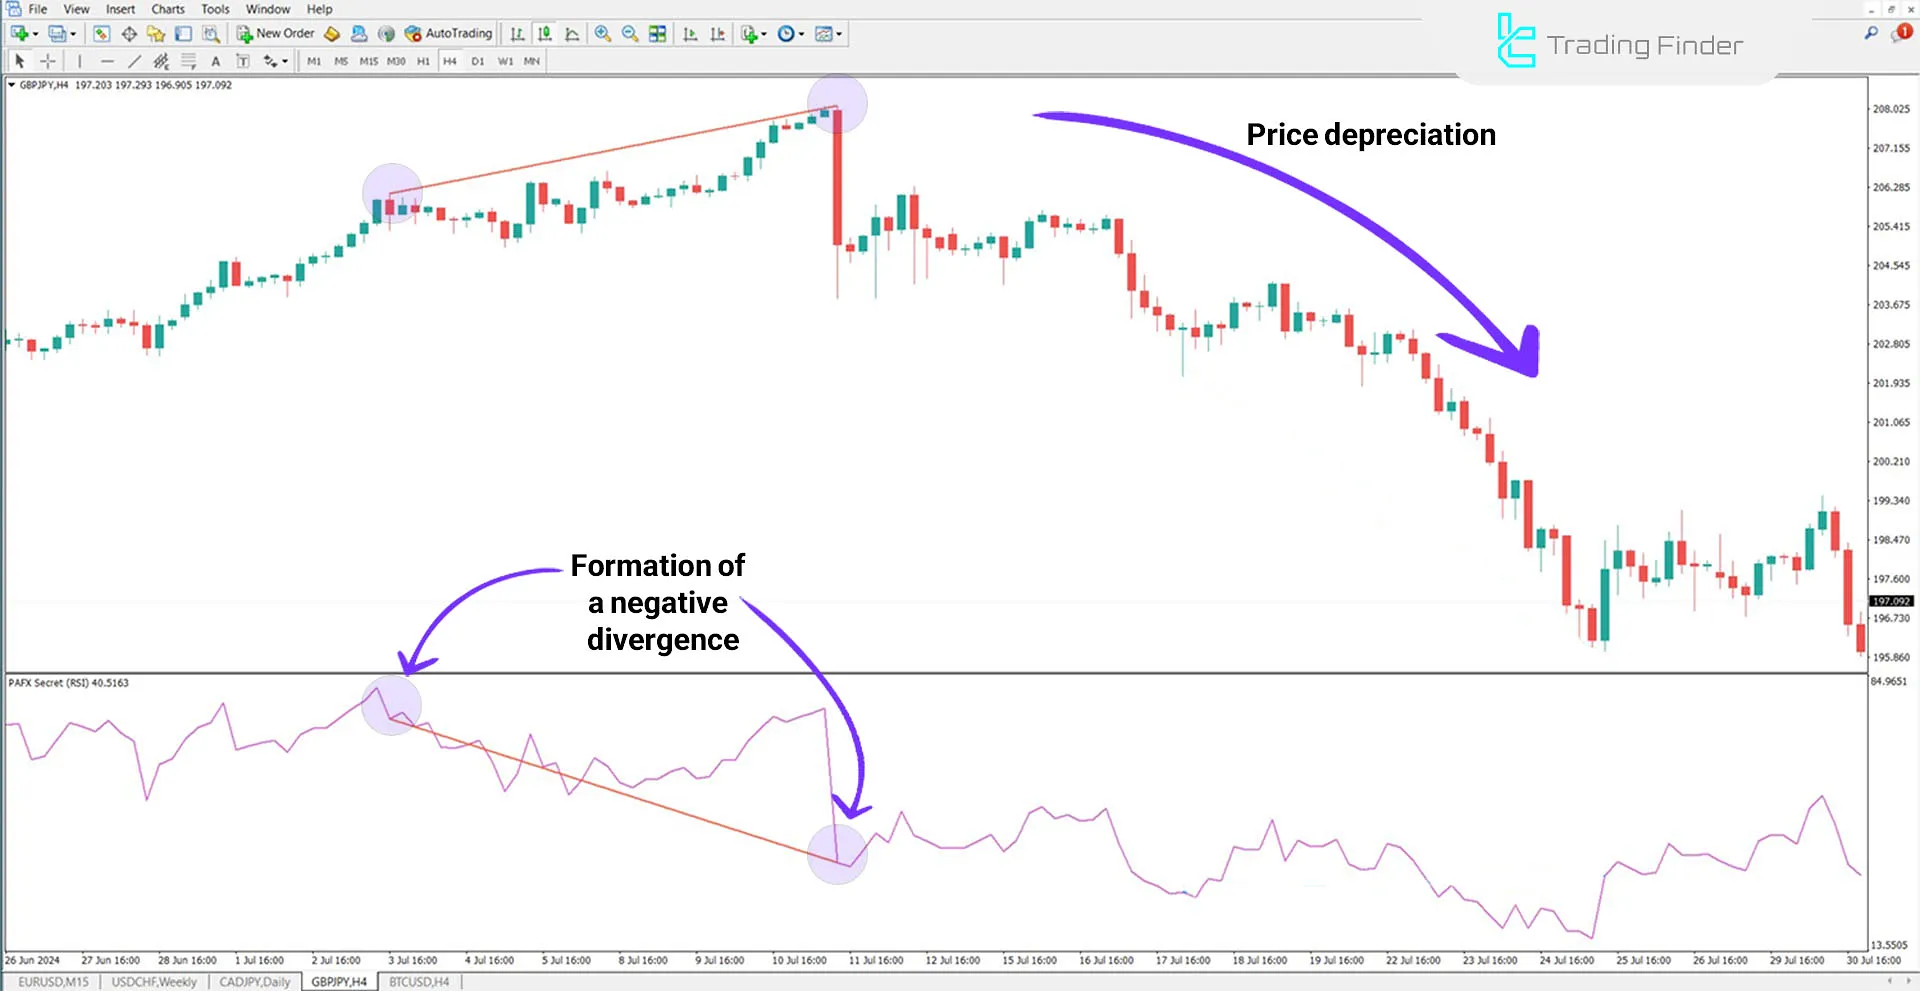
A negative divergence is observed on the 4-hour chart of the GBP/JPY currency pair. Following this divergence, the price formed a new high lower than the previous high, while on the indicator, the new high is higher than the previous high.
This scenario may indicate a weakness in the bullish trend, and traders might consider this a potential sell signal, depending on their strategies.

Indicator Settings

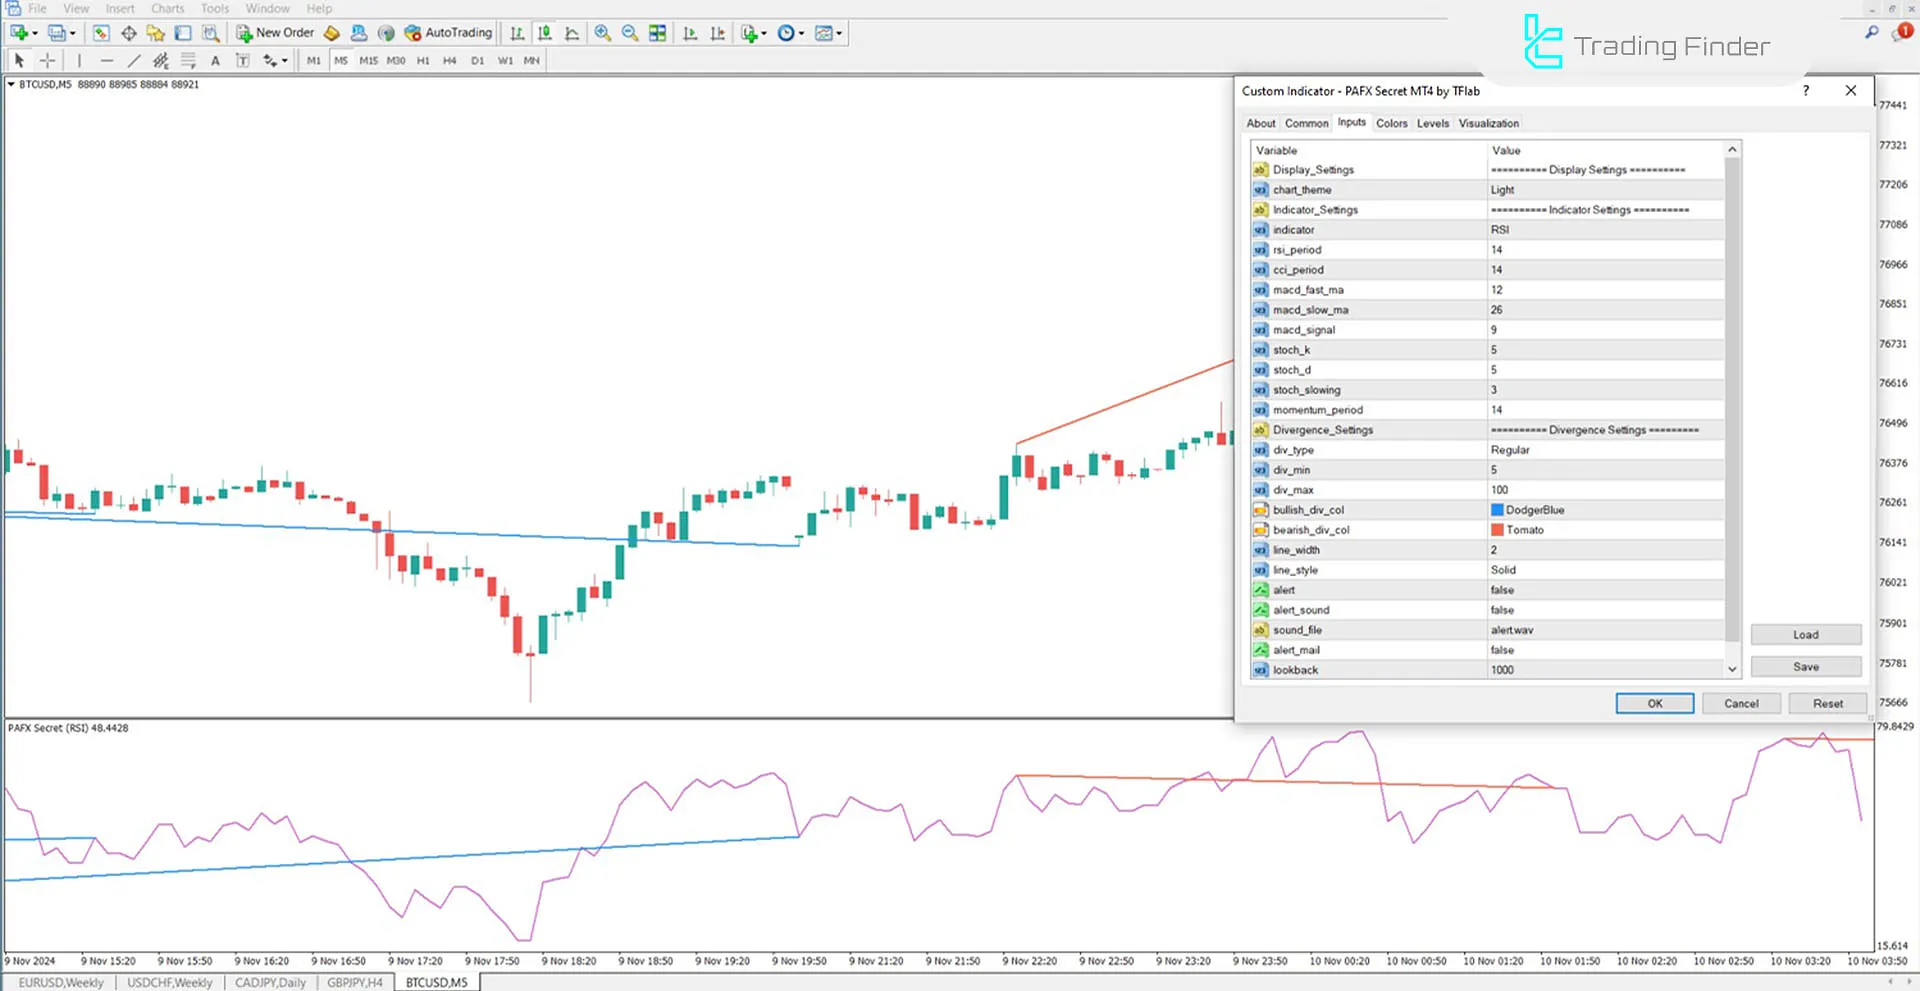
- Chart Theme: Background color of the chart;
- Indicator: Type of indicator, including MOMENTUM, CCI, RSI, and MACD (default: RSI);
- RSI Period: Calculation period for RSI (default: 14);
- CCI Period: Calculation period for CCI (default: 14);
- MACD Fast Ma: Fast MA calculation for MACD (default: 12);
- MACD Slow Ma: Slow MA calculation for MACD (default: 26);
- MACD Signal: Number of MACD signals (default: 9);
- Stoch K: Stochastic K parameter (default: 5);
- Stoch D: Stochastic D parameter (default: 5);
- Stoch Slowing: Stochastic slowing parameter (default: 3);
- Momentum Period: Calculation period for Momentum (default: 14);
- Div Type: Divergence display type (default: Regular);
- Div Min: Minimum number of candles for divergence calculation (default: 5);
- Div Max: Maximum number of candles for divergence calculation (default: 100);
- Line Width: Width of divergence lines (default: 2);
- Line Style: Divergence line style (default: Solid);
- Alert: Alerts when a divergence is detected;
- Alert Sound: Type of sound for alerts;
- Alert Mail: Email notification when divergence occurs;
- Lookback: Number of candles calculated in the indicator window.
Conclusion
Divergences are one of the key elements in technical analysis, helping traders identify the likelihood of a trend reversal in price movements.
In this MetaTrader 4 oscillator, positive divergence occurs when the price declines, but the indicator moves upward, signaling a potential trend reversal. Conversely, negative divergence forms when the price is rising, but the indicator trends downward, indicating possible weakness in the uptrend.
PAFX Secret MT4 PDF
PAFX Secret MT4 PDF
Click to download PAFX Secret MT4 PDFWhat is the PAFX Secret Indicator, and what is it used for?
The PAFX Secret Indicator is designed for the MetaTrader 4 platform, combining well-known indicators like Momentum, CCI, RSI, and MACD. Its main goal is to identify divergences and assist traders in detecting potential trend changes.
How are divergences displayed in this indicator?
Positive divergences are displayed in red, and negative divergences are shown in blue, making it easier for traders to identify buy and sell signals.


