![Parabolic SAR Color Alert Indicator for MT4 Download – Free – [TradingFinder]](https://cdn.tradingfinder.com/image/504917/13-190-en-parabolic-sar-color-alert-mt4-01.webp)
![Parabolic SAR Color Alert Indicator for MT4 Download – Free – [TradingFinder] 0](https://cdn.tradingfinder.com/image/504917/13-190-en-parabolic-sar-color-alert-mt4-01.webp)
![Parabolic SAR Color Alert Indicator for MT4 Download – Free – [TradingFinder] 1](https://cdn.tradingfinder.com/image/504914/13-190-en-parabolic-sar-color-alert-mt4-02.webp)
![Parabolic SAR Color Alert Indicator for MT4 Download – Free – [TradingFinder] 2](https://cdn.tradingfinder.com/image/504908/13-190-en-parabolic-sar-color-alert-mt4-03.webp)
![Parabolic SAR Color Alert Indicator for MT4 Download – Free – [TradingFinder] 3](https://cdn.tradingfinder.com/image/504912/13-190-en-parabolic-sar-color-alert-mt4-04.webp)
The Parabolic SAR Color Alert Indicator uses colored dots to display the market trend direction. In this trading tool, colored dots appear above or below the candles to indicate the direction of price movement.
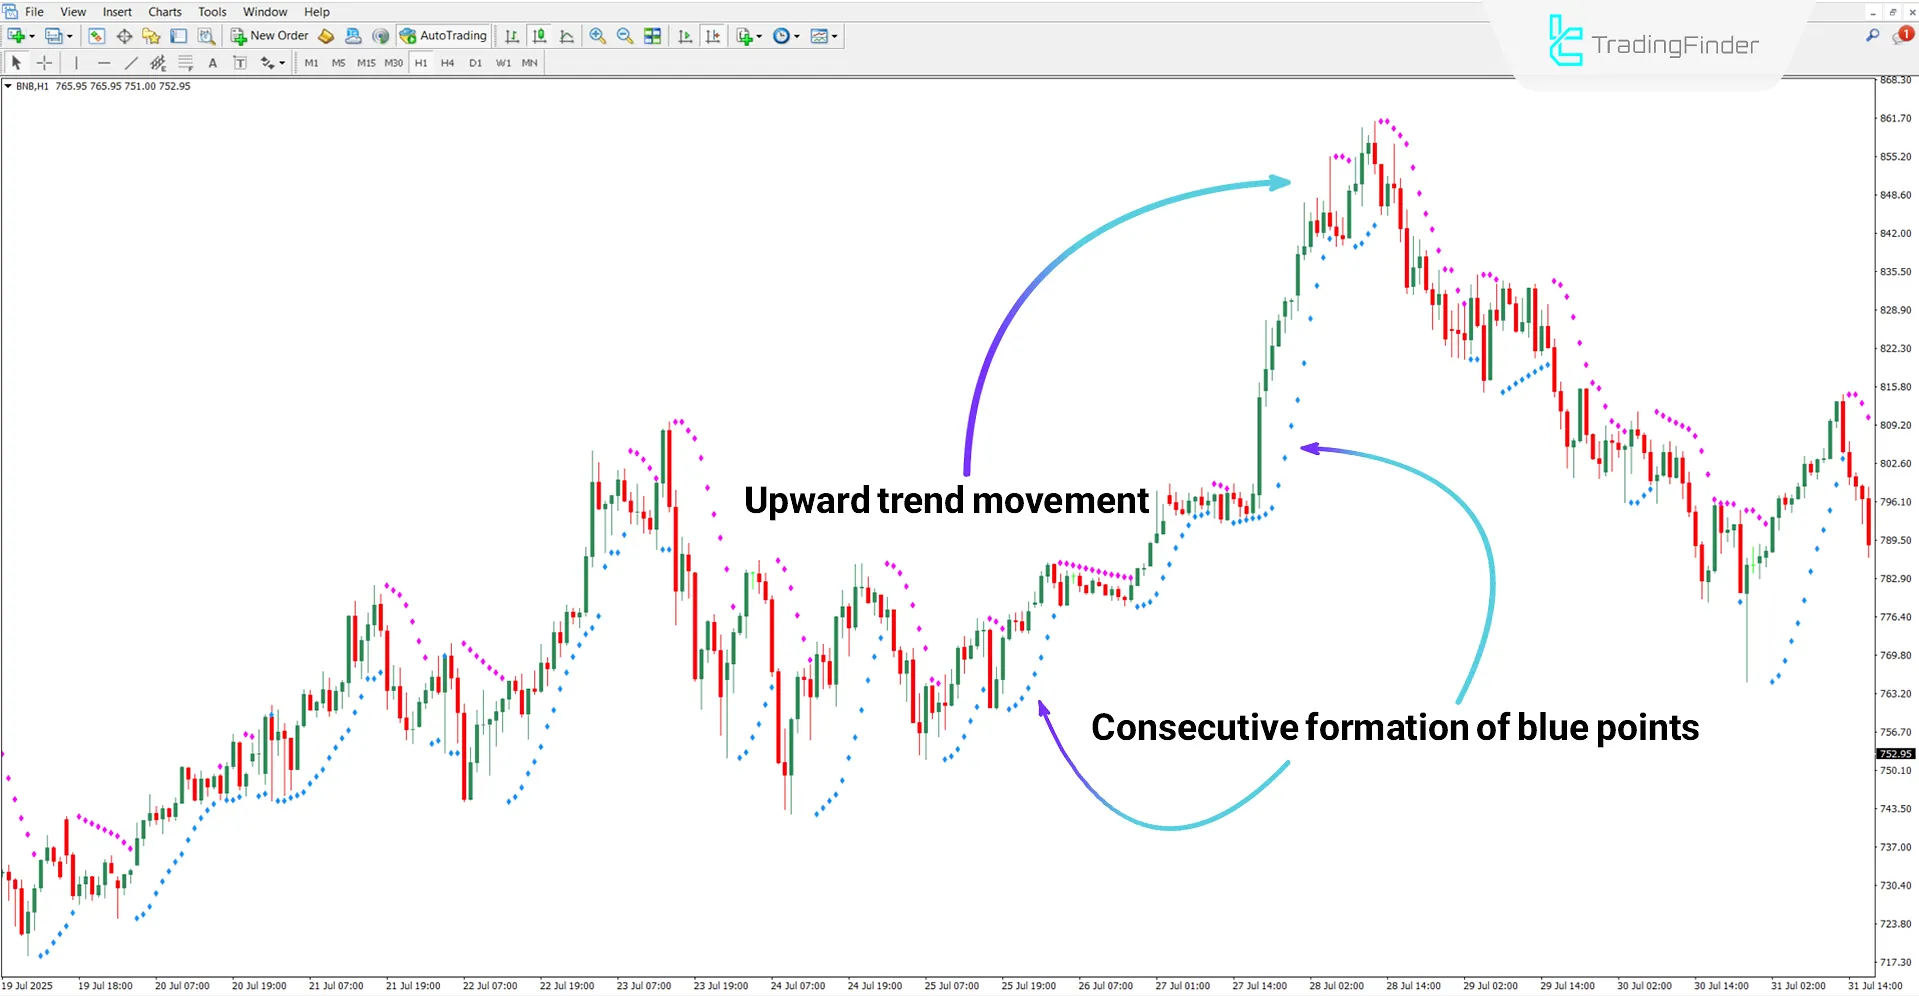
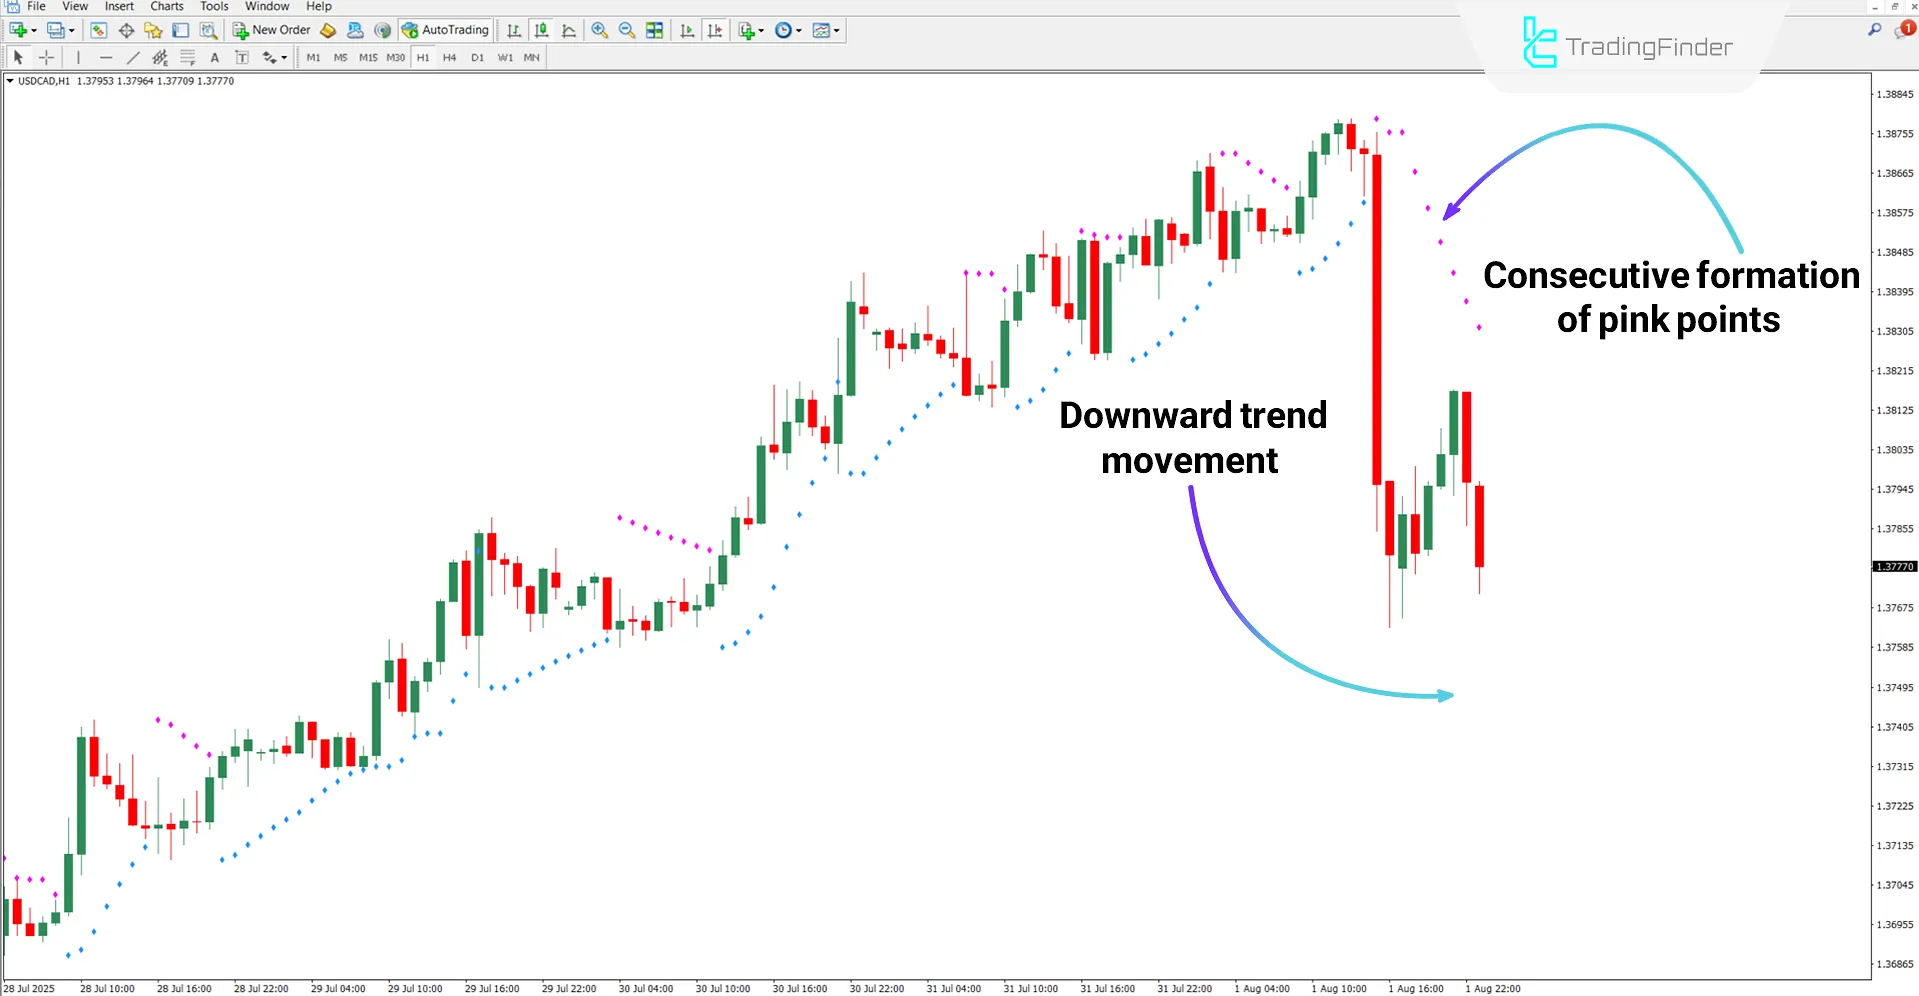
Accordingly, blue dots placed below the candles indicate an upward trend, while pink dots above the candles indicate a downward trend.
Table of Specifications for the Parabolic SAR Color Alert Indicator
Specifications of the Parabolic SAR Color Alert Indicator are shown in the table below:
Indicator Categories: | Signal & Forecast MT4 Indicators Volatility MT4 Indicators Trading Assist MT4 Indicators |
Platforms: | MetaTrader 4 Indicators |
Trading Skills: | Elementary |
Indicator Types: | Reversal MT4 Indicators |
Timeframe: | Multi-Timeframe MT4 Indicators |
Trading Style: | Day Trading MT4 Indicators Scalper MT4 Indicators Swing Trading MT4 Indicators |
Trading Instruments: | Share Stocks MT4 Indicators Indices Market MT4 Indicators Commodity Market MT4 Indicators Stock Market MT4 Indicators Cryptocurrency MT4 Indicators Forex MT4 Indicators |
Parabolic SAR Color Alert Indicator at a Glance
Color changes of the dots occur immediately upon detecting a trend change, which makes receiving reversal signals clearer.
Additionally, the Parabolic SAR Color Alert Indicator issues alerts instantly upon trend change through various methods such as email and notifications.
Buy Trade Setup
Based on the Binance Coin (BNB) cryptocurrency chart in the 1-hour timeframe, the trend of pink dots was broken and moved upward.
After that, the consecutive formation of blue dots shows the continuation of the upward trend.

Sell Trade Setup
According to the 1-hour chart of USD/CAD, after an upward movement, the price broke through the sequence of blue dots from below.
In this case, the consecutive formation of pink dots indicates the persistence and continuation of the downward trend.

Parabolic SAR Color Alert Indicator Settings
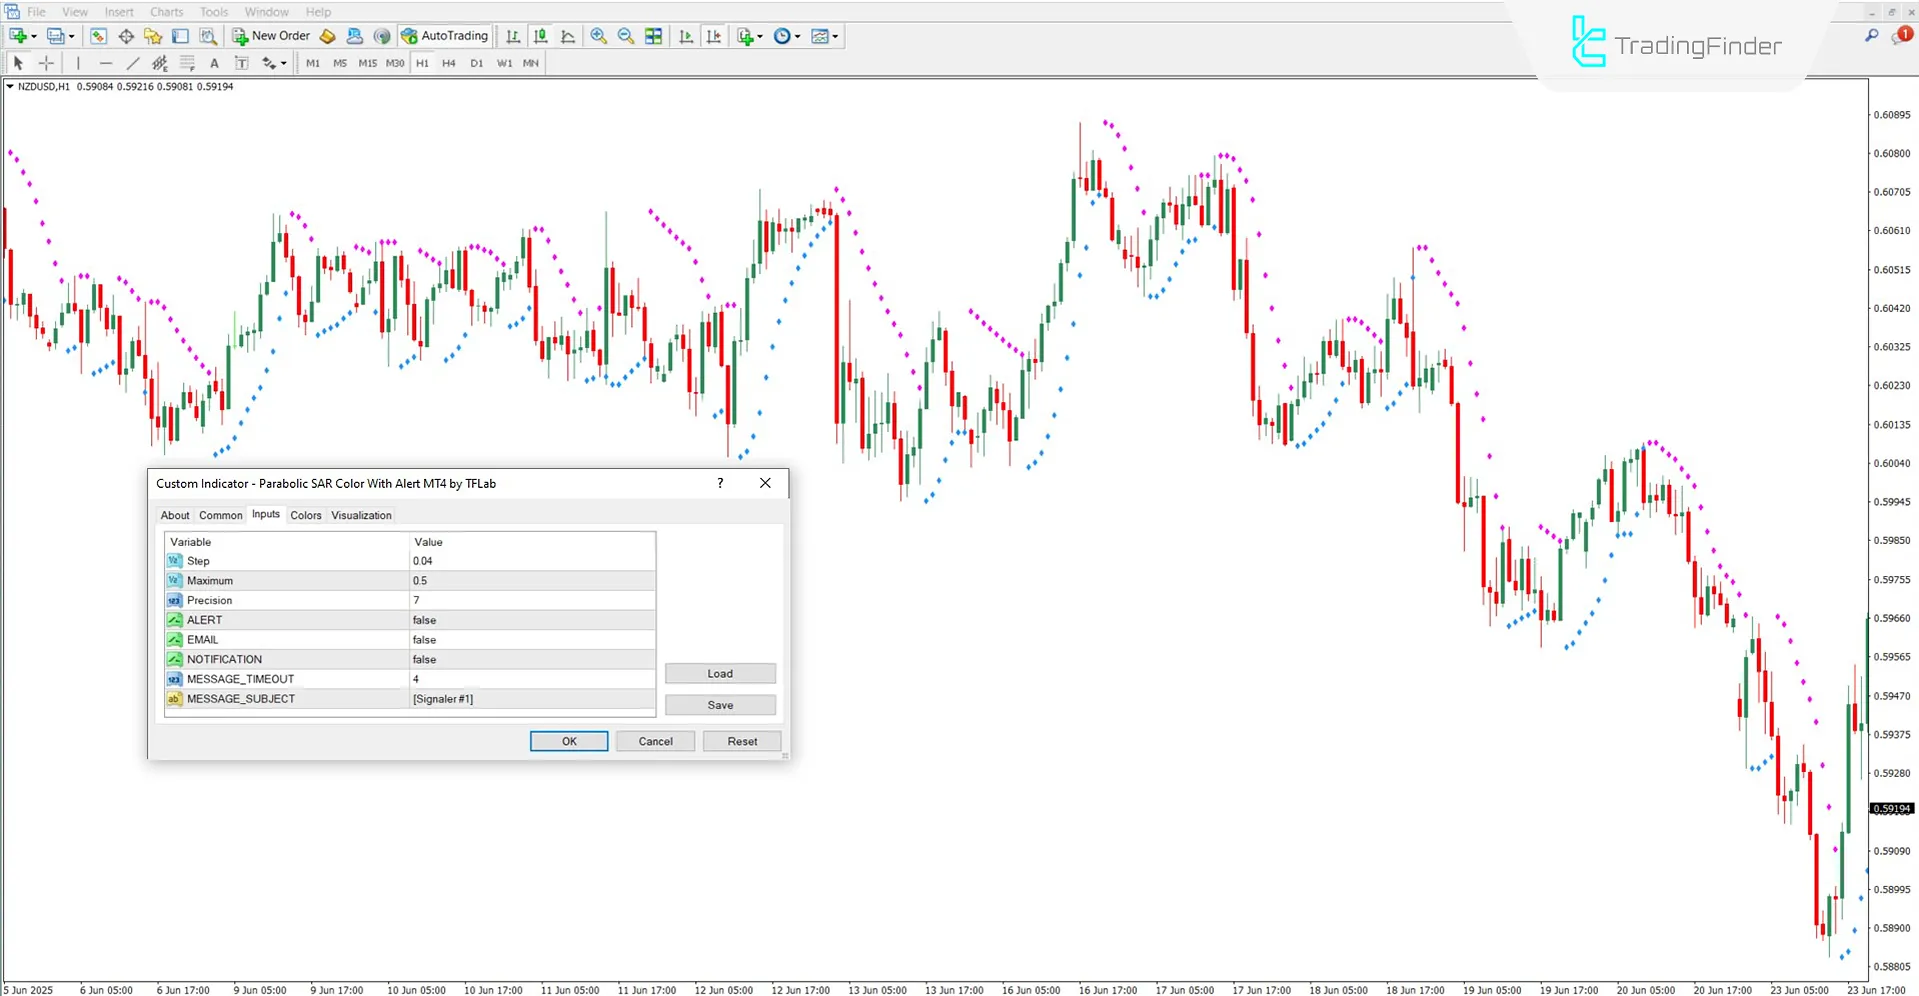
The settings of the Parabolic SAR Color Alert Indicator are as follows:

- Step: Movement step of the indicator in calculating new dots
- Maximum: Maximum allowable value for the indicator’s acceleration
- Precision: Number of decimal places for displaying numbers
- ALERT: Sound alert status when the trend changes
- EMAIL: Email sending status upon signal issuance
- NOTIFICATION: Notification reception status
- MESSAGE_TIMEOUT: Time interval between alerts in seconds
- MESSAGE_SUBJECT: Alert message title shown in the alert window or email
Conclusion
The Parabolic SAR Color Alert Indicator is designed to identify trend direction and potential price reversal points. This trading tool, using colored dots and an alert system, makes market analysis faster and more accurate.
Also, customizable settings such as movement step, display precision, sound alert, email, and notifications make this indicator a flexible choice for various trading strategies.
Parabolic SAR Color Alert Indicator for MT4 PDF
Parabolic SAR Color Alert Indicator for MT4 PDF
Click to download Parabolic SAR Color Alert Indicator for MT4 PDFIs this indicator suitable for use in the stock market?
Yes, the Parabolic SAR Color Alert Indicator can be used in all markets.
What does the consecutive formation of blue dots mean?
The consecutive formation of blue dots below the candles indicates an upward trend.
When I download Parabolic Sar for MT4 I keep getting MT5
Please get in touch with our support team.


