![Parabolic SAR Oscillator Indicator for MT4 Download – Free – [TradingFinder]](https://cdn.tradingfinder.com/image/480787/13-181-en-prabolic-sar-oscillator-indicator-mt4-01.webp)
![Parabolic SAR Oscillator Indicator for MT4 Download – Free – [TradingFinder] 0](https://cdn.tradingfinder.com/image/480787/13-181-en-prabolic-sar-oscillator-indicator-mt4-01.webp)
![Parabolic SAR Oscillator Indicator for MT4 Download – Free – [TradingFinder] 1](https://cdn.tradingfinder.com/image/480788/13-181-en-prabolic-sar-oscillator-indicator-mt4-02.webp)
![Parabolic SAR Oscillator Indicator for MT4 Download – Free – [TradingFinder] 2](https://cdn.tradingfinder.com/image/480789/13-181-en-prabolic-sar-oscillator-indicator-mt4-03.webp)
![Parabolic SAR Oscillator Indicator for MT4 Download – Free – [TradingFinder] 3](https://cdn.tradingfinder.com/image/480786/13-181-en-prabolic-sar-oscillator-indicator-mt4-04.webp)
The Parabolic SAR Oscillator Indicator is an effective tool for identifying overbought and oversold conditions, assessing the strength or weakness of momentum, and detecting trend movement changes promptly.
This oscillator is designed based on the classic "Parabolic SAR" indicator and, unlike its point-based display on the price chart, shows its signals as a dynamic oscillator below the chart.
Parabolic SAR Oscillator Specifications Table
Parabolic SAR Oscillator Specifications are as follows.
Indicator Categories: | Oscillators MT4 Indicators Momentum Indicators in MT4 |
Platforms: | MetaTrader 4 Indicators |
Trading Skills: | Intermediate |
Indicator Types: | Overbought and Oversold MT4 Indicators Reversal MT4 Indicators |
Timeframe: | Multi-Timeframe MT4 Indicators |
Trading Style: | Day Trading MT4 Indicators Scalper MT4 Indicators Swing Trading MT4 Indicators |
Trading Instruments: | Stock Market MT4 Indicators Cryptocurrency MT4 Indicators Forex MT4 Indicators |
Parabolic SAR Oscillator at a Glance
The Parabolic SAR Oscillator features two lines, one green and one red, that smoothly represent momentum changes. Additionally, when the oscillator enters overbought or oversold zones, the indicator marks these areas with red dots.
Bullish Trend Conditions
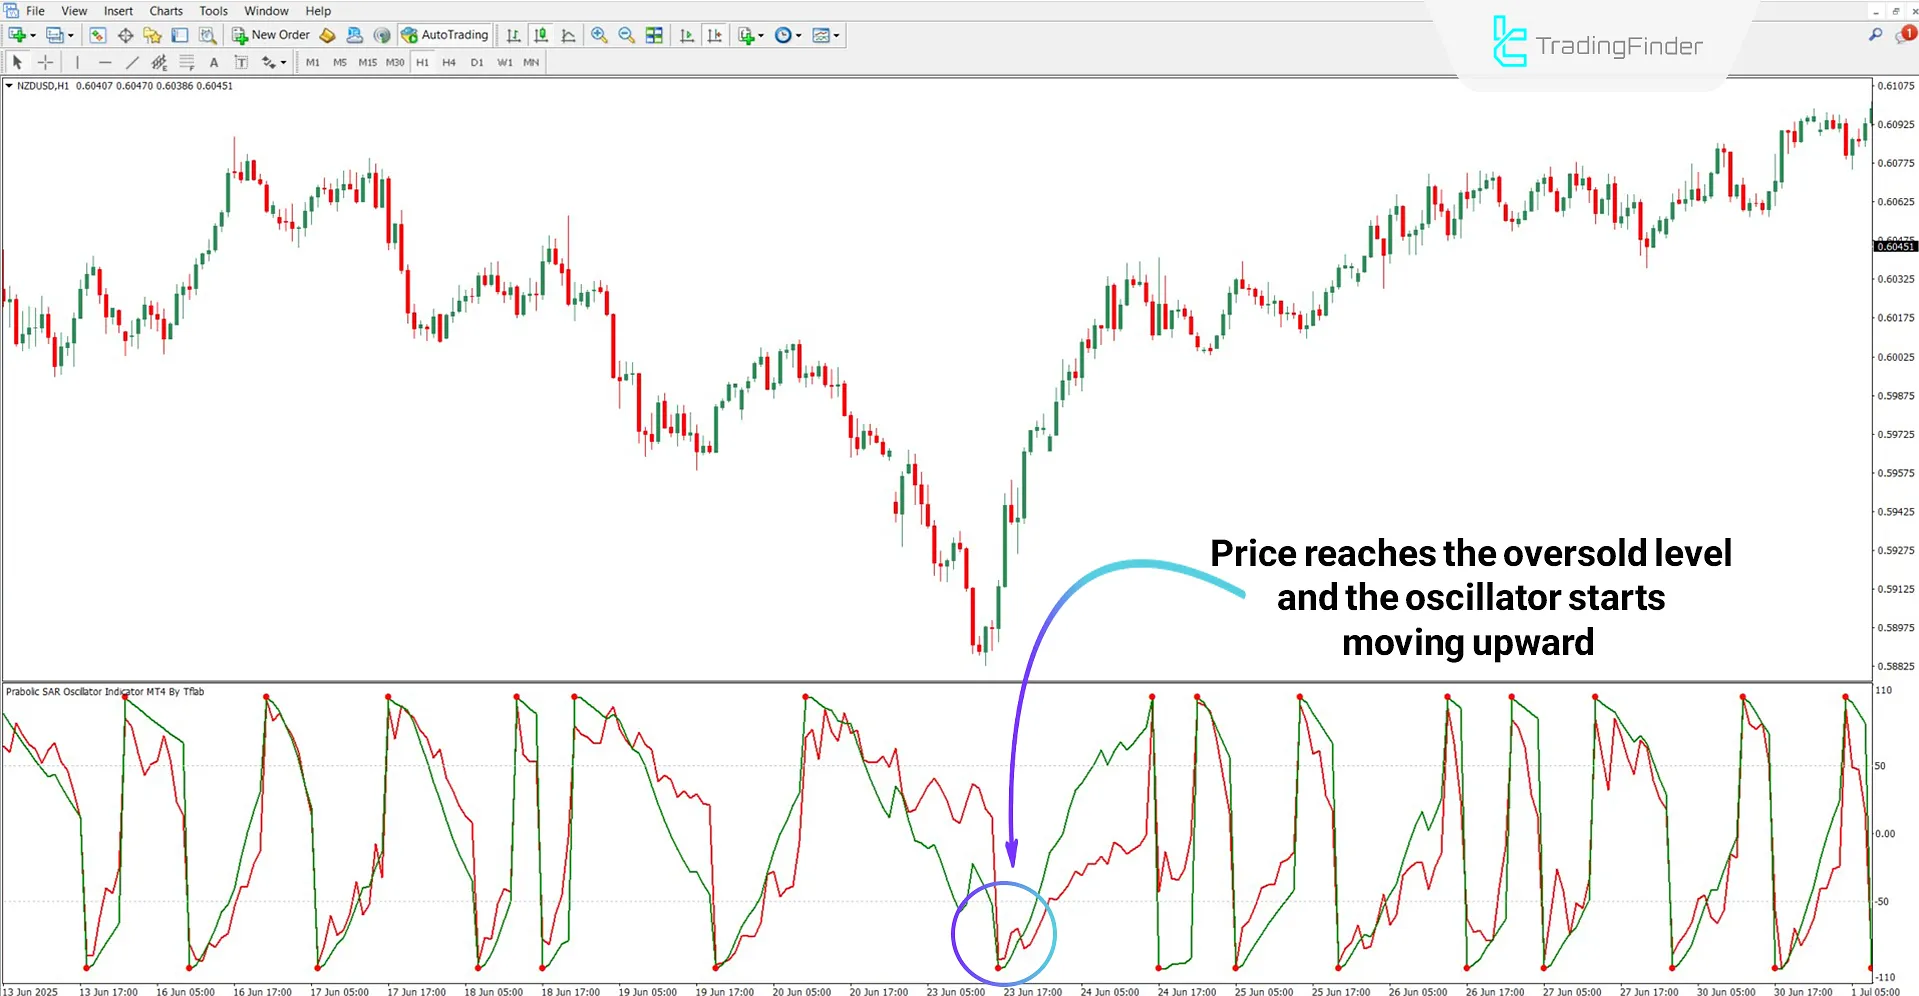
According to the NZD/USD chart, the oscillator has reached the oversold level, and a red dot has appeared in the oscillator.
Additionally, the upward movement of the oscillator lines confirms the trend reversal and marks a turning point in the market.

Bearish Trend
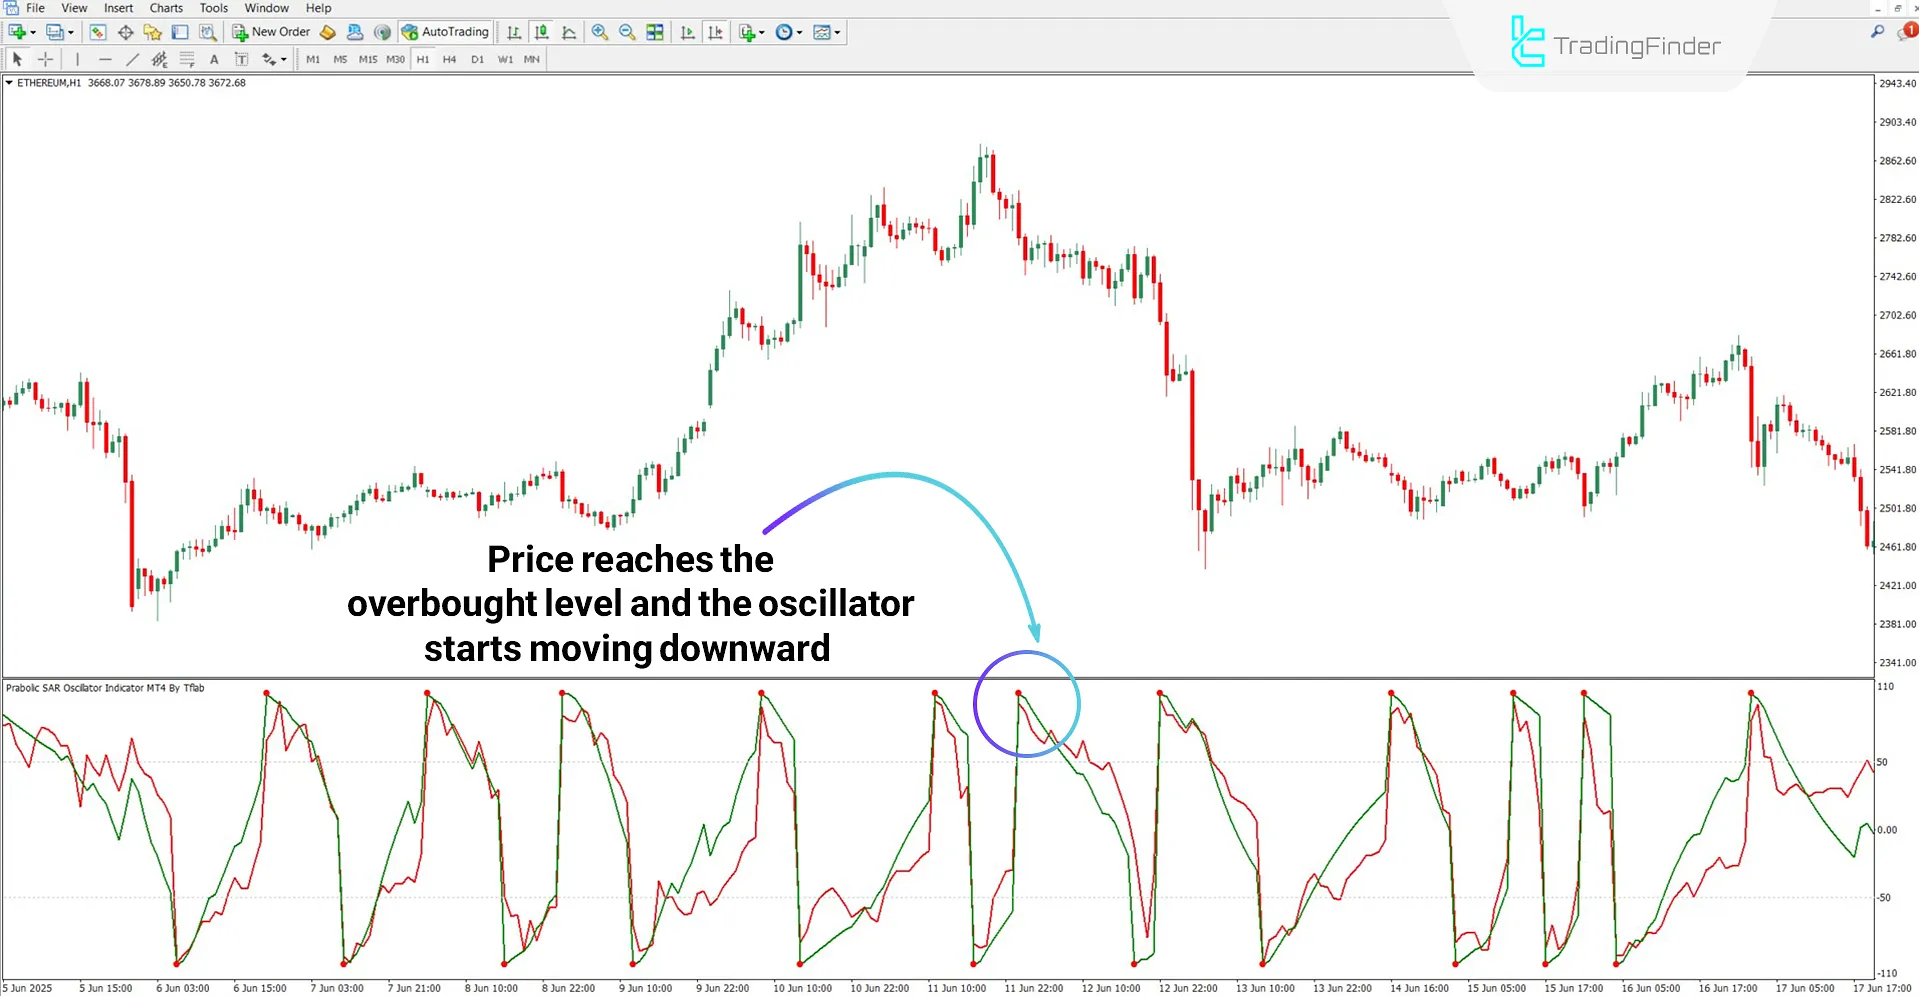
As seen in the 1-hour chart of Ethereum (ETH), the marked area was an overbought zone, and after the price broke through this level, a reversal occurred.

Parabolic SAR Oscillator Settings
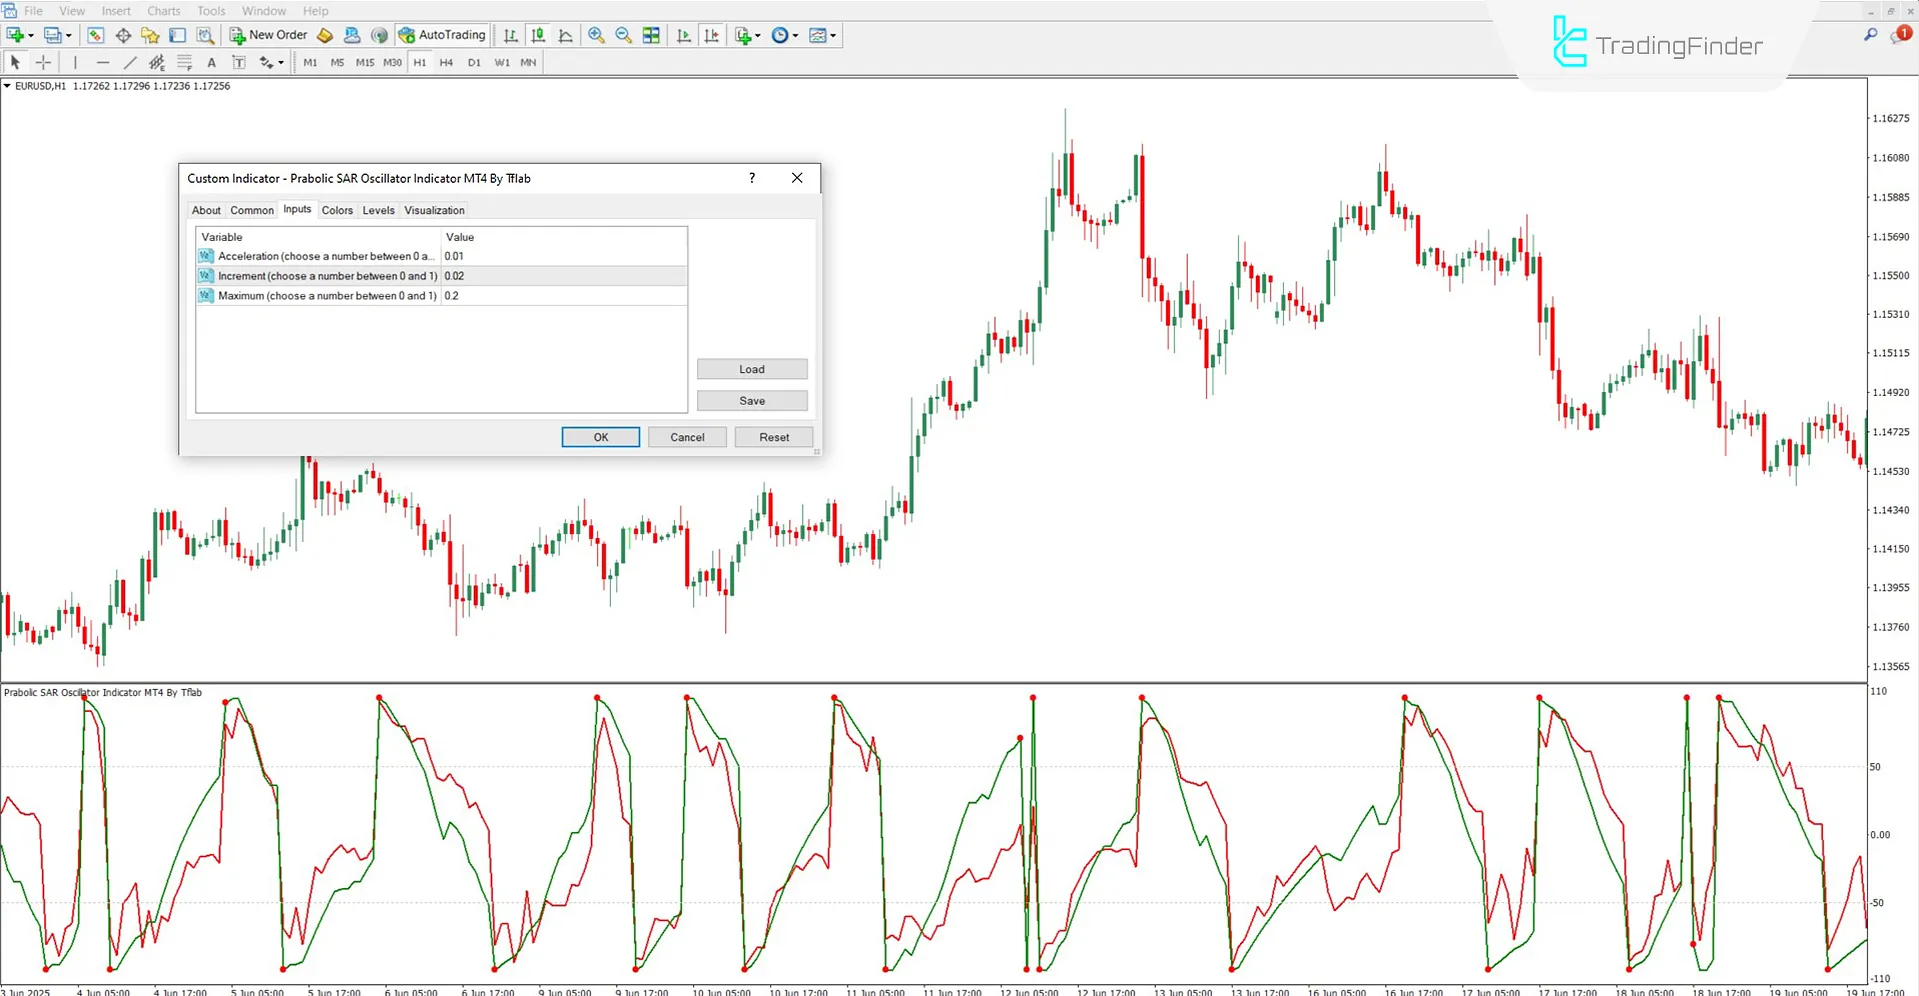
The settings of the Parabolic SAR Oscillator are shown in the image below:

- Acceleration: Initial acceleration in SAR calculations
- Increment: The rate of acceleration increase at each step of the trend
- Maximum: Maximum allowed acceleration value
Conclusion
The Parabolic SAR Oscillator offers a clearer view of momentum and potential market reversals by displaying oscillating lines instead of "SAR" points. Its settings include acceleration, increment, and maximum acceleration, which determine the accuracy and responsiveness of the indicator.
This trading tool is useful for trend detection and timing trade entries and exits.
Parabolic SAR Oscillator MT4 PDF
Parabolic SAR Oscillator MT4 PDF
Click to download Parabolic SAR Oscillator MT4 PDFCan the Parabolic SAR Oscillator be used in all markets?
Yes, this indicator is usable across all markets, including cryptocurrencies, forex, stocks, and commodities.
What is the Parabolic SAR Oscillator Indicator?
It is a trading tool designed based on the "SAR" indicator, and unlike the classic version, it displays signals as linear oscillators (not dots).


