![Pearson Spearman Correlation Indicator MT4 Download - [TradingFinder]](https://cdn.tradingfinder.com/image/263907/2-25-en-pearson-spearman-correlation-mt4-1.webp)
![Pearson Spearman Correlation Indicator MT4 Download - [TradingFinder] 0](https://cdn.tradingfinder.com/image/263907/2-25-en-pearson-spearman-correlation-mt4-1.webp)
![Pearson Spearman Correlation Indicator MT4 Download - [TradingFinder] 1](https://cdn.tradingfinder.com/image/263906/2-25-en-pearson-spearman-correlation-mt4-2.webp)
![Pearson Spearman Correlation Indicator MT4 Download - [TradingFinder] 2](https://cdn.tradingfinder.com/image/263905/2-25-en-pearson-spearman-correlation-mt4-3.webp)
![Pearson Spearman Correlation Indicator MT4 Download - [TradingFinder] 3](https://cdn.tradingfinder.com/image/263910/2-25-en-pearson-spearman-correlation-mt4-4.webp)
The Pearson Spearman Correlation tool combines statistical and technical analysis to evaluate complex relationships between variables and assess market trend changes within MetaTrader 4 indicators.
This oscillator can simultaneously analyze linear and nonlinear relationships, displaying positive and negative correlations (from -1 to 1) on the chart.
Pearson Spearman Correlation Indicator Specifications Table
The following table outlines the key features of the Pearson Spearman Correlation indicator.
Indicator Categories: | Oscillators MT4 Indicators Signal & Forecast MT4 Indicators Volatility MT4 Indicators |
Platforms: | MetaTrader 4 Indicators |
Trading Skills: | Intermediate |
Indicator Types: | Reversal MT4 Indicators |
Timeframe: | Multi-Timeframe MT4 Indicators |
Trading Style: | Day Trading MT4 Indicators |
Trading Instruments: | Stock Market MT4 Indicators Cryptocurrency MT4 Indicators Forex MT4 Indicators |
Indicator Overview
The Pearson and Spearman Correlation Oscillator comprises three key zones:
- A value of 1: indicates a perfect positive correlation (both variables move in the same direction)
- A value of 0: signifies no linear relationship
- A value of -1: shows a perfect negative correlation (one rises while the other falls)
This tool displays overbought and oversold regions using two oscillating lines and employs price bars and signal arrows to identify entry and exit points.
Uptrend Conditions
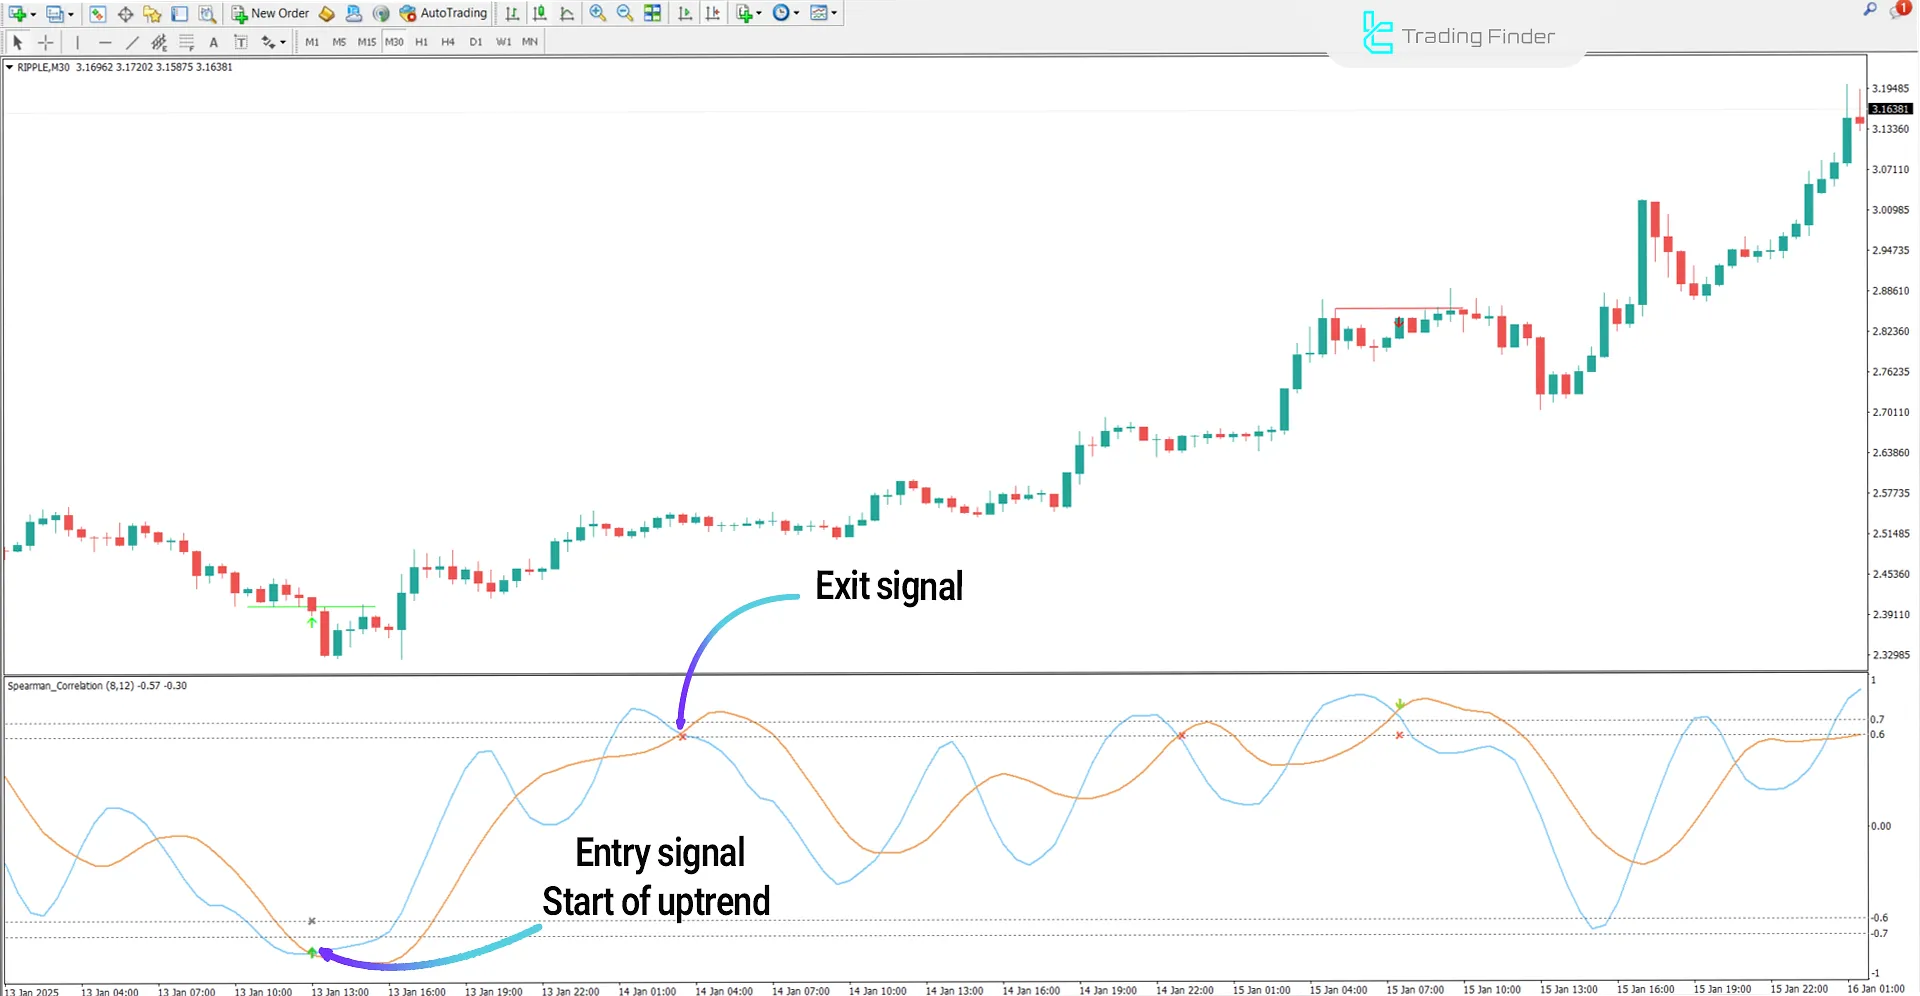
According to the Ripple (XRP) price chart in the 30-minute timeframe, the orange and blue oscillator lines oscillate between the overbought and oversold levels (+1 and -1).
When the orange and blue lines cross above the -0.7 level, and a green arrow appears, it signals an oversold condition and a buy entry signal, while a red cross indicates an exit signal.

Downtrend Conditions
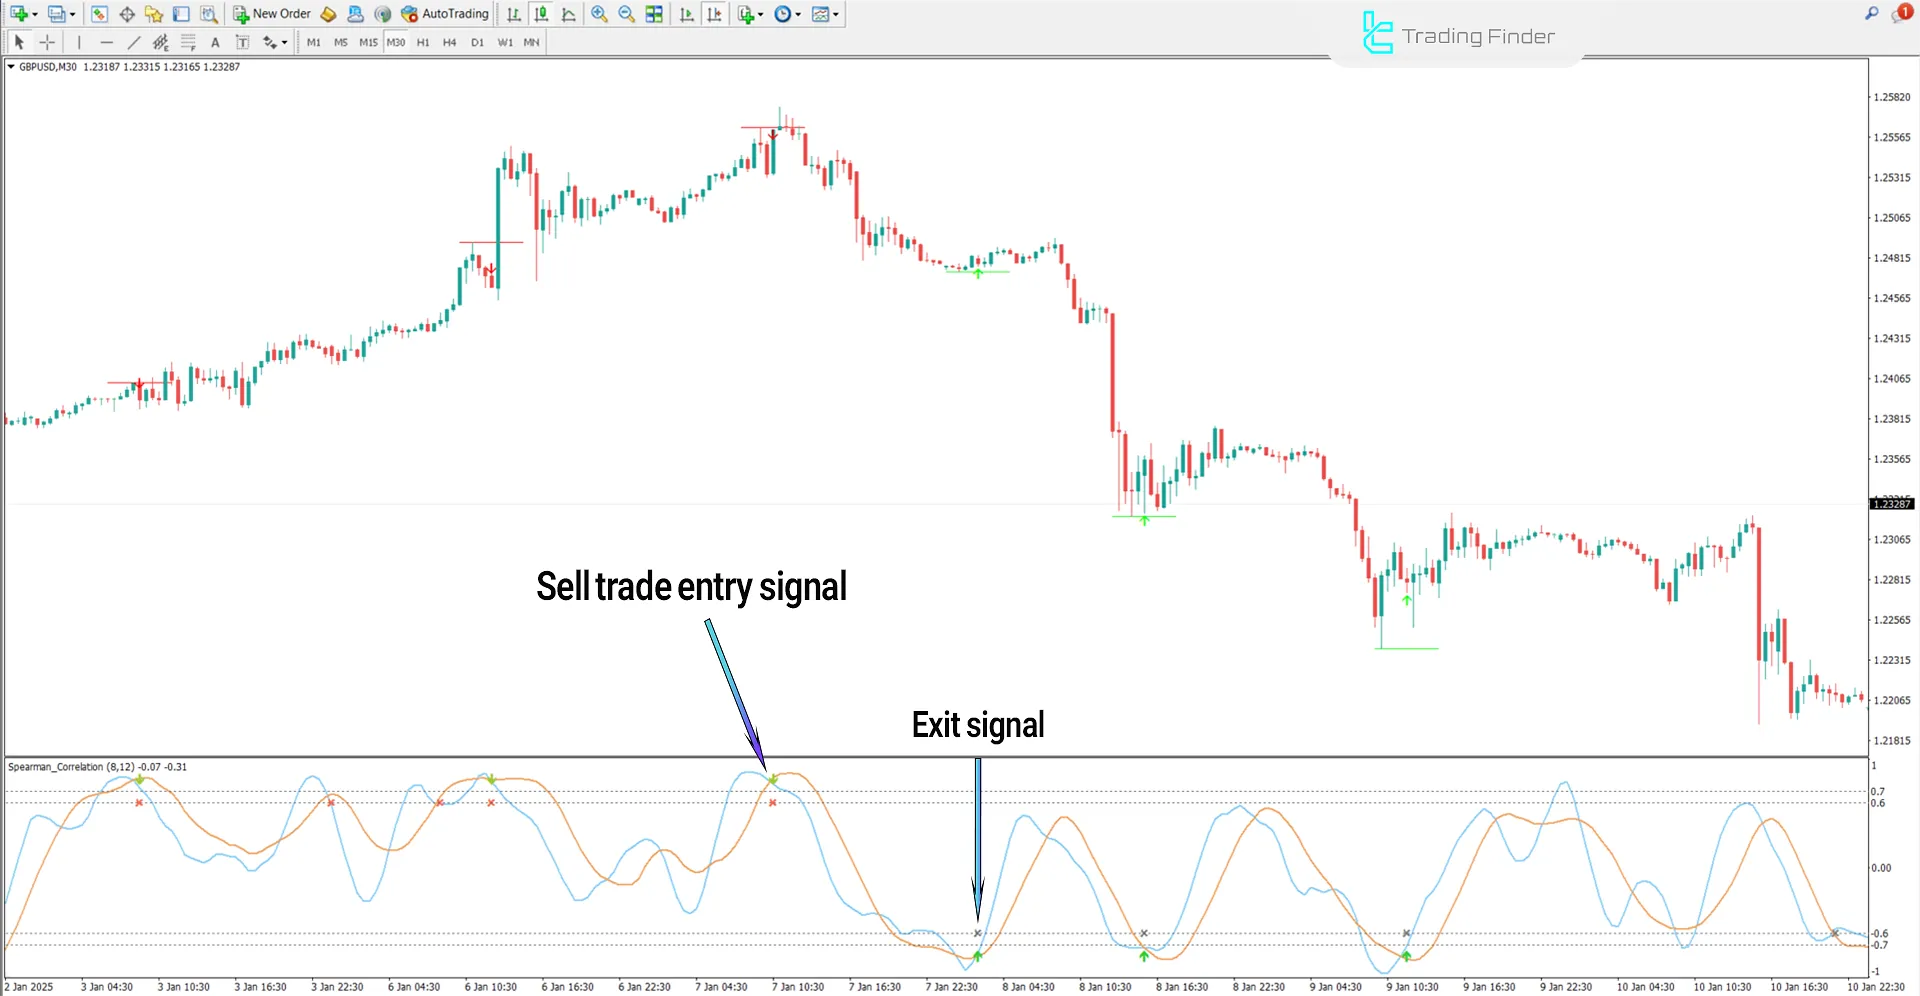
The image below displays the price chart of the GBP/USD currency pair. For a bearish trend to begin, the two oscillating lines cross in the +0.7 range.
This condition indicates reduced buying pressure and increased selling strength in the market. Consequently, a green arrow represents a sell entry signal, while a gray cross indicates an exit signal.

Indicator Settings
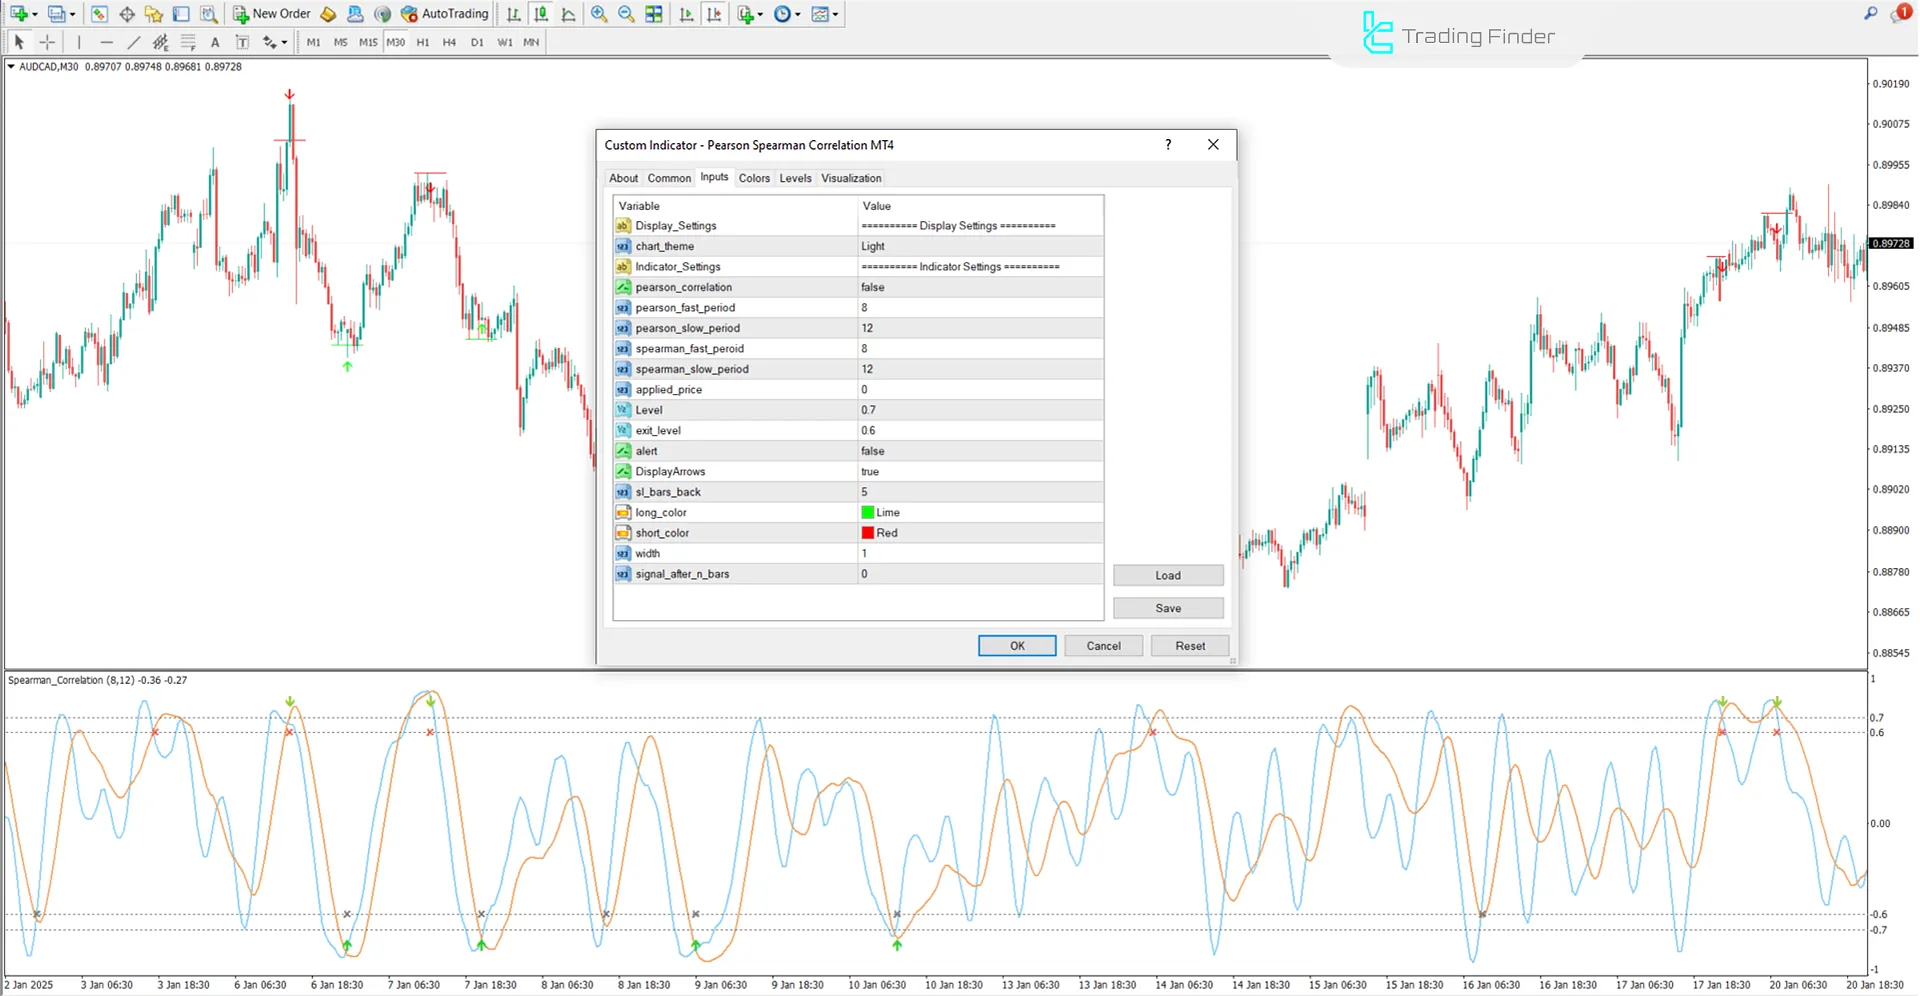
Image below displays the Pearson and Spearman Correlation indicator settings:

- Pearson correlation:Pearson Coefficient
- Pearson Fast Period: Pearson Rapid Cycle
- Pearson Slow period: Pearson Smooth Cycle
- Spearman fast period: Spearman Rapid Span
- Spearman slow period: Spearman Smooth Span
- Applied price: Input Price
- Level: Reference Level
- Exit level: Exit Threshold
- Alert: Signal Alert
- Sl bars back: Number of Previous Candles
- Long color: Buy Trade Color
- Short color: Sell Trade Color
- Width: Line Thickness
- Signal after n bars: Signal after n candles
Conclusion
The MT4 Trading Assistant indicator simultaneously analyzes Pearson (linear) and Spearman (nonlinear) correlation.
It measures correlation within a numerical range from -1 to +1, enabling the identification of co-directional (positive correlation) or inverse (negative correlation) relationships between variables and providing suitable entry and exit points.
Pearson Spearman Correlation MT4 PDF
Pearson Spearman Correlation MT4 PDF
Click to download Pearson Spearman Correlation MT4 PDFWhat is the appropriate timeframe for using this indicator?
This indicator is multi-timeframe and can be applied across all timeframes.
Does the Pearson and Spearman Correlation Oscillator provide entry and exit signals?
Yes, this tool generates entry and exit signals within the range of -1 to +1 using colored arrows.


