![Pennant Pattern Indicator for MT4 Download – Free – [TradingFinder]](https://cdn.tradingfinder.com/image/349827/13-107-en-pennant-pattern-mt4-01.webp)
![Pennant Pattern Indicator for MT4 Download – Free – [TradingFinder] 0](https://cdn.tradingfinder.com/image/349827/13-107-en-pennant-pattern-mt4-01.webp)
![Pennant Pattern Indicator for MT4 Download – Free – [TradingFinder] 1](https://cdn.tradingfinder.com/image/349829/13-107-en-pennant-pattern-mt4-02.webp)
![Pennant Pattern Indicator for MT4 Download – Free – [TradingFinder] 2](https://cdn.tradingfinder.com/image/349828/13-107-en-pennant-pattern-mt4-03.webp)
![Pennant Pattern Indicator for MT4 Download – Free – [TradingFinder] 3](https://cdn.tradingfinder.com/image/349826/13-107-en-pennant-pattern-mt4-04.webp)
The Pennant Pattern Indicator utilizes colored lines to draw two continuation patterns the Flag and the Pennant Pattern. The Pennant Pattern often signals the continuation of the current market trend and typically forms after a sharp price movement (commonly called the flagpole).
The Pennant Pattern is one of the most effective continuation patterns in technical analysis and offers favorable trading opportunities.
Pennant Pattern Indicator Specifications Table
Below are the specifications of the Pennant Pattern Indicator.
Indicator Categories: | Price Action MT4 Indicators Chart & Classic MT4 Indicators Trading Assist Tradingview Indicators |
Platforms: | MetaTrader 4 Indicators |
Trading Skills: | Elementary |
Timeframe: | Multi-Timeframe MT4 Indicators |
Trading Style: | Day Trading MT4 Indicators Fast Scalper MT4 Indicators Scalper MT4 Indicators |
Trading Instruments: | Share Stocks MT4 Indicators Forward Market MT4 Indicators Stock Market MT4 Indicators Cryptocurrency MT4 Indicators Forex MT4 Indicators |
Pennant Pattern Indicator at a Glance
The Pennant Pattern represents a compression in a small triangle, indicating a temporary market pause.
In most cases, after this pattern forms, the price continues strongly in the direction of the previous trend.
This indicator draws the Flag pattern using blue lines and the Pennant Pattern using orange lines.
Bullish Trend
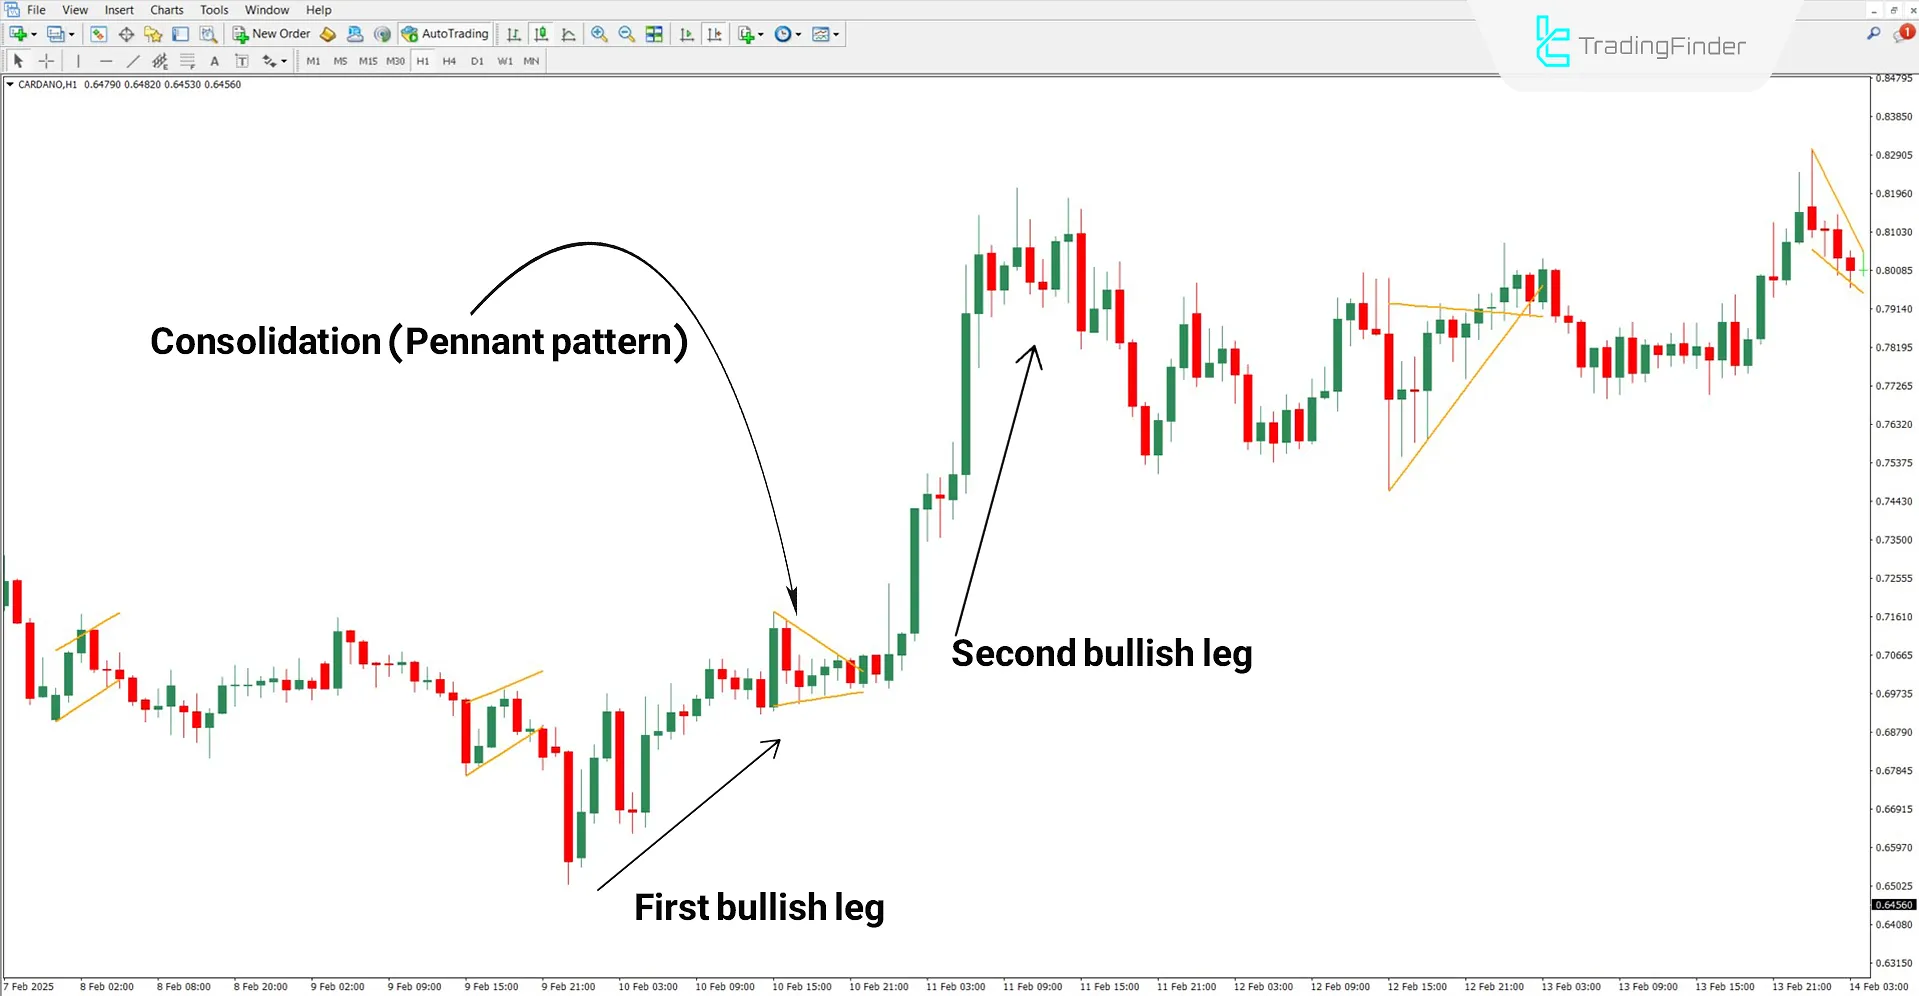
In the 1-hour Cardano (ADA) chart, following a strong bullish move (the first leg), the price enters a compression zone, and the indicator identifies and draws the Pennant Pattern.
Once the pattern breaks upwards, the continuation of the trend is confirmed, and the second bullish leg forms.

Bearish Trend
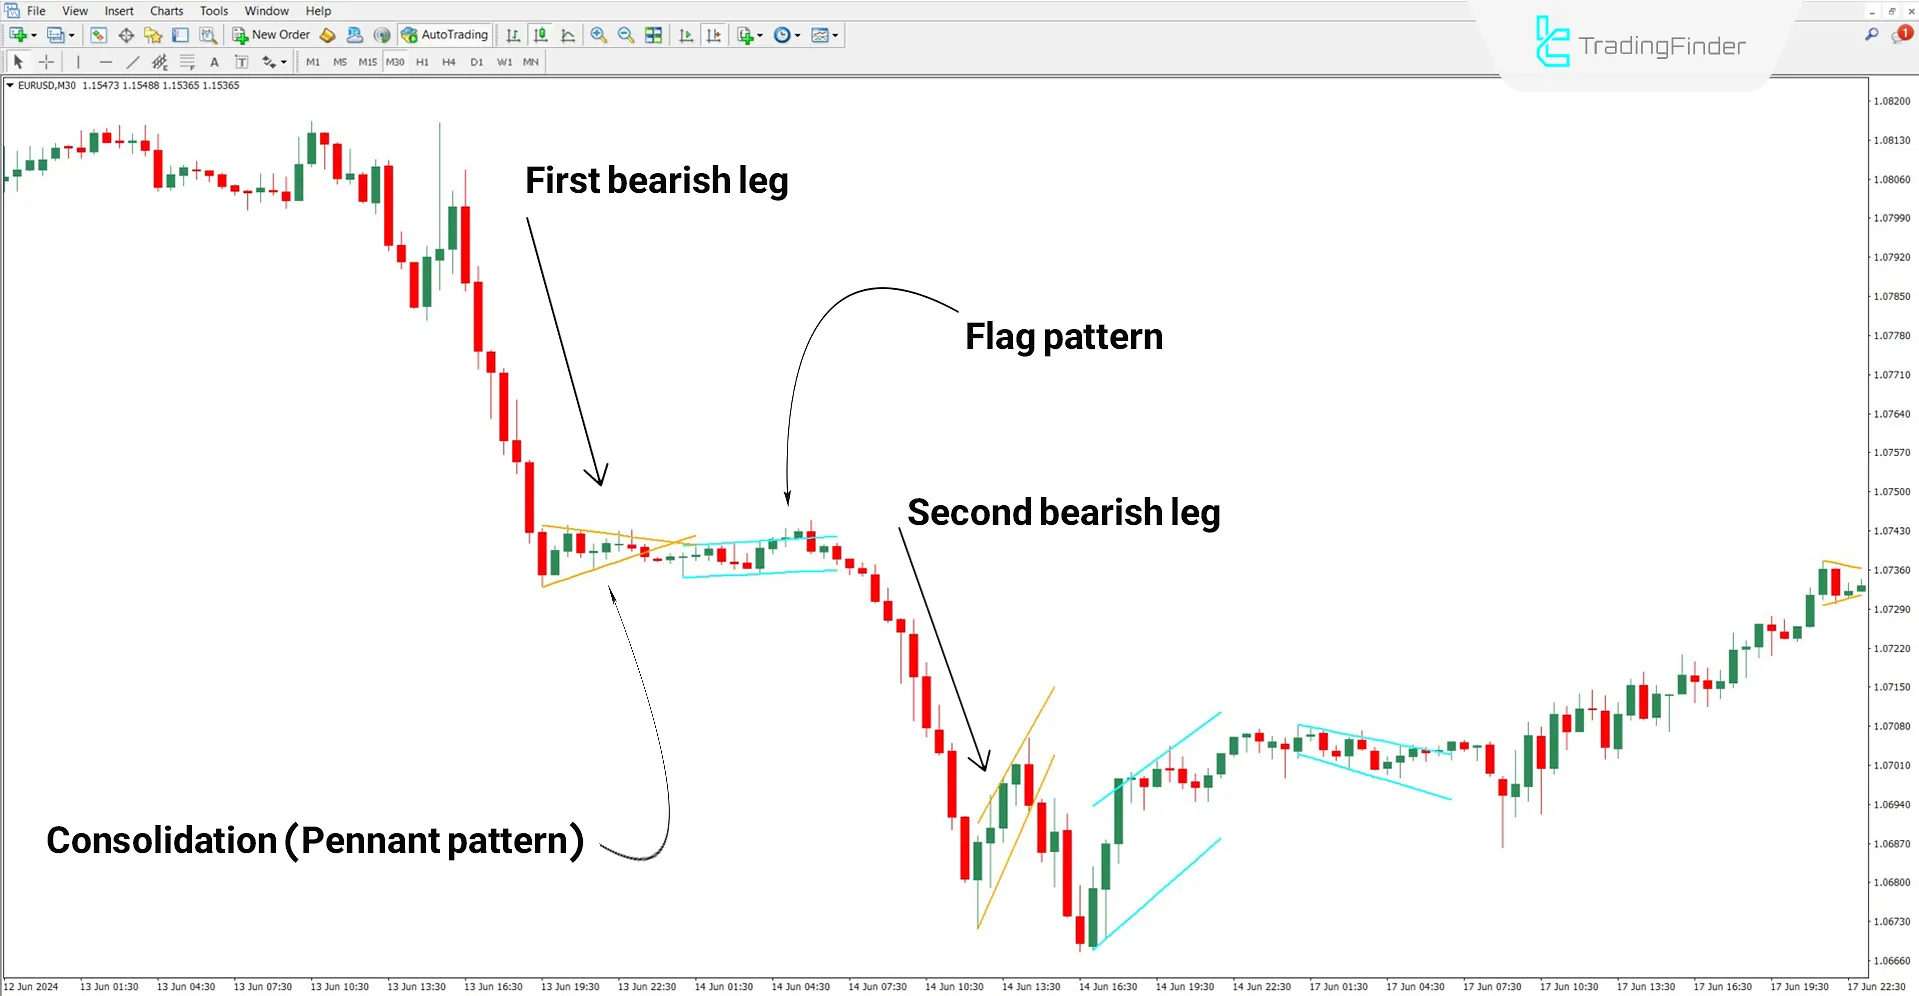
The 30-minute chart of EUR/USD demonstrates the performance of the Pennant Pattern Indicator.
After the initial drop (first bearish leg), the price enters a consolidation phase, and the indicator draws the pennant pattern.
Breaking downward from this zone will continue the move and form the second bearish leg, creating a sell opportunity.

Pennant Pattern Indicator Settings
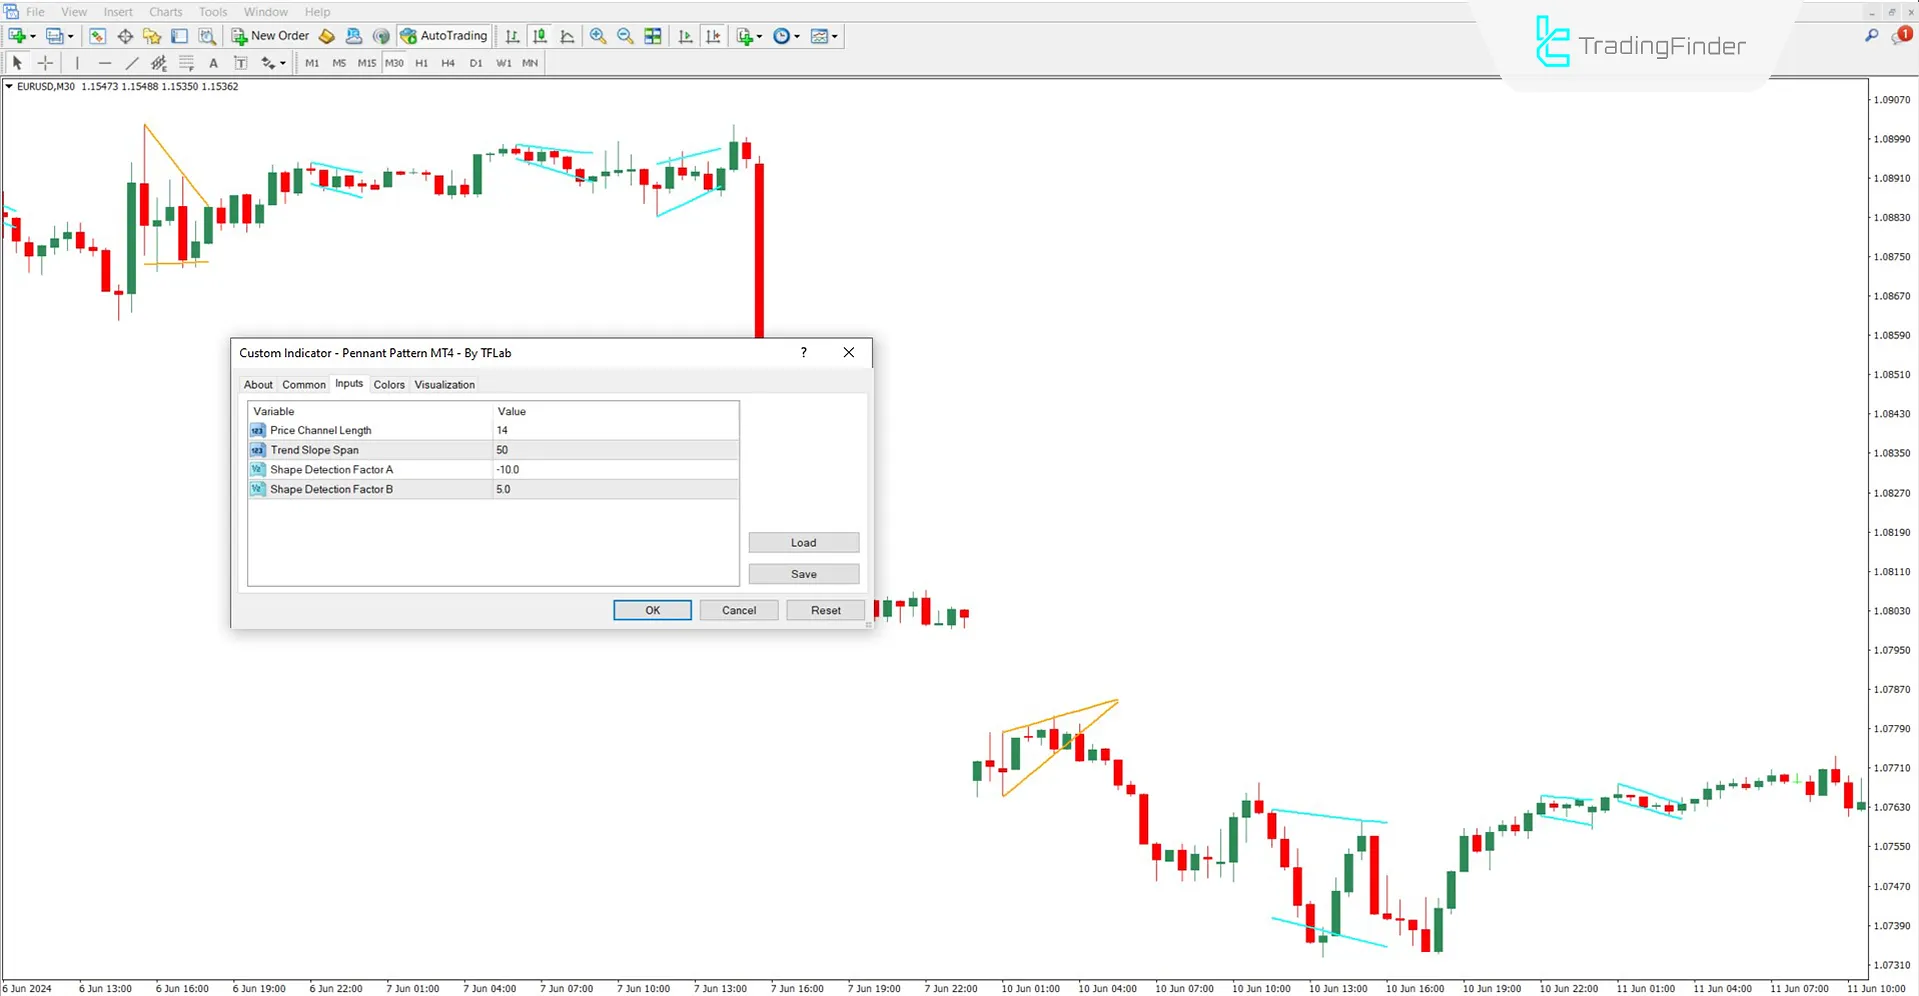
The image below shows the settings panel for the Pennant Pattern Indicator:

- Price Channel Length: Number of candles used to calculate and draw the channel
- Trend Slope Span: Parameter related to the pattern's trendline slope
- Shape Detection Factor A: Calculations for forming the Pennant pattern
- Shape Detection Factor B: Calculations related to the Flag pattern formation
Conclusion
Based on price action principles, the Pennant Pattern Indicator identifies and draws both Pennant and Flag patterns.
Both patterns form after rapid price movements and signal the potential continuation of the existing trend.
This tool can be applied across all markets, including forex, crypto, stocks, and commodities.
Pennant Pattern MT4 PDF
Pennant Pattern MT4 PDF
Click to download Pennant Pattern MT4 PDFDoes the Pennant Pattern Indicator generate trading signals?
No, this indicator does not provide entry or exit signals.
Is the Pennant Pattern Indicator usable on higher timeframes?
Yes, this multi-timeframe indicator can be used on all timeframes.


