![Perfect Trendline Indicator for MT4 Download - Free - [Trading Finder]](https://cdn.tradingfinder.com/image/198031/13-60-en-perfect-trendline-mt4-01.webp)
![Perfect Trendline Indicator for MT4 Download - Free - [Trading Finder] 0](https://cdn.tradingfinder.com/image/198031/13-60-en-perfect-trendline-mt4-01.webp)
![Perfect Trendline Indicator for MT4 Download - Free - [Trading Finder] 1](https://cdn.tradingfinder.com/image/198030/13-60-en-perfect-trendline-mt4-02.webp)
![Perfect Trendline Indicator for MT4 Download - Free - [Trading Finder] 2](https://cdn.tradingfinder.com/image/198029/13-60-en-perfect-trendline-mt4-03.webp)
![Perfect Trendline Indicator for MT4 Download - Free - [Trading Finder] 3](https://cdn.tradingfinder.com/image/198032/13-60-en-perfect-trendline-mt4-04.webp)
The Perfect Trendline indicator displays the trend's direction using two moving average lines (MA) with periods of 3 and 7.
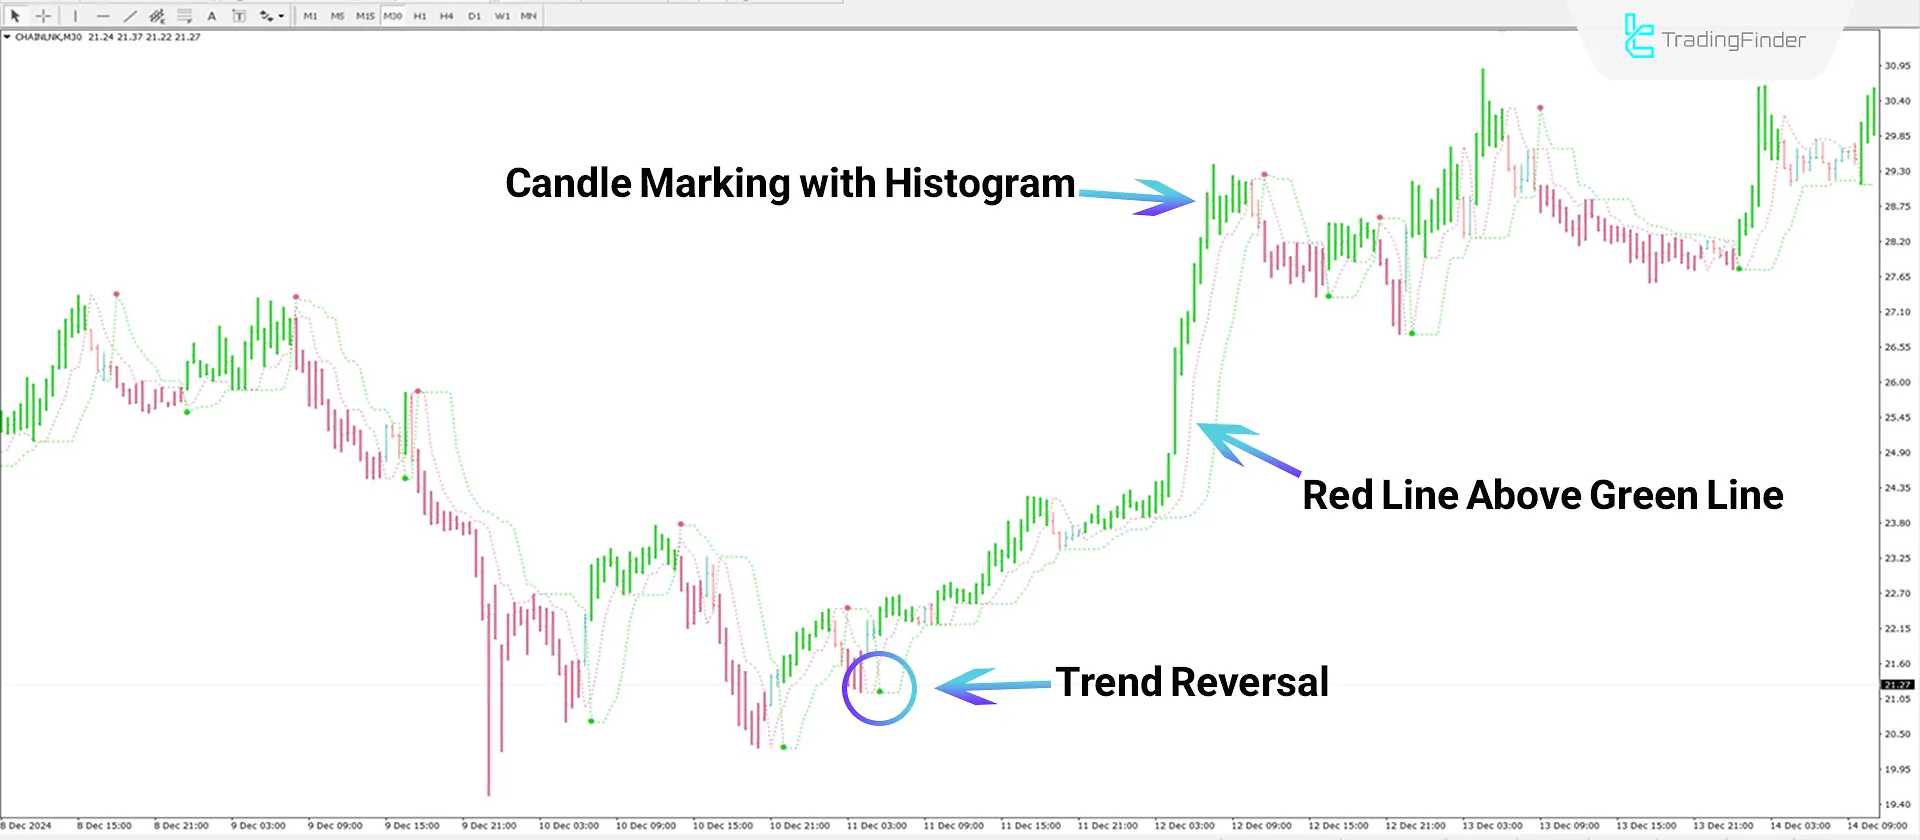
When the red line (fast moving average) is above the green line (slow moving average), the trend is considered bullish, and candles are marked with green histograms.
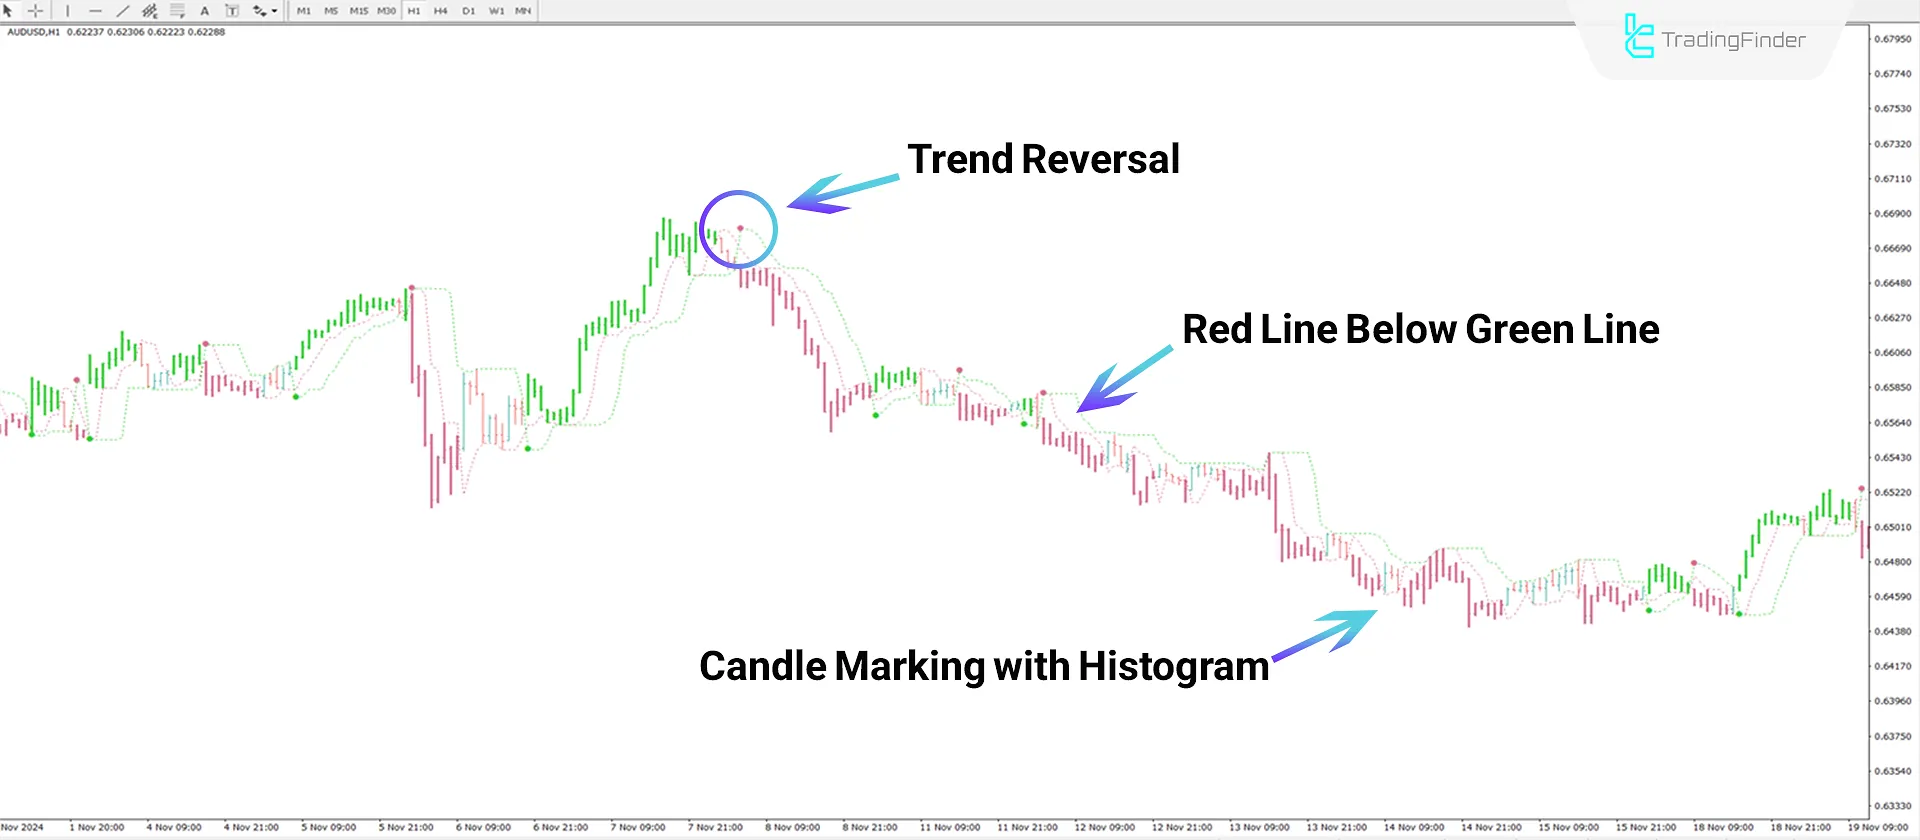
Conversely, the red line below thegreen line indicates a bearish trend and red histograms are formed. This trading tool is widely used and also falls under the category of MT4 signal and forecast indicators, making it essential for traders
Perfect Trendline Indicator Table
The table below shows the specifications and features of the indicator:
Indicator Categories: | Signal & Forecast MT4 Indicators Trading Assist MT4 Indicators Levels MT4 Indicators |
Platforms: | MetaTrader 4 Indicators |
Trading Skills: | Elementary |
Indicator Types: | Reversal MT4 Indicators |
Timeframe: | Multi-Timeframe MT4 Indicators |
Trading Style: | Day Trading MT4 Indicators Scalper MT4 Indicators Swing Trading MT4 Indicators |
Trading Instruments: | Share Stocks MT4 Indicators Forward Market MT4 Indicators Indices Market MT4 Indicators Commodity Market MT4 Indicators Stock Market MT4 Indicators Cryptocurrency MT4 Indicators Forex MT4 Indicators |
Indicator at a Glance
The Perfect Trendline indicator uses colored dots at the inte rsection of the fast and slow moving averages. The intersection points signal trend changes and entry (Buy) into trades.
Bullish Trend Conditions
As shown in the example below, a green dot appears after the red line breaks the green line, indicating a potential trend reversal.
Following this, the fast moving average (green line) moves above the slow moving average (red line), and the consecutive green histograms form, indicating the trend is bullish.

Bearish Trend Conditions
According to the 1-hour chart of the AUD/USD currency pair, the appearance of a red dot indicates the intersection of the moving averages and the trend reversal.
Additionally, the fast moving average (red line) movement below the green line and the marking of candles with red histograms indicate a bearish trend.

Indicator Settings
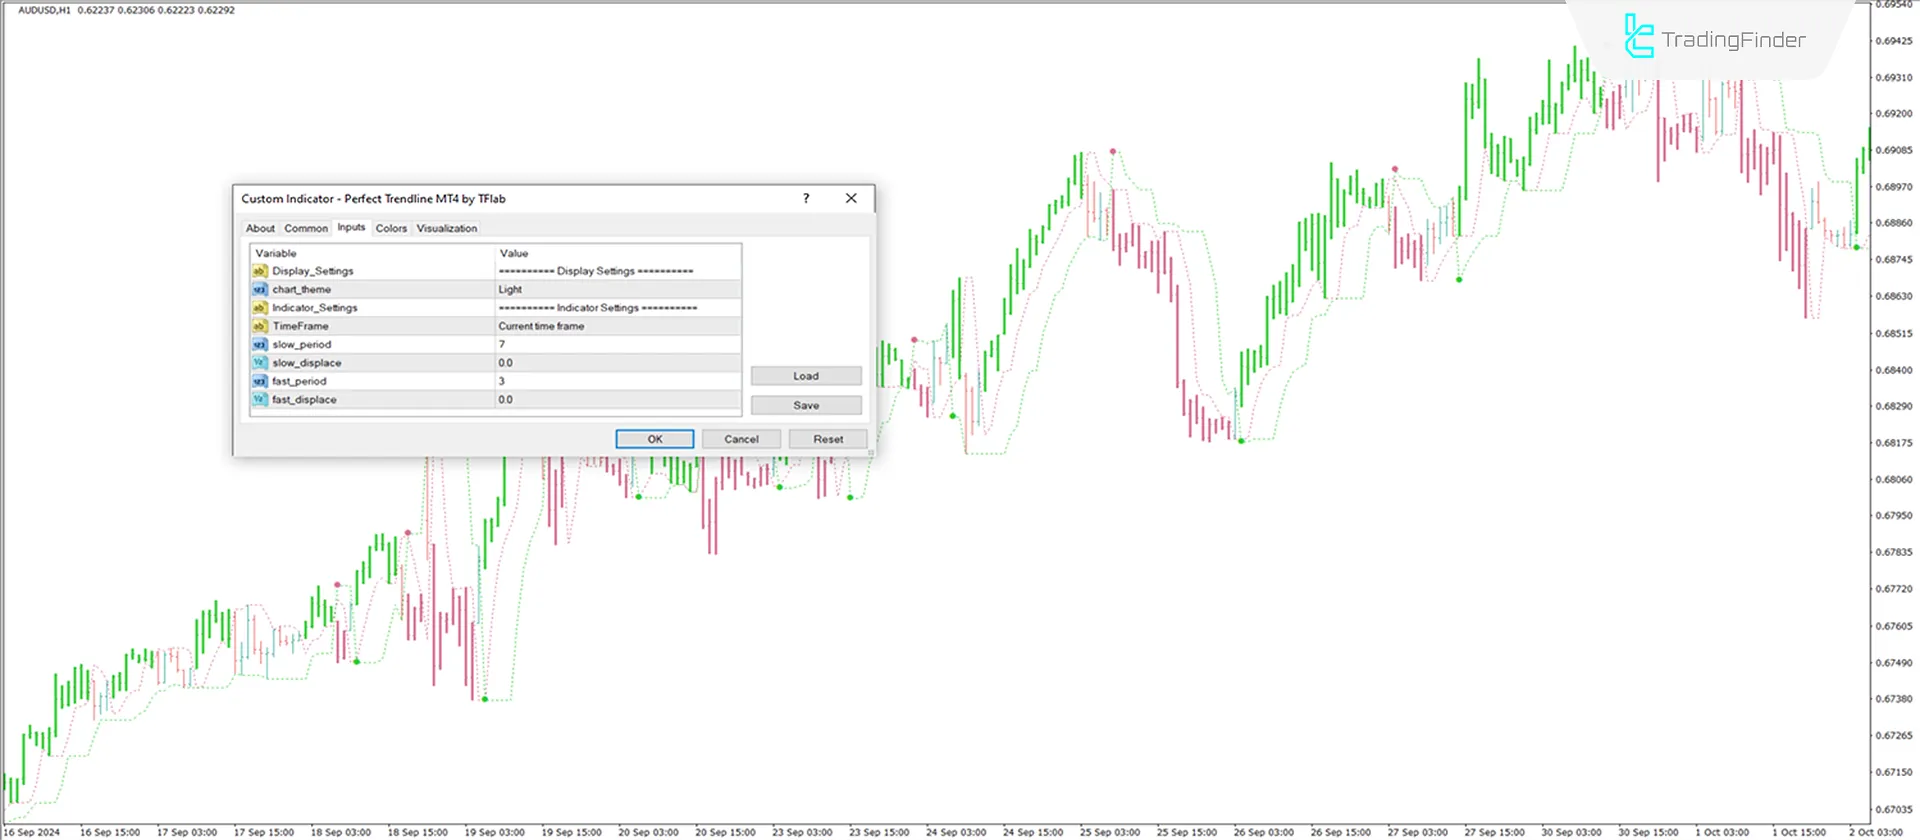
The settings for the Perfect Trendline indicator are as shown in the image below:

- Chart Theme: Indicator theme
- Time Frame: Time frame setting
- Slow Period: Slow moving average period 7
- Slow Displace: Slow moving average displacement 0.0
- Fast Period: Fast moving average period 3
- Fast Displace: Fast moving average displacement 0.0
Conclusion
The Perfect Trendline indicator is a tool for identifying trend reversal points and the main price movement in MetaTrader 4.
This trading tool uses fast and slow moving averages to define the main trend fluctuations. Additionally, this indicator's candle marking with histograms and displaying the intersection of moving average lines are other features.
Perfect Trendline MT4 PDF
Perfect Trendline MT4 PDF
Click to download Perfect Trendline MT4 PDFCan the indicator parameters be adjusted to enhance performance?
Yes, traders can adjust the parameters in the settings to customize the indicator according to different strategies.
Is the Perfect Trendline indicator suitable for day trading?
Yes, this indicator can be useful for identifying trading opportunities across multiple timeframes.


